#Nifty Directions and Levels for Jan 7Good morning, friends! 🌞
Market Directions and Levels for Jan 7
Global markets are showing a positive outlook. However, the Indian market has a moderately bearish outlook.
Today, the market may open with a neutral to slightly gap-down start, as GIFT Nifty is trading about 70 points lower.
What to Expect Today?
Based on the current structure, the market remains range-bound. The structures of Nifty and Bank Nifty are slightly different, which reflects mixed sentiment.
Overall, the market is likely to continue its range-bound structure today as well.
> If the market sustains the negative opening, it may reach the bottom of the current swing.
> On the other hand, if the market bounces back initially, it could retrace 38%–50% of the current swing, indicating that the range-bound movement is likely to continue.
This is the broader structure. Now, let’s look at the individual indices.
Nifty
Current view: If the gap-down sustains, the market may consolidate around the pullback zone. After that, if it breaks it, we can expect correction continuation.
Alternate view: If the market starts positively or rejects sharply around the pullback zone, we can expect at least 38% to 50% of the current swing.
Niftytrend

#Nifty Directions and Levels for Jan 6Good morning, friends! 🌞
Market Directions and Levels for Jan 6
There have been no major changes in the local or global markets. Both the global and Indian markets are showing a bullish outlook.
Today, the market may open with a neutral start, as GIFT Nifty is trading about 65 points higher.
What to Expect Today?
> In the previous session, both Nifty and Bank Nifty declined even though they opened positively.
If we analyze the chart, the market has taken a 61% retracement of the minor swing. This lies in the mid-range of the swing; therefore, today’s market may undergo consolidation within the previous day’s range.
> We can expect a clear directional move only if the market breaks either the current swing high or the swing low. Until then, the market bias remains neutral.


nifty outlook for 06.01.2026nifty currently showing bullish momentum, but the ongoing geopolitical uncertainty could trigger downside preassure. there is notable liquidity on the lowerside.
bearish scenario: if nifty open with bearish candle below 26200,a short move may develop towards 25900.
bulish scenario: if nifty opens flat and forms a bulish candle closing above 26300,an upside move towards 26470 is likely

Daily Analysis: Nifty 6th Jan 2026The candles are under process of head and shoulder pattern (bearish). The right shoulder is still to be formed and it is projected to 26200-26250 as resistance for this shoulder.
All major levels are mentioned in the video, so watch the entire video.

BTR Update| 05 Jan 2026 |BSE Volatile, Smart Recovery📊 BTR Update — 05 Jan 2026 | Volatile Market, Smart Recovery
Stock: BSE LTD
Timeframe: 15-Min
Indicator: BTR Price Action
🔥 Market Condition
Today BSE LTD was highly volatile — sharp moves on both sides.
Volatility is where many traders lose discipline, but BTR handled it perfectly with rule-based exits and re-entries.
🧠 Trade Breakdown (Step-by-Step)
🔻 First Scenario: Short Trade (Loss Controlled)
BTR Signal: Short
Entry: 2638
Exit: 2653
Result: ❌ -15 Points
👉 Trend reversed quickly.
👉 BTR did not hold blindly — exit triggered as per rules.
🔺 Second Scenario: Trend Reversal → Long Trade (Recovery)
BTR Signal: Long (Re-entry after exit)
Entry: 2653
Exit: 2702
Result: 🟢 +49 Points
👉 Strong bullish continuation
👉 Loss from first trade fully recovered
👉 Net day turned profitable
📈 Final Outcome (Intraday)
Gross Profit: +49 Points
Loss: -15 Points
Net Result: 🟢 ~ +34 Points
Key Highlight: Loss recovery within the same session
🎯 What This Trade Proves
✔ BTR adapts to changing market structure
✔ Losses are small and controlled
✔ Re-entries are rule-based, not emotional
✔ Volatility ≠ danger if you follow the system
❝ The goal is not to avoid losses —
the goal is to recover them with discipline. ❞
📌 Important Trading Lesson
Many traders:
Panic after first loss ❌
Skip the next signal ❌
BTR traders:
Exit fast ✔
Re-enter with confirmation ✔
Let probabilities work ✔
📍 Follow for Daily BTR Updates
📊 BTR Price Action Indicator
🖥️ Find it in my profile → Scripts section
💬 DM for intraday & option trading guidance using BTR

Daily Analysis: Nifty 05/01/2026This week's outlook for Nifty50. Prices are showing bullish signals, also GiftNifty trading higher than last session.
The monthly outlook will be shared later with few more details.

IOB Contra trade
About to give breakout after forming a solid base near 33-34 levels.
Keep an eye over orange trendline
could be a multibagger

IDBI BANK SOLID BREAKOUTIDBI BANK has given a solid breakout with 10x the average volume.
Very beautiful cup and handle breakout
Though RSI is little stretched on daily time frame but looks good on weekly, safe traders can add only 50% of qty here and rest at retest.
Target -128 and 145

BHELBHEL is looking good on daily time frame. It has given a good breakout with decent volume. If sustained it can reach Its ATH.
Trading above all its imp EMA
RSI is strong
target -330
time- 2-3 months

NIFTY : A 5%-6% correction from Higher LevelsNSE:NIFTY
its s Weekly Chart.
26,515 | 26,786
These are the two levels to watch out when the market is showing upside momentum.
These are extensions of the previous upswing.
These are the most prominent levels for Wolfe Wave that is forming currently.
The open of the Calendar Year 2026 being 26,173. This must be respected by the Bulls (+/- 0.5%)
for continuation of the up-move till above mentioned two levels.
Any weakness around any of these two levels (26,515 | 26,786) will trigger Wolfe Wave and the down-side targets are 5% and 6% deep (As mentioned on the chart).
Use price action and SMC while trading around these levels. Macro-economics and Geo-economics (Geo-politics) are quite vulnerable and may surprise both Bulls and Bears.
FII Liquidity is moving towards lower PE regimes and metals are their center point for now. Expect more sectorial churn on a Weekly/Monthly basis.

NIFTY VIEW 2026Do you think breaking above ATH will make nifty bullish?
Sorry but this isn't the story: As u can see in the chart its been more than 1 year Nifty has been trading between 3 trend lines safron, white and green.
Nifty won't be considered bullish till it closes above the white line. Keep an eye on those levels before going all Bonkers !!

ICICIBANK "W" Pattern Reversal at Multi-Week Support | Bullish SICICIBANK "W" Pattern Reversal at Multi-Week Support | Bullish Reversal Setup
━━━━━━━━━━━━━━━━━━━━━━━━━━━━━━━━━━━━━━━━━━━
📊 TECHNICAL SETUP
Current Price: 1,343.90 (+0.44%)
Timeframe: Weekly (1W)
Symbol: ICICIBANK (ICICI Bank Limited)
Exchange: NSE
Category: Stock / Banking Sector
━━━━━━━━━━━━━━━━━━━━━━━━━━━━━━━━━━━━━━━━━━━
🎯 PATTERN ANALYSIS - "W" DOUBLE BOTTOM REVERSAL (Formation in Progress)
ICICIBANK is currently forming a CLASSIC "W" (DOUBLE BOTTOM) REVERSAL PATTERN at critical multi-week support levels:
✅ First Bottom: Established several weeks ago, creating strong support foundation
✅ Retest of Support: Price has retested this level, confirming support strength and institutional buying
✅ "W" Formation: The dual-bottom structure indicates accumulation and exhaustion of selling pressure
✅ Volume Profile: Volume analysis shows healthy institutional participation at support levels
✅ Support Confirmation: Multi-week support zone acting as strong anchor and reversal point
The "W" pattern is one of the most reliable reversal patterns in technical analysis. When price tests support twice and holds, it indicates exhaustion of selling and high probability reversal.
━━━━━━━━━━━━━━━━━━━━━━━━━━━━━━━━━━━━━━━━━━━
📈 REVERSAL TARGETS & OBJECTIVES
Based on the "W" pattern formation, the upside targets would be:
Immediate Resistance (Midpoint of W): 1,365-1,380 (First reversal confirmation zone) - CRITICAL
1st Target: 1,400-1,410 (Previous consolidation break)
2nd Target: 1,440-1,450 (Key resistance zone)
3rd Target: 1,480-1,500 (Swing high resistance)
Extended Target: 1,520-1,540 (Major resistance level)
Each level provides strategic exit points for partial position management.
━━━━━━━━━━━━━━━━━━━━━━━━━━━━━━━━━━━━━━━━━━━
🛡️ RISK MANAGEMENT FRAMEWORK
Entry Strategy:
- Conservative Entry: Wait for confirmation above midpoint of W (above 1,365)
- Aggressive Entry: Small positions now at support, adding on breakouts
- Scale-In Approach: Build positions in stages rather than all-in
Stoploss Placement:
- Aggressive Stoploss: 1,330 (Just below support level)
- Conservative Stoploss: 1,320 (Below multi-week support with margin)
- Key Level: 1,330-1,344 (The support level) - if breaks, pattern fails
Risk/Reward Ratio:
- From current (1,343.90) to 1st target (1,400): 56 points upside
- Risk to support break: 24 points
- Ratio: 1:2.3 (Very Favorable)
Position Sizing: Risk only 1-2% of capital per trade
━━━━━━━━━━━━━━━━━━━━━━━━━━━━━━━━━━━━━━━━━━━
📍 KEY SUPPORT & RESISTANCE LEVELS
Major Support: 1,330-1,344.00 (Multi-week support - the W bottom)
Secondary Support: 1,320.00 (Weekly support zone)
First Resistance: 1,365-1,380 (Midpoint of W - CRITICAL for confirmation)
Medium Resistance: 1,400-1,410 (Previous consolidation level)
Major Resistance: 1,440-1,450 (Key swing resistance)
The 1,365-1,380 level is CRITICAL - once price breaks above with conviction, it confirms the W reversal and triggers buying.
━━━━━━━━━━━━━━━━━━━━━━━━━━━━━━━━━━━━━━━━━━━
🔍 WHY THIS W PATTERN IS SIGNIFICANT
1. Double Bottom Strength: Two tests without breaking below = institutional defense
2. Support/Resistance Flip: Once above midpoint, previous lows become strong support
3. Favorable Risk/Reward: Clear risk with large reward potential
4. Psychological Importance: Banking investors use these levels, creating strong buying
5. Trend Reversal Catalyst: W patterns historically precede significant uptrends
━━━━━━━━━━━━━━━━━━━━━━━━━━━━━━━━━━━━━━━━━━━
🎉 TECHNICAL OBSERVATIONS
• W pattern nearly complete with only upside breakout needed
• Support at 1,330 to 1,344 region has held through multiple tests
• Volume shows institutional buying interest at support
• No breakdown below support despite recent weakness
• RSI and momentum show oversold levels, suggesting reversal potential
• Daily chart shows positive divergence (lower price but higher indicators)
• Weekly structure intact with W formation
• Sector rotation into banks favors this reversal setup
━━━━━━━━━━━━━━━━━━━━━━━━━━━━━━━━━━━━━━━━━━━
💡 INVESTMENT THESIS (BULLISH)
ICICI Bank presents a HIGH-PROBABILITY REVERSAL setup at multi-week support with a classic W pattern. The combination of:
1. Technical Pattern Strength (Double bottom W)
2. Support Confirmation (Multiple tests, no break)
3. Favorable Risk/Reward (1:2.3+)
4. Sector Tailwinds (Banking strength)
5. Institutional Accumulation (Volume evidence)
6. Fundamental Stability (Banking fundamentals solid)
The next 50-100 points of upside appears well-supported. The KEY TRIGGER will be a close above 1,365, confirming the W reversal and attracting fresh buying.
━━━━━━━━━━━━━━━━━━━━━━━━━━━━━━━━━━━━━━━━━━━
⚠️ CRITICAL DISCLAIMER
🔴 THIS IS TECHNICAL ANALYSIS FOR EDUCATIONAL PURPOSES ONLY
🔴 THIS IS NOT FINANCIAL ADVICE OR AN INVESTMENT RECOMMENDATION
This analysis: Is based on historical price patterns, Does NOT constitute investment advice, Is my personal observation, Should NOT be sole basis for investment decision
━━━━━━━━━━━━━━━━━━━━━━━━━━━━━━━━━━━━━━━━━━━
⚠️ IMPORTANT RISKS
✓ Past performance does NOT guarantee future results
✓ Technical patterns can FAIL and trends can reverse
✓ Market conditions can change rapidly
✓ Stock investments carry significant risk of loss
✓ You may lose your ENTIRE investment amount
✓ Consult a qualified financial advisor before trading
✓ Do your own independent research (DYOR)
✓ Use strict position sizing and risk management
✓ RBI policy changes can impact banking stocks
✓ Interest rate fluctuations affect bank stocks
✓ Economic indicators and earnings can invalidate patterns
━━━━━━━━━━━━━━━━━━━━━━━━━━━━━━━━━━━━━━━━━━━
🔴 FINAL RISK ACKNOWLEDGMENT
TRADING AND INVESTING IN STOCKS INVOLVES SUBSTANTIAL RISK OF LOSS.
I am NOT a financial advisor. This analysis is for educational purposes only.
BEFORE MAKING ANY INVESTMENT DECISION:
✓ Conduct your own thorough research
✓ Check RBI policies and interest rate environment
✓ Verify your risk appetite and capital availability
✓ Consult with a qualified financial advisor
✓ Only invest capital you can afford to lose
✓ Never follow this as a guaranteed strategy
Your investment decisions are YOUR responsibility. Use proper risk management, stop losses, and position sizing.
━━━━━━━━━━━━━━━━━━━━━━━━━━━━━━━━━━━━━━━━━━━
Trade responsibly. Risk management is paramount.

RELIANCE Weekly Bullish Flag Breakout | Multiple Targets to 1758RELIANCE Weekly Bullish Flag Breakout | Multiple Targets to 1,758.40 | Weekly Analysis
━━━━━━━━━━━━━━━━━━━━━━━━━━━━━━━━━━━━━━━━━━━
📊 TECHNICAL SETUP
Current Price: 1,586.70 (+0.70% | +11.00)
Timeframe: Weekly (1W)
Symbol: RELIANCE (Reliance Industries Limited)
Exchange: NSE
Category: Stock / Energy Sector
━━━━━━━━━━━━━━━━━━━━━━━━━━━━━━━━━━━━━━━━━━━
🎯 PATTERN ANALYSIS
RELIANCE demonstrates a STRONG WEEKLY BULLISH FLAG BREAKOUT pattern:
✅ Flag Structure: Clear flagpole followed by tight consolidation
✅ Breakout Confirmation: Price decisively breaking above upper flag boundary on weekly close
✅ Support Levels: Multiple support zones identified with strong holding
✅ Volume Profile: Healthy accumulation visible in weekly volume patterns
✅ Momentum: Sustained bullish momentum with consistent weekly closures above key levels
The stock shows textbook uptrend characteristics with proper support/resistance relationships, confirming the bullish structural bias.
━━━━━━━━━━━━━━━━━━━━━━━━━━━━━━━━━━━━━━━━━━━
📈 PRICE TARGETS (Progressive Levels)
1st Target: 1,609.80 (+1.5% from current)
2nd Target: 1,639.60 (+3.3% from current)
3rd Target: 1,669.40 (+5.2% from current)
4th Target: 1,699.20 (+7.1% from current)
5th Target: 1,729.00 (+9.0% from current)
6th Target: 1,758.40 (+10.8% from current)
These progressive targets represent key resistance zones and profit-taking levels along the uptrend path. Each level provides strategic exit points for partial position management.
━━━━━━━━━━━━━━━━━━━━━━━━━━━━━━━━━━━━━━━━━━━
🛡️ RISK MANAGEMENT
Entry Zone: 1,580.00 (Breakout confirmation point - wait for weekly close above 1,585)
Stoploss: 1,520.00 (Weekly support - critical level)
Risk/Reward Ratio:
- Risk (1,580 to 1,520) = 60 points
- Reward (1,580 to 1,758) = 178 points
- R:R Ratio = 1:2.97 (Excellent)
Position Sizing: Risk only 1-2% of capital per trade
Stoploss is placed BELOW major weekly support level.
Consider scaling in on dips toward intermediate support.
━━━━━━━━━━━━━━━━━━━━━━━━━━━━━━━━━━━━━━━━━━━
📍 KEY SUPPORT & RESISTANCE
Immediate Support: 1,580.00 (Recent breakout level)
Secondary Support: 1,520.00 (Stoploss / Major support)
Resistance 1: 1,609.80 (1st Target)
Resistance 2: 1,699.20 (Mid-term resistance)
Major Resistance: 1,758.40 (6th Target / Final Target)
Intermediate Levels: Multiple targets provide stepping stones for profit realization at each resistance zone.
━━━━━━━━━━━━━━━━━━━━━━━━━━━━━━━━━━━━━━━━━━━
🔍 FUNDAMENTAL CATALYST
RELIANCE benefits from strong macro and sector tailwinds:
✅ Energy sector showing strength on geopolitical factors
✅ Oil price trajectory supporting energy stocks
✅ Refining margins remain healthy and supportive
✅ Strong cash flow generation and dividend support
✅ Large-cap stability with continued dividend yield support
This macro backdrop combined with strong technical structure reinforces bullish conviction for trend continuation.
━━━━━━━━━━━━━━━━━━━━━━━━━━━━━━━━━━━━━━━━━━━
🎉 TECHNICAL OBSERVATIONS
• Weekly uptrend remains intact with clear higher highs and higher lows
• Flag breakout on volume confirms institutional participation
• Stock consolidating at higher levels - sign of strength
• Volume profile shows healthy accumulation pattern
• Multiple targets suggest strong resistance zones ahead
• Proper risk/reward of 1:2.97 offers excellent entry/exit structure
• Support at 1,520 provides good risk management anchor
• Stock positions itself well for continued upside exploration
━━━━━━━━━━━━━━━━━━━━━━━━━━━━━━━━━━━━━━━━━━━
💡 TRADING STRATEGY NOTES
✓ Wait for weekly close above 1,585 before committing to positions
✓ Consider scaling entries - don't go all-in at once
✓ Trail stoploss after each target level is achieved
✓ Take partial profits at each resistance level
✓ Preserve capital: Use strict position sizing
✓ Monitor weekly closes carefully
✓ Watch for gaps and opening levels
✓ RELIANCE is a defensive large-cap with strong dividend yield
━━━━━━━━━━━━━━━━━━━━━━━━━━━━━━━━━━━━━━━━━━━
⚠️ CRITICAL DISCLAIMER
🔴 THIS IS TECHNICAL ANALYSIS FOR EDUCATIONAL PURPOSES ONLY
🔴 THIS IS NOT FINANCIAL ADVICE OR AN INVESTMENT RECOMMENDATION
This analysis:
- Is based on historical price patterns and technical indicators
- Does NOT constitute investment advice or a buy/sell recommendation
- Is my personal observation and technical analysis
- Should NOT be the sole basis for any investment decision
- Stock performance depends on multiple macroeconomic factors
━━━━━━━━━━━━━━━━━━━━━━━━━━━━━━━━━━━━━━━━━━━
⚠️ IMPORTANT RISKS TO UNDERSTAND
✓ Past performance does NOT guarantee future results
✓ Technical patterns can FAIL and trends can reverse
✓ Market conditions can change rapidly without warning
✓ This analysis is based on historical data only
✓ Stock investments carry significant risk of loss
✓ You may lose your ENTIRE investment amount
✓ This is a technical observation, NOT a guaranteed strategy
✓ Consult a qualified financial advisor before trading
✓ Do your own independent research (DYOR)
✓ Use strict position sizing and risk management
✓ Oil price volatility can significantly impact RELIANCE
✓ Geopolitical events affect energy sector performance
✓ Market liquidity and volatility can impact execution
✓ Economic indicators and earnings can invalidate patterns
━━━━━━━━━━━━━━━━━━━━━━━━━━━━━━━━━━━━━━━━━━━
🔴 FINAL RISK ACKNOWLEDGMENT
TRADING AND INVESTING IN STOCKS INVOLVES SUBSTANTIAL RISK OF LOSS.
I am NOT a financial advisor, fund manager, or investment professional. This analysis is provided for educational purposes only.
BEFORE MAKING ANY INVESTMENT DECISION:
✓ Conduct your own thorough research
✓ Understand macroeconomic factors affecting energy sector
✓ Check oil price trends and geopolitical developments
✓ Verify your risk appetite and capital availability
✓ Consult with a qualified financial advisor
✓ Only invest capital you can afford to lose
✓ Never follow this as a guaranteed strategy
✓ Understand leverage implications if using derivatives
Your investment decisions are YOUR responsibility. Use proper risk management, stop losses, and position sizing.
━━━━━━━━━━━━━━━━━━━━━━━━━━━━━━━━━━━━━━━━━━━
Trade responsibly. Risk management is paramount.

31 Dec 2025 — Last Trading Day of the Year (Wining +15 Points)🚀 Thank You Traders!
Wishing everyone a powerful & profitable journey in 2026 with the BTR Price Action Indicator.
2025 was just the beginning…
BTR Price Action launched in Dec 2025 — and even with just one month of live testing, we saw consistent clarity, clean entries, and multiple winning trades.
📌 Today’s Trade — BSE LTD
Timeframe: 15M
Signal: Long (Buy)
Entry: 2620
Exit: 2635
Profit: +15 Points in Intraday 💥
➡️ Market conditions didn’t matter.
➡️ No noise, No confusion.
➡️ Just follow BTR.
🔄 What Happened
BTR Price Action generated a fresh long signal
Entry Activated at 2620
Target Reached → Exit at 2635
Another Winning Trade to close the year 🎯
🔥 2026 Vision
2026 = Full Year of Trading with BTR
📈 More setups
📈 More confidence
📈 More rule-based entries
📈 More discipline
📈 More success stories
I’ll share a complete recap of all December 2025 trades soon.
Stay tuned!
💡 Want to Start with BTR?
📌 Go to my TradingView Profile → Scripts Section
📌 Add BTR Price Action Indicator
📌 Start trading with clarity, not chaos.
🚀 Happy New Year in Advance 🥳
Follow BTR. Follow Discipline.
Let’s Win 2026 Together. 💙📊

Where can Nifty reach in next 12 to 15 months?Nifty on the last day of the year closed in positive but what is the longer picture, Say in next 12 to 15 months?
Worst case scenario (Pessimistic view): In case dollar continues to hamper the progress and there is some catastrophic event like war or regime change or some other undue political situation or some gloabla panedemic striking again Nifty can see reduction and can again fall towards 23925 or even 21743 levels.
Negative secnario ( mild pessimistic view): In case Nifty companies underperform or there is no deal with US and Tariffs continue to hamper progress of Nifty. If India consumption story does not pick up and we are not able to tap new markets Nifty would still continue to linger between 23925 and 26325 levels.
Positive scenario: (optimistic view) In case Nifty is able to contineu the momentum and bull run does not cease and earning of Nifty companies expand we might see Nifty marching further towards 27730 or even 29627 levels in the next 12 to 15 months.
Very Positive view: (Very optimistic view) In case Bull Rally gets more power. The Trump Tariff deals is done. Government spendings incrase and Dollor is tamed by Ruppee. In short there is positive news and positivity all around Nifty can march towards 31872 or even 33574 levels.
The assumptions are drawn based on Nifty Fibonacci retracement and trend lines drawn based on candle stick analytics. This was a lackluster year or lack luster 15 months on the browsers but remember that markets reward the investors with patience. Things are turning positive for good and those who have waited for months market tends to reward them in weeks. So hold on to your horses and keep patience. There is a cup and handle kind of formation in progress it may reward the investors sooner than later.
Disclaimer: The above information is provided for educational purpose, analysis and paper trading only. Please don't treat this as a buy or sell recommendation for the stock or index. The Techno-Funda analysis is based on data that is more than 3 months old. Supports and Resistances are determined by historic past peaks and Valley in the chart. Many other indicators and patterns like EMA, RSI, MACD, Volumes, Fibonacci, parallel channel etc. use historic data which is 3 months or older cyclical points. There is no guarantee they will work in future as markets are highly volatile and swings in prices are also due to macro and micro factors based on actions taken by the company as well as region and global events. Equity investment is subject to risks. I or my clients or family members might have positions in the stocks that we mention in our educational posts. We will not be responsible for any Profit or loss that may occur due to any financial decision taken based on any data provided in this message. Do consult your investment advisor before taking any financial decisions. Stop losses should be an important part of any investment in equity.

nifty 31.12.2025nifty may turn bullish only after a strong candle close above 26000 level. wait for a pullback after breakout, with a potential upside target around 26250 level.

Nifty Analysis EOD – December 30, 2025 – Tuesday🟢 Nifty Analysis EOD – December 30, 2025 – Tuesday 🔴
Yearly Expiry: Volatile Indecision at 26K.
🗞 Nifty Summary
The Nifty started the session flat but immediately took a sharp 78-point dive south to mark the day low at 25,878. A sudden and aggressive recovery saw the index rise 98 points from the lows to test the CPR range, but it failed to sustain.
The subsequent sell-off dragged the price back to the day’s low, where Nifty formed a textbook Double Bottom (DB) pattern. The breakout of this pattern successfully carried the index back to the IBH.
In a volatile conclusion to the Monthly and Yearly expiry, the last 5-minute candle aggressively breached the IBH and the previous Day High, allowing Nifty to close at 25,970.55, almost at the high of the day and nearly unchanged from the PDC.
The resulting Daily Candle is a Doji, suggesting that the market is currently in a base-building phase near significant support levels.
🛡 5 Min Intraday Chart with Levels
🛡 Intraday Walk
Today was defined by the “two-way business” typical of a major expiry.
The initial plunge was met with fierce buying, creating a high-volatility environment. The formation of the Double Bottom at 25,878 was the technical highlight, providing a solid floor for the bulls.
The most interesting action occurred in the final minutes, where a massive spike cleared the IBH, signaling that institutional players may be positioning for a recovery in the new year.
If today’s low holds, it could very well be the foundation for the next short-term bullish trend.
📉 Daily Time Frame Chart with Intraday Levels
🕯 Daily Candle Breakdown
Open: 25,940.90
High: 25,976.75
Low: 25,878.00
Close: 25,938.85
Change: −3.25 (−0.01%)
🏗️ Structure Breakdown
Type: Indecision candle (Doji).
Range (High–Low): ≈ 99 points — moderate intraday movement with high churn.
Body: ≈ 2 points — essentially no directional commitment between open and close.
Upper Wick: ≈ 36 points — rejection near the 25,977 resistance.
Lower Wick: ≈ 61 points — strong defense by buyers at the 25,878 level.
📚 Interpretation
The Doji formation following a period of bearish pressure is a classic signal of exhaustion among sellers. The long lower wick is particularly significant, as it shows that every attempt to push the market below 25,900 was met with aggressive buying.
This balance suggests that the market has found a temporary equilibrium, and the next directional move will depend on whether the index can reclaim the 26,000 psychological mark.
🕯 Candle Type
Doji / Long-Lower-Wick Indecision Candle — Signals a potential pause in the bearish trend; follow-through in the next session is critical for direction.
🛡 5 Min Intraday Chart
⚔️ Gladiator Strategy Update
ATR: 167.20
IB Range: 78.15 → Medium
Market Structure: Balanced
Trade Highlights:
10:21 Long Trade : SL Hit
13:28 Long Trade : Target Hit (1:2.18) (TrendLine + DB Pattern)
Trade Summary: An active day for the strategy. While the initial long attempt was caught in the morning’s volatile chop, the second trade was perfectly timed. By identifying the Double Bottom pattern and the trendline breakout at 13:28, the system captured a clean move back to the IBH, ending the session profitably.
🧱 Support & Resistance Levels
Resistance Zones:
26030
26070
26104 (Major Ceiling)
Support Zones:
25890
25860 ~ 25840 (Immediate Support)
25800
🧠 Final Thoughts
“The 26,000 barrier is the final test for the bulls.”
The yearly expiry has left us with a clear “Line in the Sand” at 25,878.
If Nifty can open above 26,000 and sustain that level tomorrow, we should expect a continuation of today’s late-session bullish sentiment.
However, the 25,890 ~ 25,875 zone must hold the fort; any breach here would invite a deeper test of the 25,800 territory.
✏️ Disclaimer
This is just my personal viewpoint. Always consult your financial advisor before taking any action.

NIFTY Holding Key Support — Reversal in FocusNIFTY 50 – Daily Timeframe Support & Outlook
On the daily timeframe, NIFTY 50 is currently placed near an important short-term support zone.
Short-Term Support Zone: 25,740 – 25,770
If this support zone breaks decisively, NIFTY may extend its decline toward the major support area at 25,200 – 25,300
Reversal & Upside Scenario
If NIFTY sustains above the short-term support range of 25,550 – 25,700, a technical reversal is possible.
In such a case, the index may witness an upside move toward 26,300 followed by 26,600.
Thank You...

Daily Analysis: Nifty/ XAUUSD/ XAGUSD : 30-12-25Quick look at the levels and the projections of Nifty50, Gold and Silver prices.
All the major shifts or support/resistance is shared in the chart itself.

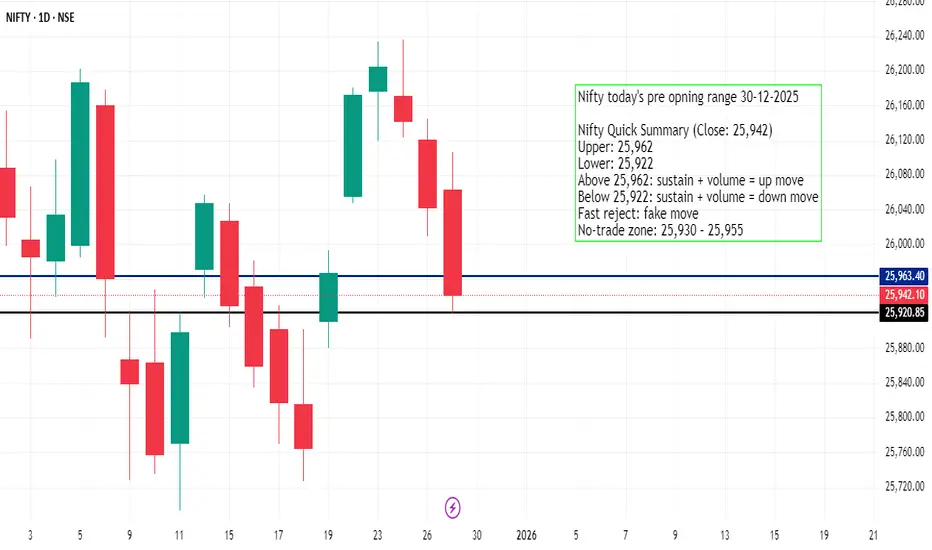
today's nifty analysis 30-12-2012Nifty Quick Summary (Close: 25,942)
Upper: 25,962
Lower: 25,922
Above 25,962: sustain + volume = up move
Below 25,922: sustain + volume = down move
Fast reject: fake move
No-trade zone: 25,930 – 25,955
BTR Update | 29 Dec 2025 |No Trade Day in BSE LTD|No Trade Day in BSE LTD
Because BTR Indicator did NOT generate any new signal today.
We respect the system → No Signal = No Trade ✔
🕮 Market Context
📌 The Bearish Signal from 24 Dec 2025 is still active
➡️ No exit signal yet for investors / swing traders
➡️ Intraday traders stay flat until a fresh signal appears
This is why trading with BTR becomes easy:
We don’t predict, we follow.
We wait for the system.
📍Key Takeaways
Don’t force trades
Protect capital on silent days
Follow signals, not emotions
System consistency beats guessing
👇 Want to Trade with BTR?
📌 Find the BTR Indicator in my TradingView Profile → Scripts Section
📌 Add to chart & start learning the entries/exits
📌 No noise. No confusion. Just clarity.
Follow BTR. Follow Process.
Market rewards patience. 🚀

NIFTY: Key Levels to Watch for the Next Move.This is the daily timeframe chart of NIFTY.
NIFTY is trading within a well-defined structure, with higher-low (HL) support levels placed at 25,800 and 25,550.
On the lower timeframe, the index is showing a trendline breakout near 25,950, indicating short-term strength.
Based on Fibonacci retracement, the key reversal and decision zone lies between 25,900–25,950. If this support zone breaks, the next important support is positioned near 25,800.
If these support levels hold, NIFTY may continue its upward move. According to Fibonacci extension, the potential upside targets are 26,380–26,450, while 26,600 remains a major resistance, aligned with channel resistance and extension levels.
Thank You ....
