NIFTY Technical Analysis - Important levels📌 NIFTY 50 – Range Recovery Facing Overhead Supply With Mixed CPR Signals
NIFTY has staged a measured recovery after the recent decline, signalling demand absorption at lower levels but not yet confirming a decisive trend reversal. Price action shows buyers stepping in around the 25,500–25,550 demand zone, triggering a rebound toward the 25,650–25,700 region, where the index is currently encountering supply pressure. Immediate resistance is placed near 25,767.80, aligning with a prior rejection area and an emerging supply pocket, followed by 25,841.9 and 25,979.85. A stronger structural hurdle is positioned around the 25,800–25,850 band, marking a key swing resistance that must be cleared for sustained upside continuation.
On the downside, immediate support is seen near 25,555, followed by stronger supports at 25,420 and 25,340, creating a layered demand cushion in the event of profit booking.
This price behaviour presents an interesting contrast with the CPR setup. While the CPR remains narrow and positioned in a bullish zone, indicating potential for expansion, it is also drifting slightly lower — reflecting caution and the possibility of range-bound behaviour before a directional move emerges. The dashboard hints at low momentum and a wait-and-watch environment, suggesting the market is currently transitioning rather than trending.
Overall, NIFTY appears to be in a range recovery phase within a broader corrective structure. Sustaining above the 25,650–25,700 region can keep the short-term tone stable, but a decisive breakout above 25,850+ is essential to shift confidence toward bullish continuation. Until then, the index may oscillate between demand and supply zones, favouring patience over aggressive positioning.
📊 Market sentiment remains mixed. Domestic equities recently closed with gains, supported by stable policy cues and improving macro comfort, providing a constructive backdrop for bulls. However, intermittent profit booking near higher levels and selective sector weakness continue to cap momentum, adding a neutral-to-cautious undertone to rallies.
🔎 Probabilistic Tilt Based on Levels & Environment:
Bullish Scenario: A sustained move above 25,840–25,900 could accelerate recovery toward the 25,950–26,000 region as confidence improves.
Neutral / Choppy Scenario: Holding between 25,450–25,840 would indicate continued consolidation as the market digests mixed cues.
Bearish Scenario: Rejection near resistance combined with a break below 25,555 may pull the index back toward 25,420–25,340, especially if broader risk sentiment weakens.
⚠️ Disclaimer:
This content is shared purely for educational and informational purposes to enhance market understanding. It should not be construed as investment, trading, or financial advice. Market conditions can change rapidly, and past price behaviour does not guarantee future outcomes. Please consult a SEBI-registered financial advisor before making any investment or trading decisions, and ensure appropriate risk management at all times.
Niftytrendanalysis

Weekly Market Outlook,Nifty, BankNifty,S&P 500Nifty closed the week at 25,694, almost flat vs last week, after making a high of 25,899 and a low of 25,473.
As discussed earlier, once again Nifty respected the broader range of 26,150–25,250, keeping the market in a balance phase.
This week’s candle reflects indecision — such structures often act as compression, and once price accepts beyond the range, moves can turn fast.
🔼 Nifty Upside
If Nifty manages to sustain above 25,811 on a 1-hour close, upside levels to watch:
25,900
26,000
26,150
Acceptance above this zone will be key.
🔽 Nifty Downside
If Nifty sustains below 25,600, downside levels open towards:
25,500
25,400
25,200
📌 Structure Summary
25,600–25,811 → balance zone
Above 25,811 → bullish acceptance
Below 25,600 → downside expansion
For now, broader range remains
👉 26,150 – 25,200, unless any major global trigger changes sentiment.
🏦 BankNifty View
BankNifty closed near an important fib zone around 60,092.
If it gives a consecutive close above 60,150, upside levels:
60,360
60,437 (ATH)
60,500
60,700
60,950
Broader range remains
👉 61,200 – 59,000.
🌎 S&P 500
Weekly candle remains indecisive.
Above 6,986 → 7,026 / 7,122
Below 6,885 → 6,780 / 6,700 / 6,469
⚠️ Final Note
Market remains volatile and range-bound.
In such phases, patience matters more than prediction.
Respect levels — let price decide direction.

NIFTY Bouncing back from demand zone.....A good bounce seen in market from demand zone. If price will sustain with good demand sharp move towards upside can be seen. Keep an eye....

Nifty Spot...Nifty Spot
Not sustaining above 26340 levels - seems to be a strong hurdle to cross
NS crossed down decisively below 25810
Now 25810 will act as a resistance
with result season and a possible budget rally
it will be interesting to see the trajectory of the Nifty
some levels marked marking trading levels
Like & Share...

Nifty Under Pressure-FII Exodus,Trump Insanity & Rupee Weakness1. Since May 2025, USDINR gained ~8.7%, while Nifty gained 8.0% (as the Indian rupee is devaluing, market won't get out of this correction)
2. FII outflows hit record in 2025; DII's inflows hold base but mutual fund AUM growth slowed to 18% (Refer to the Out data in the given image.)
3. Trump Factor
4. Short Buildup at 26000
5. Threat of Inflation
What can reverse this...?
1. FTA news
2. Tax relief by the government in the budget.
3. Monetary Easing by Fed & RBI (It will reverse the USD price to some extent)
4. Earning Surge post Q1 of 2026.
Sectors where you should find the opportunity to invest...
1. Metals
2. Banking

nifty outlook for 06.01.2026nifty currently showing bullish momentum, but the ongoing geopolitical uncertainty could trigger downside preassure. there is notable liquidity on the lowerside.
bearish scenario: if nifty open with bearish candle below 26200,a short move may develop towards 25900.
bulish scenario: if nifty opens flat and forms a bulish candle closing above 26300,an upside move towards 26470 is likely

NIFTY : A 5%-6% correction from Higher LevelsNSE:NIFTY
its s Weekly Chart.
26,515 | 26,786
These are the two levels to watch out when the market is showing upside momentum.
These are extensions of the previous upswing.
These are the most prominent levels for Wolfe Wave that is forming currently.
The open of the Calendar Year 2026 being 26,173. This must be respected by the Bulls (+/- 0.5%)
for continuation of the up-move till above mentioned two levels.
Any weakness around any of these two levels (26,515 | 26,786) will trigger Wolfe Wave and the down-side targets are 5% and 6% deep (As mentioned on the chart).
Use price action and SMC while trading around these levels. Macro-economics and Geo-economics (Geo-politics) are quite vulnerable and may surprise both Bulls and Bears.
FII Liquidity is moving towards lower PE regimes and metals are their center point for now. Expect more sectorial churn on a Weekly/Monthly basis.

What's Moving NIFTY 50 in 2025? Key Factors to WatchMajor GST reform with simplified two-tier structure
100 bps repo rate cuts boosting liquidity
India's GDP projected at 6.8% growth
Tax relief measures expected to revive consumption
💼 Corporate & Consumption Trends:
Earnings under pressure but recovery signals emerging
Festive demand and tax cuts to drive pent-up consumption
Capacity utilization expected to improve by late 2027
Key beneficiary sectors: Autos, FMCG, Cement, Insurance, Healthcare
💰 Investment Flows:
FPI selling creating short-term volatility
Rising domestic equity investments from retirement funds
Potential boost from India-US trade deal
⚠️ Headwinds to Monitor:
Rupee weakness and inflation concerns
U.S. tariff threats and geopolitical risks
Elevated valuations adding caution
Global sentiment challenges (AI bubble fears)
🚀 Long-term Opportunities:
Declining poverty and job creation
Tech and digital lending innovations
Agricultural sector transformation
Bottom Line: Mixed near-term outlook with strong structural growth drivers. Policy reforms and domestic demand recovery could offset global headwinds.
Disclaimer:
I am NOT a SEBI registered advisor nor a financial advisor.
Any investments or trades I discuss on my blog are intended solely for educational purposes and do not represent specific financial, trading, or investment advice.

nifty 26.12.2025the market is currently showing overall weakness and may consolidate within the 26150-26000 range. a clear directional move is likely only if a strong bearish candle breaks below 26000. the next key support lies near 25850,from where a minor pullback may occur.

Trend line resistance stopped the forward March of Nifty today.Nifty hit a solid trendline resistance today and took a halt closing flat (4.75 Points in Positive). The zone between 26202 and 26307 has 4 resistances in total as you can see them in the chart. Also note at the RSI which was in the overheated zone indicating overbought position of the market indicating the need of consolidation before next forward march.
The supports for Nifty now are near 26131, 26060 followed by Mother and Father line support at 26020 and 25939. A closing below 25939 can be indicative of weakness in the market and can plummet the Nifty towards 25841 or even 25807 levels.
Overall the sentiment will remain positive but there can be stock specific huge moves. Large cap stocks available at bargain prices should remain the prerogative of the buyers. Next closing above 26307 whenever it happens will be a superlative breakout for Nifty. Shadow of the candle is neutral currently.
Disclaimer: The above information is provided for educational purpose, analysis and paper trading only. Please don't treat this as a buy or sell recommendation for the stock or index. The Techno-Funda analysis is based on data that is more than 3 months old. Supports and Resistances are determined by historic past peaks and Valley in the chart. Many other indicators and patterns like EMA, RSI, MACD, Volumes, Fibonacci, parallel channel etc. use historic data which is 3 months or older cyclical points. There is no guarantee they will work in future as markets are highly volatile and swings in prices are also due to macro and micro factors based on actions taken by the company as well as region and global events. Equity investment is subject to risks. I or my clients or family members might have positions in the stocks that we mention in our educational posts. We will not be responsible for any Profit or loss that may occur due to any financial decision taken based on any data provided in this message. Do consult your investment advisor before taking any financial decisions. Stop losses should be an important part of any investment in equity.

NIFTY | BANKNIFTY | S&P 500 – Weekly Outlook & Key LevelsNifty closed the week at 25,966, down 80 points from the previous week. The index made a high of 26,047 and a low of 25,726. As discussed earlier, Nifty once again failed to sustain above 26,150 and continues to trade within the broader 26,500–25,700 range.
The 25,700 zone remains a strong support, tested three times in the last two weeks, clearly indicating demand at lower levels. On the daily timeframe, Nifty is showing signs of a bullish “W” pattern, which keeps the bullish bias intact as long as support holds.
Upside Levels (Bullish Confirmation):
Consecutive daily close above 26,150
Targets: 26,325 → 26,492 (important Fibonacci level) → 26,575
Downside Risk (Support Breakdown):
Below 25,700, downside can accelerate towards 25,500 / 25,400
India VIX is currently at its support zone, which increases the probability of a volatility bounce. Expect higher swings and faster moves in the coming sessions.
Key Nifty Levels:
Resistance: 26,150
Support: 25,700
A breakout or breakdown can keep Nifty volatile within the 26,500–25,400 range.
BANKNIFTY WEEKLY ANALYSIS
Bank Nifty closed above the psychological 59,000 level, around 300 points lower on a weekly basis. The index has formed an indecisive doji candle, signaling uncertainty.
Below 58,712 (this week’s low): Downside towards 58,000 / 57,800
Above 59,713 (previous week’s high): Upside resistance at 60,092 / 60,300
S&P 500 – WEEKLY VIEW
S&P 500 closed at 6,834, just 7 points higher than last week, forming an indecisive doji candle. With the Christmas week ahead, major directional moves look unlikely.
The monthly close will be crucial. The current monthly candle is much smaller compared to average candles since Nov’24, indicating compression.
Monthly high breakout: Fresh bullish momentum
Monthly low breakdown: Fast correction likely due to aggressive profit booking
📌 Trade Management: Trail profits strictly and avoid over-leveraging.

Nifty Analysis EOD – December 19, 2025 – Friday🟢 Nifty Analysis EOD – December 19, 2025 – Friday 🔴
Trendline Breakout: Bulls Recapture 25920 Zone with Decisive Strength!
🗞 Nifty Summary
The Nifty concluded the week on a powerful note, opening with a 97-point Gap Up above the Previous Day’s High (PDH). Demonstrating strong bullish sentiment, the index utilized the PDH and the 25890 level as a base, marking the day low at 25,880.45.
Most significantly, bulls decisively breached the major resistance zone of 25920 ~ 25930, which subsequently flipped polarity to act as firm support throughout the session.
While the upper range of 25960 ~ 25980 acted as a supply zone, leading to a tight 25-point consolidation after 1:30 PM, the index managed a strong close at 25,966.40, gaining +150.85 points (+0.58%).
This move confirms a Strong Trendline Breakout on the Daily Time Frame, shifting the medium-term bias back to bullish.
🛡 5 Min Intraday Chart with Levels
🛡 Intraday Walk
From an intraday perspective, bulls successfully covered 145 points of ground from the day’s low. The session was characterized by healthy price acceptance above the critical 25920 zone.
The afternoon stagnation near the day’s high was a necessary cooling-off period after the aggressive morning rally.
The support range has now shifted upward to 25840 ~ 25860. Unless negative global news surfaces over the weekend, the Monday session is expected to be a bullish extended session as short-sellers continue to cover their positions.
📉 Daily Time Frame Chart with Intraday Levels
🕯 Daily Candle Breakdown
Open: 25,911.50
High: 25,993.35
Low: 25,880.45
Close: 25,966.40
Change: +150.85 (+0.58%)
🏗️ Structure Breakdown
Type: Bullish candle with healthy body.
Range (High–Low): ≈ 113 points — controlled and confident intraday movement.
Body: ≈ 55 points — reflecting steady bullish strength and accumulation.
Upper Wick: ≈ 27 points — mild resistance/supply observed near the 25980 highs.
Lower Wick: ≈ 31 points — buyers decisively defended the 25890 support early in the session.
📚 Interpretation
The candle confirms a successful recapture of the 25900 territory. The absence of long wicks suggests that the market is accepting higher prices without significant panic or rejection. The close above the 25930 polarity zone is a major technical win for the bulls, validating the breakout seen on the Daily Time Frame.
🕯 Candle Type
Bullish Recovery / Continuation Candle — Indicates significantly improving sentiment and a high probability of follow-up buying.
🛡 5 Min Intraday Chart
⚔️ Gladiator Strategy Update
ATR: 190.28
IB Range: 89.95 → Medium
Market Structure: ImBalanced
Trade Highlights:
11:46 Long Trade - Trailing SL Hit
Trade Summary: The strategy rules correctly restricted an IBH breakout trade today. Given the Imbalance market structure combined with a Gap Up and an IB covering half the morning range, the decision to avoid the breakout proved correct as the afternoon turned into a narrow, range-bound struggle with multiple fakeouts.
🧱 Support & Resistance Levels
Resistance Zones:
25985 (Immediate Hurdle)
26030
26070
26104 (Major Target)
Support Zones:
25930 ~ 25920 (Strong Polarity Support)
25890
25860 ~ 25840
🧠 Final Thoughts
“The Trendline Breakout has changed the game.”
Bulls have successfully shifted the battlefield back above 25930. The focus now moves to the 26104 resistance level.
Monday’s session will be decisive; if Nifty sustains above today’s close, we are likely looking at a move toward 26100+ very quickly. Support is now well-anchored in the 25840 ~ 25860 range.
✏️ Disclaimer
This is just my personal viewpoint. Always consult your financial advisor before taking any action.


“Tomorrow, 03-12-2025 Nifty prediction. “Tomorrow, 03-12-2025 Nifty is likely to trade approximately 40 points in positive territory, indicating a mildly bullish sentiment in the early session.”
Explanation for Traders:
Market may show slight upward momentum
Buyers might attempt to take control early
A strong bullish move will need follow-through with volume
BANKNIFTY 500 down sentiment in the early session.”

Nifty 50: Trendline Support vs All-Time Highs...Over the past two months, the Nifty 50 has been maintaining a clear bullish structure, moving in a classic UP → PULLBACK → UP sequence. On the hourly timeframe, the index has been respecting a well-defined ascending trendline, which has consistently acted as dynamic support.
Recently, Nifty took support at the confluence of the trendline and the 0.5 Fibonacci retracement level, triggering a strong upside continuation. Now, the same confluence setup is forming again, indicating that the market may be preparing for another potential bounce.
The key level to monitor is 25,750, where both the trendline and the 50% Fib level intersect. If the index holds and rebounds from this zone, the ongoing uptrend is highly likely to extend further.
However, traders should remain cautious—Nifty is approaching its all-time high region, where profit-booking and volatility typically increase. A successful bounce could lead to a short-term move toward the next resistance zone at 26,250.
In summary:
📌 Trend remains bullish unless the trendline breaks.
📌 25,750 is the critical support to watch.
📌 Upside target on continuation: 26,250.

Nifty Analysis EOD – November 25, 2025 – Tuesday🟢 Nifty Analysis EOD – November 25, 2025 – Tuesday 🔴
Expiry Day Bears Break Critical Support Zone
🗞 Nifty Summary
The Nifty opened with a 55-point Gap Up near the 26K level, but sellers immediately stepped in, causing an 81-point fall that filled the gap and marked the initial day low at 25,924.15.
The index successfully took support in the crucial 25940 ~ 25950 zone and rallied, briefly breaching the 26K and IBH levels. However, this breakout was rejected by the trendline resistance, confirming a fakeout. Nifty then hovered in a wide, choppy range within the Initial Balance (IB). Multiple attempts to reclaim 26K failed.
Around 2:15 PM, bulls gave up, leading to a sharp sell-off. The critical 25950 ~ 25940 support was instantly breached, along with the day low and IBL.
The market reached the next defined support zone at 25860 ~ 25840, precisely as aimed in yesterday’s note.
The day closed at 25,884.80, the lowest level of the session, wiping out the previous week’s gains. The bullish structure is now seriously threatened.
🛡 5 Min Intraday Chart with Levels
🛡 Intraday Walk
As expected, yesterday’s note and on the expiry day, the session was exciting and volatile, offering excellent two-sided opportunities for intraday traders.
The key event was the failure to sustain the breakout above 26K in the late morning, which exhausted the buyers. The late-session sell-off was decisive, signaling strong bearish conviction. The breach of the previous session’s critical support (25940) indicates a shift in momentum.
Now that the Previous Week’s Low (PWL) has been tested, a sustained break of today’s low will open the path immediately to the deep support at 25740 ~ 25715.
📉 Daily Time Frame Chart with Intraday Levels
🕯 Daily Candle Breakdown
Open: 25,998.50
High: 26,032.60
Low: 25,857.50
Close: 25,884.80
Change: −74.70 (−0.29%)
🏗️ Structure Breakdown
Type: Strong Bearish candle.
Range (High–Low): ≈ 175 points — moderate volatility.
Body: ≈ 114 points — reflecting steady selling pressure.
Upper Wick: ≈ 34 points — buyers attempted an early push, but sellers rejected higher levels.
Lower Wick: ≈ 27 points — slight buying interest near the lows but not enough to support the price.
📚 Interpretation
The close is a strong bearish signal, sitting near the day’s low and confirming the successful breakdown of the 25940 critical zone.
The inability of bulls to hold the gap-up and subsequent failure to hold 26K indicates clear distribution at upper levels. This structure suggests vulnerability for the immediate future.
🕯 Candle Type
Bearish Candle with Mild Lower-Wick Support — Sellers controlled the session decisively.
🛡 5 Min Intraday Chart
⚔️ Gladiator Strategy Update
ATR: 192.98
IB Range: 81.30 → Medium
Market Structure: Balanced
Trade Highlights:
09:53 Long Trade - Target Hit (R:R 1:1.2)
10:44 Short Trade - Target Hit (R:R 1:2.2)
13:25 Long Trade - SL Hit
14:24 Short Trade - Target Hit (R:R 1:3)
Trade Summary: The volatile, two-sided nature of the expiry day played perfectly into the strategy, capturing profitable trades on both the initial bounce and the final, decisive breakdown, proving effective in the balanced market structure.
🧱 Support & Resistance Levels
Resistance Zones:
25950 ~ 25940 (Immediate Resistance - Now broken support)
26000
26040 ~ 26075
26104
Support Zones:
25860 ~ 25840 (Current Base)
25740 ~ 25715 (Next Major Target)
🧠 Final Thoughts
“The bull structure is now dependent on 25840 holding.”
The decisive close in the 25860 ~ 25840 zone marks a significant bearish achievement. The bias for Wednesday is now firmly to the downside. We need to see if bulls can successfully defend this new base.
A clear move and close below 25840 will open the floodgates toward 25740 ~ 25715. For the bulls to regain control, they must reclaim and hold 25950 immediately.
✏️ Disclaimer
This is just my personal viewpoint. Always consult your
financial advisor before taking any action.

NiftyBreakout retest looking strong — If price holding above 26,020-26100 zone.
If momentum sustains, next targets on radar: 26,836 → 26,926 🚀
Trendline resistance flipped to support. Bulls still in control.

Nifty Analysis EOD – November 11, 2025 – Tuesday 🟢 Nifty Analysis EOD – November 11, 2025 – Tuesday 🔴
Bulls Launch a Massive 250-Point Recovery, Trapping Bears on Expiry Day!
🗞 Nifty Summary
The session delivered an amazing recovery by the bulls, creating classic bear traps on this expiry day. The market’s ability to recover 250 points non-stop from the lows and close strongly at 25705.55, near the day’s high, confirms the return of powerful bullish conviction.
Crucially, we achieved the close above 25650 that was anticipated in yesterday’s commentary. The long lower wick structure confirms demand is aggressive at dips. We now anticipate a further extension of the continuation move in the next session.
🛡 Intraday Walk
Nifty opened with a 45-point Gap Up, landing exactly at the immediate resistance zone of 25615 ~ 25635. Following the first tick, the index slipped sharply by around 150 points, breaching the PDL before the Initial Balance (IB) could even form. This initial sell-off flipped sentiment bearish for a short period.
The aggressive slide was halted precisely at our important support zone of 25440 ~ 25460, where strong demand emerged. From this support, the index executed a non-stop, powerful recovery of 250 points, systematically breaching the PDC, CDH, the 25615 ~ 25635 resistance, and the PDH.
This sustained upward move carried the index to the next key resistance level of 25715. The day ultimately closed at 25705.55, just shy of the day’s high, confirming a highly bullish structural close.
🛡 5 Min Intraday Chart with Levels
📉 Daily Time Frame Chart with Intraday Levels
🕯 Daily Candle Breakdown
Open: 25,617.00
High: 25,715.80
Low: 25,449.25
Close: 25,694.95
Change: +120.60 (+0.47%)
🏗️ Structure Breakdown
Type: Bullish candle with a long lower wick.
Range (High–Low): ≈ 266.55 points — a wide and active trading range, indicative of high intraday volatility.
Body: ≈ 77.95 points — moderate body size.
Lower Wick: ≈ 167.75 points — a strong sign of aggressive buying and demand resurgence from lower levels.
Upper Wick: ≈ 20.85 points — limited resistance near the high, enabling a strong close.
📚 Interpretation
Price opened near mid-range, dipped sharply toward 25,449, but buyers stepped in aggressively, rejecting the lower prices and lifting the index almost to the day’s high. The long lower shadow confirms high demand and the rejection of the deep intraday sell-off. Closing near the upper end solidifies bullish momentum and significantly improved sentiment.
🕯 Candle Type
This session formed a Bullish Pin Bar (Hammer-like candle) in an up-move. This candlestick suggests renewed buying strength and strong follow-through after the previous session’s bullish commitment.
🛡 5 Min Intraday Chart
⚔️ Gladiator Strategy Update
ATR: 206.65
IB Range: 150.95 → Medium
Market Structure: ImBalanced
Trade Highlights:
10:09 Long Trade – SL Hit
10:15 Short Trade - Target Achieved (R:R 1:1.64)
12:21 Long Trade - Target Achieved (R:R 1:3.36)
Trade Summary: The early volatility led to an immediate Stop Loss, but the strategy quickly recovered with a profitable short trade and then successfully capitalized on the strong, sustained bullish reversal later in the day.
🧱 Support & Resistance Levels
Resistance Zones:
25790
25865 ~ 25880
25920
Support Zones:
25635 ~ 25615
25585
25550
🧠 Final Thoughts
“On expiry, the longest wicks are often the graves of aggressive shorts and the foundations for the next rally.”
Today’s action teaches a crucial lesson: do not trade the emotion of the gap. The sharp initial dip was a perfect bear trap on expiry. The non-stop 250-point recovery emphasizes the importance of waiting for price to stabilize near structural support (like 25440) before committing. For motivation, the recovery from an early SL shows that discipline and sticking to the trend reversal signals pay off with high-R:R opportunities.
✏️ Disclaimer
This is just my personal viewpoint. Always consult your financial advisor before taking any action.

Nifty Analysis EOD – October 28, 2025 – Tuesday🟢 Nifty Analysis EOD – October 28, 2025 – Tuesday 🔴
Volatility takes the driver’s seat — indecision candle hints at short-term pause
🗞 Nifty Summary
Nifty opened 44 points gap down at 25,930 and immediately formed OL (Open = Low), sparking an upward run that filled the gap and even crossed the previous day’s high, breaching the critical resistance zone of 26,010 ~ 26,020.
However, the breakout turned false, as Nifty failed to hold above and slipped sharply below the open, creating a fake PDH breakout scenario. Post-IB breakdown, the index found footing around S1 and the 25,865 support zone, but the bounce stalled near 25,900, which flipped into resistance and pushed Nifty down toward the PDL.
At the PDL, a double-bottom pattern emerged, triggering a strong rally toward 25,944–25,955. Yet, this zone, previously a support area, turned into resistance (polarity flip), and multiple failed breakout attempts forced bulls to retreat once more.
The last hour turned chaotic — a volatile battle around PDL with several fakeouts kept traders guessing. Around 2:50 PM, sudden expiry adjustments or short covering lifted Nifty sharply back above the day’s consolidation zone, closing near the PDC.
It was a wild roller-coaster session full of opportunities, but the volatility tested traders’ discipline. The long shadows on the 5-min candles perfectly captured the tug-of-war between buyers and sellers.
Despite the action, the day ended marginally negative, forming an indecisive structure where both sides remain active. The next session will be decisive — a breakout and sustainability on either side will dictate direction; otherwise, expect range-bound consolidation.
Today’s candle engulfed the previous day’s range, often a prelude to fake breakouts, so caution is key for breakout traders.
🛡 5 Min Intraday Chart with Levels
🛡 Intraday Walk
Gap-down open (44 pts) at 25,930 → forms OL and surges upward.
Fills the gap and crosses PDH → false breakout above 26,020.
Sharp reversal → IB and open-level breakdown.
Finds support near 25,865 (S1) → bounces to 25,900, flips to resistance.
Tests PDL, forms double bottom → rally to 25,944–25,955.
Multiple fake breakouts → bulls fade.
Wild expiry adjustment lifts price near PDC into the close.
📉 Daily Time Frame Chart with Intraday Levels
🕯 Daily Candle Breakdown
Open: 25,939.95
High: 26,041.70
Low: 25,810.05
Close: 25,936.20
Change: −29.85 (−0.11%)
🏗️ Structure Breakdown
Type: Small red candle with long wicks on both sides.
Range (High–Low): 231.65 pts → wide volatility.
Body: 3.75 pts → nearly neutral body.
Upper Wick: ~105.50 pts
Lower Wick: ~126.15 pts
📚 Interpretation
Market opened below Monday’s close → tested 26,041 (fresh high) but failed to hold.
Sharp selloff followed by a rebound → indecision throughout the day.
Closing near open = tug-of-war between bulls & bears → neutral sentiment.
🕯Candle Type
Spinning Top / Neutral Doji-like
Appears after a strong bullish run → hints at short-term exhaustion or consolidation phase.
🛡 5 Min Intraday Chart
⚔️ Gladiator Strategy Update
ATR: 206.77
IB Range: 112.05 → Medium
Market Structure: Balanced
Trade Highlights:
09:45 – Short Trade → Target Achieved (R:R 1:2.17)
10:05 – Short Trade → Target Achieved (R:R 1:1.49)
12:15 – Long Trade → Target Achieved (R:R 1:2.67)
📌 What’s Next? / Bias Direction
Bias: Neutral → Awaiting breakout
Expect volatility to persist within 25,800–26,050.
Break and sustain above 26,050 = bullish continuation;
Drop below 25,800 = short-term pullback likely.
📌 Support & Resistance Levels
Resistance Zones:
25996
26010 ~ 26020
26085 ~ 26100
Support Zones:
25865
25828
25790
25725 ~ 25715
💡 Final Thoughts
“Indecision is not weakness — it’s the market’s way of asking who’s more patient.”
After a strong run, Nifty pauses for breath. The next session will reveal whether this was just a pit stop or the start of a new short-term consolidation phase.
✏️ Disclaimer
This is just my personal viewpoint. Always consult your financial advisor before taking any action.

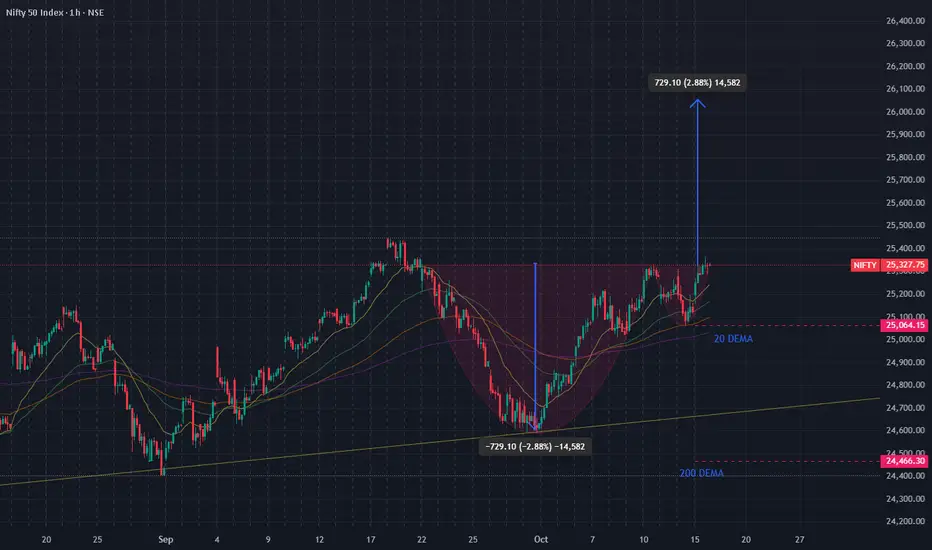
A Cup and Handle is visible in the Nifty 1 hour Chart... Setup - Completion of a Cup and Handle pattern.
Condition for Entry- A decisive break and close above the resistance level (the "rim" of the cup).
This confirms the pattern's breakout.
Entry Price - Enter long (buy) on a confirmed breakout above the rim resistance
(approximately 25,350 to 25,400 based on the chart).
Price Target - The conventional target for a Cup and Handle pattern is measured by
taking the depth of the cup and projecting it upwards from the breakout
point. The chart marks the depth as 775.10. Therefore, the target would
be: Breakout Price + Depth of the Cup. Example: If the breakout is at
25,350, the target is 25,350 + 775 = 26,125.
Stop-Loss (Risk Management) -
Place the stop-loss order below the lowest point of the "handle". This
ensures the trade is cut short if the breakout fails and the price reverses
into a downtrend.
Timeframe - This is an Hourly (1H) chart, so the trade would be suitable for a swing
trader or a short-term position trader, potentially lasting days to a couple
of weeks.
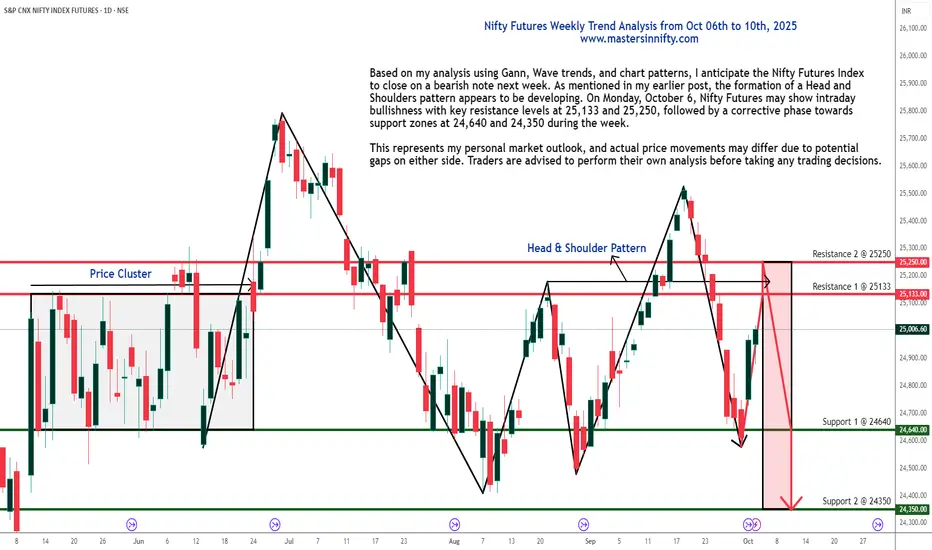
Nifty Index Futures Weekly Outlook from October 06-10, 2025Based on my analysis using Gann, Wave trends, and chart patterns, I anticipate the Nifty Futures Index to close on a bearish note next week. As mentioned in my earlier post, the formation of a Head and Shoulders pattern appears to be developing.
On Monday, October 6, Nifty Futures may show intraday bullishness with key resistance levels at 25,133 and 25,250, followed by a corrective phase towards support zones at 24,640 and 24,350 during the week.
This represents my personal market outlook, and actual price movements may differ due to potential gaps on either side. Traders are advised to perform their own analysis before taking any trading decisions.
Analysis on NIFTY50(short term bearish)1. Index fell sharply from 25400 to 24600
2. it is sitting now at 24600 support zone testing before in early September.
3. Indecision near support.
4. Selling pressure earlier was strong.
NIFTY50 is still in short-term downtrend, holding support at 24600.
Disclaimer:
I am NOT a SEBI registered advisor nor a financial advisor.
Any investments or trades I discuss on my blog are intended solely for educational purposes and do not represent specific financial, trading, or investment advice.
Disclosure:
I, the author of this report, and my immediate family members do not have any financial interest or beneficial ownership in the securities mentioned herein at the time of publication.

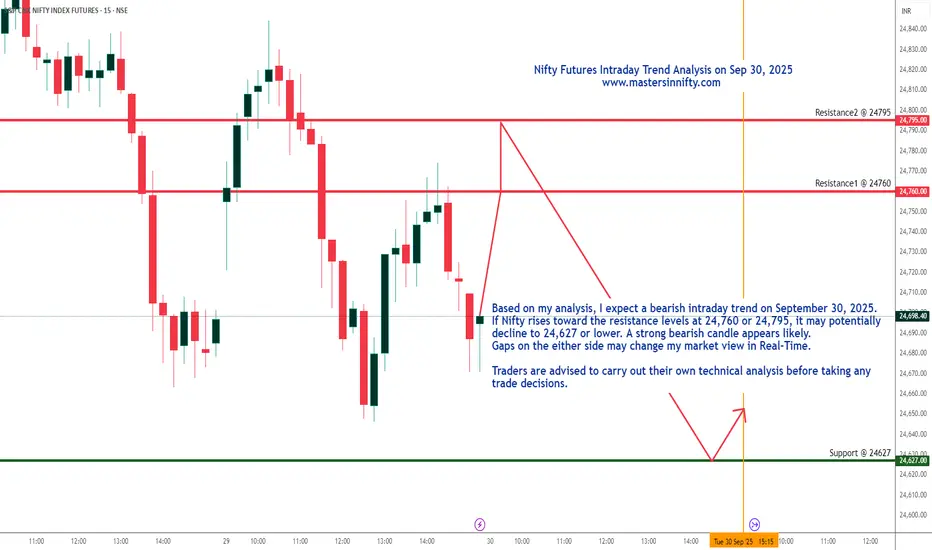
Nifty Futures Intraday Trend analysis on Sept 30, 2025Based on my analysis, I expect a bearish intraday trend on September 30, 2025. If Nifty rises toward the resistance levels at 24,760 or 24,795, it may potentially decline to 24,627 or lower. A strong bearish candle appears likely. Gaps on the either side may change my market view.
Traders are advised to carry out their own technical analysis before taking any trade decisions.