Nifty Analysis EOD – January 14, 2026 – Wednesday🟢 Nifty Analysis EOD – January 14, 2026 – Wednesday 🔴
Harami Cross at the Edge: Bulls and Bears Battle for the 25,600 Line.
🗞 Nifty Summary
The Nifty opened with a 60-point Gap Down, but buyers quickly intervened, filling the gap within minutes to test the 25,750 ~ 25,780 resistance zone. After multiple failed attempts to break out, the index slipped back toward the day’s low, finding temporary refuge at a bullish trendline.
A second recovery attempt successfully breached the IBH and the resistance zone, marking a day high of 25,791.75.
However, the joy was short-lived; a sharp rejection followed, snapping the trendline and dragging the index through the CDO and IBL. Nifty eventually tested the PDL (25,603) with precision, sparking a late 111-point bounce to close at 25,665.60.
The result is a Harami Cross pattern on the daily chart, signaling deep indecision as the index remains trapped within the previous day’s range.
🛡 5 Min Intraday Chart with Levels
🛡 Intraday Walk
Today was a theatre of high-octane drama. The charts show a relentless tug-of-war, with the index climbing and sliding sharply as both camps fought for dominance.
The rejection from the 25,790 area confirms that sellers are still heavily active at higher levels, but the “Double Bottom” effect near 25,600 (testing today’s low of 25,603.95 against yesterday’s 25,603.30) shows that bulls are not ready to surrender this psychological floor.
The intraday trendline failure at 1:30 PM was the pivotal moment for bears, while the final recovery from the PDL saved the bulls from a catastrophic breakdown.
📉 Daily Time Frame Chart with Intraday Levels
🕯 Daily Candle Breakdown
Open: 25,648.55
High: 25,791.75
Low: 25,603.95
Close: 25,665.60
Change: −66.70 (−0.26%)
🏗️ Structure Breakdown
Type: Doji Candle (Harami Cross).
Range (High–Low): ≈ 188 points — moderate volatility.
Body: ≈ 17 points — weak directional conviction.
Upper Wick: ≈ 143 points — massive rejection from higher supply zones.
Lower Wick: ≈ 45 points — localized buying support near the PDL.
📚 Interpretation
The Harami Cross, appearing within the massive range of January 13, indicates a total standoff. The long upper wick (143 points) is the most telling feature, proving that every attempt to sustain above 25,750 is being met with aggressive selling. However, the fact that Nifty closed 15 points above its opening (CDO) and held the 25,600 support suggests a base is attempting to form.
🕯 Candle Type
Bearish Rejection / Indecision Candle — Highlights overhead supply; the market is coiling for a breakout from this Harami structure.
🛡 5 Min Intraday Chart
⚔️ Gladiator Strategy Update
ATR: 211.39
IB Range: 123.15 → Medium
Market Structure: Balanced
Trade Highlights:
11:27 Long Trade: SL Hit (Bulls trapped during the failed IBH breakout).
13:32 Short Trade: Target Hit (R:R 1:2.59) (High-conviction Trendline Breakout).
14:23 Short Trade: SL Hit (V-shape bounce from PDL support).
Trade Summary: A mixed day for the strategy. While the 1:2.59 short trade perfectly captured the trendline collapse, the extreme volatility near the range extremes (IBH and IBL) resulted in two stop-loss hits. The net result remains protective in a non-trending “Balance” market.
🧱 Support & Resistance Levels
Resistance Zones:
25693
25750 ~ 25780 (Major)
25820
25855 ~ 25880
Support Zones:
25600 (Critical)
25550
25475
🧠 Final Thoughts
“The 25,600 Line in the Sand holds... for now.”
Today confirmed that while the bulls have the heart to defend 25,600, they lack the lungs to climb past 25,800.
Today confirmed that while the bulls have the heart to defend 25,600, they lack the lungs to climb past 25,800.
We are officially in a “Squeeze” zone. The market is coiling, and the next directional move will be determined by a breakout from this tight “Harami Cross” structure.
For tomorrow, I’m watching the 25,600 level like a hawk; if it snaps, the floor is far below, but before that, bulls might attempt 25750 once again.
✏️ Disclaimer
This is just my personal viewpoint. Always consult your financial advisor before taking any action.
Niftytrendpattern

CreditAccess Grameen (CREDITACC) – Bullish Breakout SetupStock Name: CreditAccess Grameen (CREDITACC)
Trend : Bullish
Timeframe : Daily
Trade Setup
Entry Point: ₹1,163
Stop Loss: ₹1,089 (Risk: ~6.4% from entry)
Targets:
Target 1: ₹1,205.70
Target 2: ₹1,248.75
Target 3: ₹1,294.15
Target 4: ₹1,337.15
Final Target: ₹1,385
Technical Rationale for Breakout
Bullish Flag Pattern Breakout: Price has broken out of a Bullish Flag pattern, signaling a continuation of the prior uptrend.
200 DEMA Support: The stock crossed above and retested the 200-day Exponential Moving Average (DEMA), now acting as strong support.
RSI Strength:
Daily RSI: Above 60 (indicating bullish momentum).
Weekly RSI: Also above 60 (confirms broader bullish bias).
Volume Confirmation:
Breakout day volume: 4.0M (extremely high vs. previous day’s 406.05K), validating the breakout’s strength.
Key Observations
The combination of a Bullish Flag breakout, volume surge, and RSI strength suggests a high-probability trade.
The 200 DEMA support adds confluence to the bullish structure.
Risk Management Tips
Strictly adhere to the stop loss.
Trail stops as price progresses toward targets.
Consider partial profit booking at each target level.
Disclaimer
This analysis is for educational and informational purposes only and should not be construed as financial or investment advice. Trading in equities carries inherent risks, including the potential loss of capital. Always conduct your own due diligence and consult a certified financial advisor before making any investment decisions. Past performance is not indicative of future results. The author assumes no responsibility for financial losses or gains based on this post. Volume, price, and indicator data are subject to market volatility and may change rapidly.
Let me know your thoughts in the comments! Are you watching this setup? 📈🔍

#NIFTY Intraday Support and Resistance Levels -22/04/2024Nifty will be gap up opening in today's session. After opening nifty sustain above 22170 level and then possible upside rally up to 22290 level in today's session. in case nifty trades below 22130 level then the downside target can go up to the 22010 level.

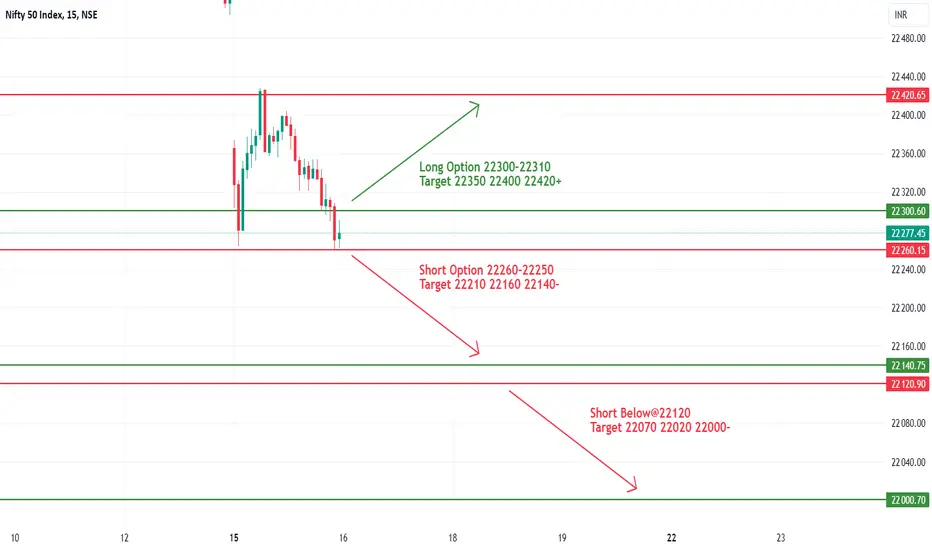
#NIFTY Intraday Support and Resistance Levels -16/04/2024Nifty will be gap down opening in today's session. After opening nifty start trading Below 22260 level and then possible downside rally up to 22140 & this rally can extend another 120 points if market gives breakdown 22120 level in today's session. in case nifty trades Above 22300 level then the upside target can go up to the 22420 level.
#NIFTY Intraday Support and Resistance Levels -12/04/2024Nifty will be gap down opening in today's session. After opening nifty start trading Below 22720 level and then possible downside rally up to 22600 in today's session. in case nifty trades Above 22760 level then the upside target can go up to the 22880 level.

#NIFTY Intraday Support and Resistance Levels -01/04/2024Nifty will be gap up opening in today's session. After opening nifty sustain above 22370 level and then possible upside rally up to 22490 level & this rally can extend another 100-120 points if market gives breakout 22510 level in today's session. in case nifty trades below 22320 level then the downside target can go up to the 22200 level.also possible reversal downside 22490 level.

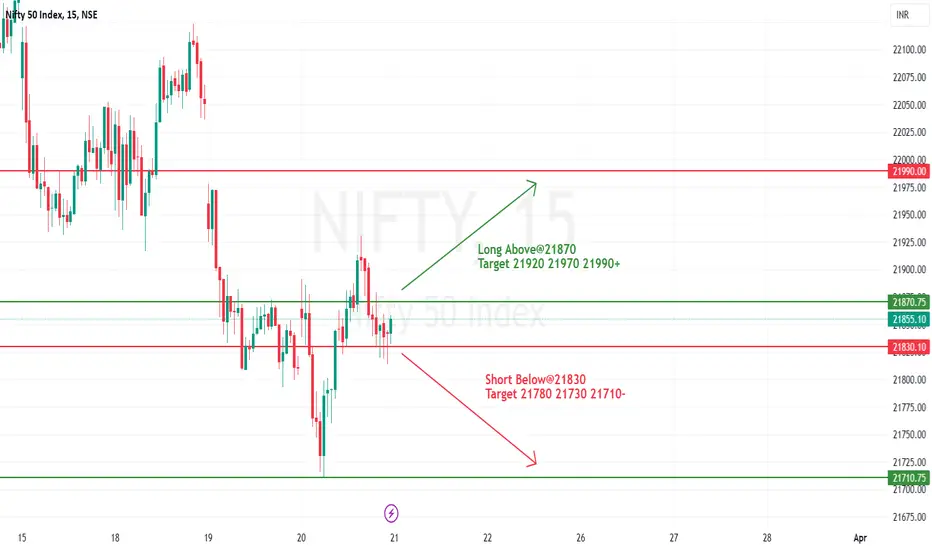
#NIFTY Intraday Support and Resistance Levels -21/03/2024Nifty will be gap up opening in today's session. After opening nifty sustain above 21870 level and then possible upside rally up to 21990 level in today's session. in case nifty trades below 21830 level then the downside target can go up to the 21710 level.
#NIFTY Intraday Support and Resistance Levels -20/03/2024Nifty will be gap up opening in today's session. After opening nifty sustain above 21820 level and then possible upside rally up to 21940 level in today's session. in case nifty trades below 21790 level then the downside target can go up to the 21670 level.

#NIFTY Intraday Support and Resistance Levels -15/03/2024Nifty will be gap up opening in today's session. After opening nifty sustain above 22170 level and then possible upside rally up to 22290 level in today's session. in case nifty trades below 22130 level then the downside target can go up to the 22010 level.

#NIFTY Intraday Support and Resistance Levels -14/03/2024Nifty will be gap down opening in today's session. After opening nifty start trading below 21930 level and then possible downside rally up to 21810 in today's session. in case nifty trades above 22000 level then the upside target can go up to the 22120 level.

#NIFTY Intraday Support and Resistance Levels -05/03/2024Nifty will be gap up opening in today's session. After opening nifty sustain above 22420 level and then possible upside rally up to 22540 level in today's session. in case nifty trades below 22370 level then the downside target can go up to the 22250 level.
