NIFTY 50 Index (2H timeframe) ..NIFTY 50 Index (2H timeframe)
---
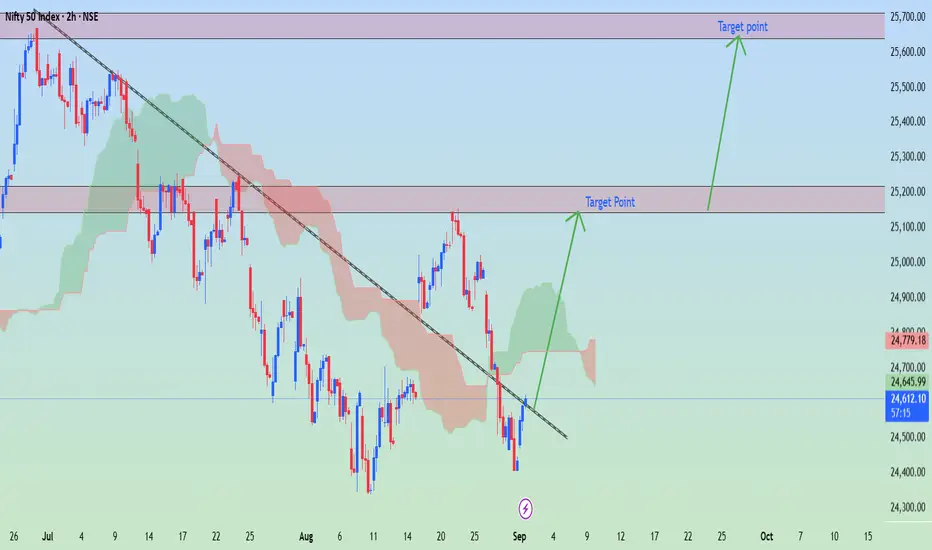
Current Market Context
Instrument: NIFTY 50 Index (NSE)
Current Price: ~24,709
Trend: Recently bounced from a support zone after a downtrend.
Indicators: Price is trying to recover above the Ichimoku cloud and has broken a short-term descending trendline.
---
Targets Marked on my Chart
1. First Target Zone: 25,150 – 25,200
This is the immediate resistance / supply zone.
Likely to be tested first on bullish continuation.
2. Second Target Zone: 25,550 – 25,600
This is the extended bullish target.
It aligns with the next major resistance zone marked in your chart.
---
Trade Idea
Entry Zone: Around 24,700 – 24,750 (current levels).
Take Profit 1: ~25,150 – 25,200.
Take Profit 2: ~25,550 – 25,600.
Stop Loss: Below recent swing low (~24,500).
---
⚠ Note: NIFTY moves strongly with global cues and India’s market data. If bulls fail to hold above 24,500, bearish pressure could resume.
Niftyupdate
NIFTY BANKNIFTY PRICE ACTION UPDATEFind out the video to know how price reacted and how we predicted the level and at last there is an amazing setup which works 100% in trending market either upside or downside.

Nifty at a deciding juunctureThe bounce in Nifty currently seems to be in 3 waves.
If 17428.05 marked the completion of wave 3 and 17207.25 is taken out before making another move up (i.e. above 17428.05), then it would suggest that nifty will see more downside in the coming weeks/ months.

Nifty small retracement 16000 to 16250As per fibb analysis nifty may retracement 16000 to 16250 because of nazdaq100 dow jone in positive yesterday.this is my way of thought
