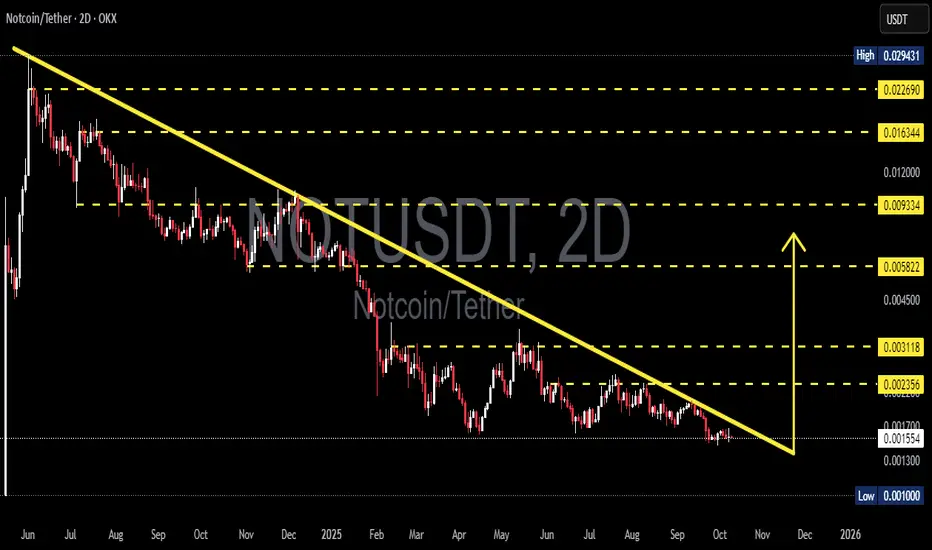
NOT/USDT — Descending Triangle: One Move Away from Expansion?The 2D chart of NOT/USDT reveals a descending triangle formation — a classic compression pattern signaling that the market is reaching a major decision point. For months, price action has been trapped under a falling trendline (yellow), forming a series of lower highs, while buyers continue to defend the 0.0013–0.0010 support zone with persistence.
This setup now represents a make-or-break moment:
Will NOT finally break out of its long-term downtrend, or will it face one last capitulation before finding a true bottom?
---
🔹 Pattern Structure
Pattern: Descending Triangle — a compression setup often seen near the end of a prolonged downtrend.
Interpretation: Still technically bearish, but every failed breakdown strengthens the potential for a bullish reversal.
Volume: Gradually declining — showing quiet accumulation and energy buildup before a potential expansion.
---
🔹 Key Technical Levels
Support Zone: 0.0013 – 0.0010 (major buyer defense)
Current Price: ≈ 0.001558
Resistance Targets:
R1 → 0.002356 (initial breakout target)
R2 → 0.003118 (trend flip zone)
R3 → 0.005822 (momentum expansion)
R4 → 0.009334 – 0.016344 (mid-term resistance cluster)
---
🟢 Bullish Scenario
A confirmed 2D candle close above the yellow trendline with strong volume could trigger a reversal breakout, signaling the end of the prolonged compression phase.
In that case, the next impulsive targets lie near 0.002356 and 0.003118.
Typically, a clean breakout is followed by a retest — the best opportunity for confirmation-based entries.
📈 “Breakout + Retest = Momentum Reversal.”
---
🔴 Bearish Scenario
If the 0.0013–0.0010 support breaks down with expanding sell volume, the descending triangle confirms its bearish continuation role.
This could lead to a quick retest of the 0.0010 zone, potentially marking a final capitulation phase before long-term accumulation begins.
📉 “Losing the floor means retesting history.”
---
⚙️ Overall Perspective
The market is entering the final stage of compression — volatility and volume are tightening, signaling that a major directional move is approaching.
Whether up or down, this next move could define NOT/USDT’s mid-term trend into Q4 2025.
> “The longer the silence, the bigger the explosion that follows.”
---
#NOTUSDT #Notcoin #CryptoAnalysis #DescendingTriangle #BreakoutSetup #PriceCompression #TrendReversal #AltcoinAnalysis #CryptoTrading #TechnicalAnalysis #SupportResistance #MarketStructure
Notusdtsignal
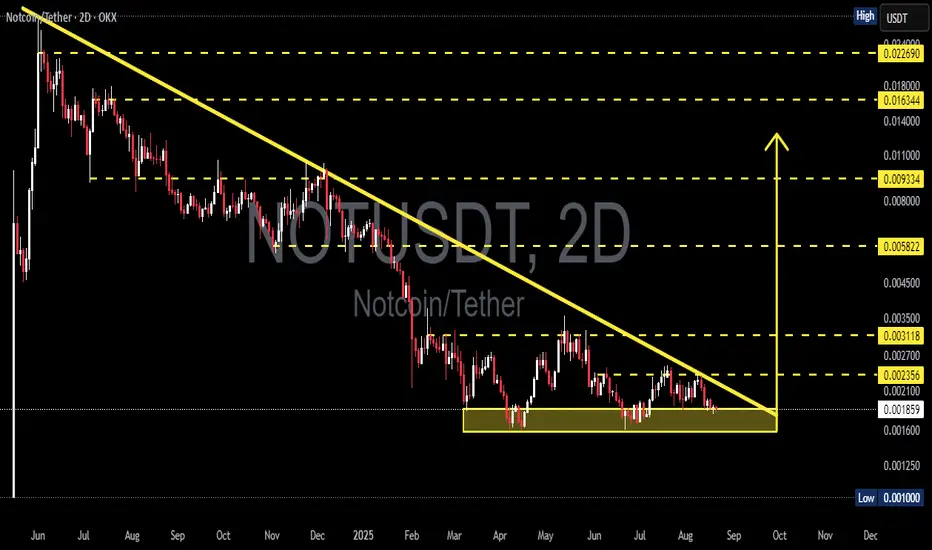
NOTUSDT — Descending Triangle Support! Breakout or Breakdown?Currently, NOT/USDT is trading at a decisive point after a long downtrend. The chart clearly forms a Descending Triangle, a classic pattern that often signals bearish continuation, but under certain conditions can turn into a bullish reversal if a strong breakout occurs.
---
🔎 Pattern & Context
Main Pattern: Descending Triangle (consistent lower highs + strong horizontal support).
Support Zone: 0.0016 – 0.0019 (yellow box). This zone has been tested multiple times, showing buyers are still defending it.
Previous Trend: Strong bearish trend → favors breakdown, but reversal potential remains if bulls manage to break above the descending trendline.
Momentum: Price is being squeezed at the apex of the triangle → a major move is likely imminent.
---
🟢 Bullish Scenario (Upside Breakout)
If price successfully breaks above the descending trendline with a 2D close + strong volume, a reversal setup will be triggered.
🎯 Bullish Targets:
First target: 0.002356 (nearest resistance).
Next targets: 0.003118 → 0.005822.
If strong momentum continues → potential extension toward 0.0093 – 0.0163 (resistance levels shown on chart).
📌 Validation: Breakout + successful retest of the trendline (turning into new support) increases bullish probability.
---
🔴 Bearish Scenario (Downside Breakdown)
If price fails to hold the 0.0016 – 0.0019 support zone, the descending triangle plays out as a bearish continuation pattern.
🎯 Bearish Targets:
Initial target: 0.0010 (previous major low).
If selling pressure accelerates → potential formation of new lows below 0.0010.
📌 Validation: 2D candle close below 0.0016 with strong volume + failed retest = confirmed breakdown.
---
📌 Conclusion & Key Notes
0.0016 – 0.0019 is the key decision zone. Holding it opens the door for a bullish reversal, while breaking it signals continuation of the downtrend.
A major move is approaching as price gets compressed at the triangle’s apex.
Watch out for false breakouts / breakdowns → always wait for volume confirmation.
Strict risk management is crucial, especially for low-cap coins with high volatility and manipulation risks.
#NOT #NOTUSDT #Crypto #Altcoin #PriceAction #TechnicalAnalysis #DescendingTriangle #Breakout #Bearish #Bullish
NOTUSDT 2D AnalysisNOT ~ 2D Analysis
#NOT This trade is very high risk. Buy if you still have confidence in this coin. With a short term target of at least 15%+.

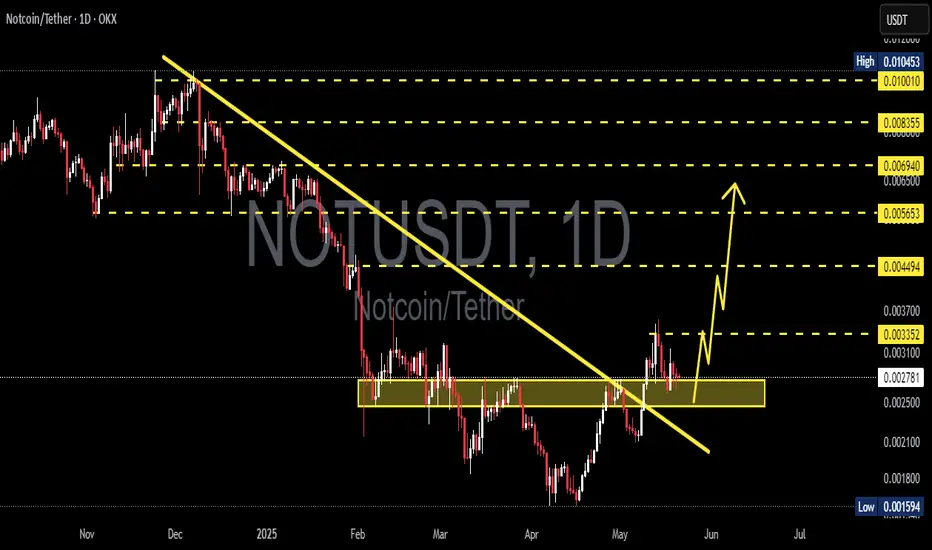
NOTUSDT 1D AnalysisNOT ~ 1D Analysis
#NOT Buy gradually from here if you still have confidence in this coin with a short term target of at least 15%+.

NOTUSDT 1D Analysis NOT ~ 1D Analysis
#NOT Buy incrementally from this support block with a short term target of at least 15%+ from here.
NOTUSDT 1D AnalysisNOT ~ 1D Analysis
#NOT Buy when re -testing this support block with a short -term target of at least 10%+ from here.

NOTUSDT 1DNOT ~ 1D Analysis
#NOT Buy gradually after successfully penetrating this resistant line with a short -term target of at least 10%+.

NOTUSDT 3DNOT ~ 3D
#NOT This is the last support block for this coin. If you still have Conviction on this coin,. Buy in stages with a target of 20%++

NOTUSDT AnalysisHey traders!
Taking a look at NOTUSDT, we can see it's currently trading within a mini ascending channel.
Bullish Scenario:
If we see an increase in buying pressure and volume, along with a break above the $0.007050 resistance level, we could see NOTUSDT continue its upward momentum towards the $0.007500 resistance. A confirmed break above $0.007500 could potentially open the doors for further gains, targeting the $0.007800 level and extending the uptrend within a broader macro ascending channel.
Key Resistance Levels:
$0.007050
$0.007500
$0.007800
Bearish Scenario:
On the flip side, if the price breaks down below the ascending channel's support and confirms a close below it, we could see a significant pullback. The $0.006700 and $0.006500 levels would be the initial support zones to watch. However, a further decline could lead the price towards the historical support zone between $0.005500 and $0.005600.
Remember:
This is just my personal analysis, and it's crucial to conduct your own research and consider your risk tolerance before making any trading decisions.
Keep an eye on trading volume and price action for confirmation of any potential breakouts or breakdowns.
Consider setting stop-loss orders to manage your risk effectively.
Let me know if you have any questions or thoughts!
Happy trading!
