BTC 1D: watching 64–73k box for Nov 25–26 FED weekBearish channel intact unless 80k is reclaimed. Map, not signal.
Key idea: the bearish channel guides price into 64–73k. If we drift there by Nov 25–26, FED could trigger the next major move.
Not advice: I act only if price respects the box and vol/volume confirm. Until then this is a roadmap, not a signal.
Which side of 64–73k breaks first?
November

November Gold Paradox: Expected Strength Meets Blurred Direction
🍂 November typically brings seasonal bullish moves for Gold; demands from India and China, central bank interest, and safe-haven flows as the year winds down.
⭐But November 2025 opens with hesitation, not momentum.
October closed with fresh all-time highs, followed by a sharp end-month correction that broke short-term structure. Now, Gold begins November range-bound, lacking both clarity and fundamental conviction.
Contributing to this indecision is the U.S. government shutdown, which has delayed critical economic data. Without jobs reports or inflation metrics, the Fed has no updated visibility and traders are left without macro confirmation to support directional conviction. While shutdowns often support Gold as a safe haven, the current blackout has instead amplified uncertainty.
🔹 This first week already carries weight: ISM Manufacturing PMI on Monday (negative for Dollar as of recent release) and ADP Employment on Wednesday; two of the few confirmed releases still standing despite the shutdown. They could offer short-term directional clues if volatility aligns with structure, but just as easily trigger reactive spikes that fade within hours. Either way, the message is the same let structure confirm before conviction takes over.
Until that changes, structure not sentiment is the only valid guide.
📚 November’s Setups in Disguise
Gold is trading November more in anticipation.
Because the market isn’t lost, but simply waiting for structure to confirm direction.
Our metal is moving between defined zones, reacting level to level, not to headlines or speculation.
For now, price is holding inside a decision area, no breakout yet and that telling us to be patient.
Here’s the paradox:
→ If Gold begins to rally this month, the whispers of an early Fed pivot will return. Risk appetite expands, and momentum traders chase continuation.
→ If it sells off, those same expectations get priced out. The safe-haven flows unwind, and bearish narratives resurface.
→ But if Gold simply stays trapped in a wide, reactive range both buyers and sellers become liquidity for one another if they do not pay attention.
And that’s the part most traders miss. November is a preparation month.
Volatility without confirmation is dangerous.
→ Read the structure, not the headlines.
→ Trade the reaction, not the assumption.
→ Focus on your system, not the noise.
Clarity will come, but maybe not in the first week.
⚖️ The Mindset Shift This Market Demands
Beware this not the Gold environment we were trading even two months ago.
We’ve entered a phase where volatility has changed: one-minute candles can travel 200+ pips, and price can sweep both sides of structure in minutes. Volumes in a day can exceed 2000+ pips.
🔹 Think in wider zones, not narrow scalps.
High timeframe levels — like H1/30M and H4 — are providing more stability in these volatile conditions. Entries defined there, confirmed on M15 or M5, are showing better follow-through.
🔹 Consider reducing your lot sizes.
Not as a rule, but as a response to the increased range and unpredictability. What worked with older volatility may now lead to outsized losses in the blink of an eye.
🔹 Let go of urgency.
This isn’t about catching every move. In fact, the best setups in this market come from not chasing, but letting structure unfold first. 1 good setup/day is more than enough.
🔹 Trade with the trend first — countertrend only with caution.
The current volatility makes every retracement look like opportunity, but most reversals are just liquidity sweeps. Until structure confirms a real shift, fading moves is riskier than riding them.
XAUUSD has changed pace again. And the traders who are adapting ,without needing to predict ,are the ones who’ll stay in profit in this cycle.
This November isn’t a month for bold predictions, so let’s trade what’s real, adjust often, and survive cleanly into December, with capital and clarity intact.
If this article gave you clarity for the weeks ahead, drop a 🚀 and follow us ✅for Trading Psychology articles and daily ideas.

IOTEX and JASMY_chartsLooks like there is a strong similarity between IOTX and JASMY. Both were listed to coinbase around the same time,.

STELLAR and DOGECOIN_chartsThe similarity between Dogecoin's run up and the current trend of XLM is quite similar leading me to see the price of Stellar holding up to the position current on the chart, that is if the similarity between both charts is an example of what happens among many other theories on price and targets.

PYRAMID FINANCIAL "website"I randomly came across this brand new token,. The website is fintage meme culture stuff, microsoft like. On CoinGecko the price is said to have started around $50.00 USD. From trading view I see a beginning price that was around $2.00 USD.

(SOL) solana "4th" Solana's market capital has surpassed BNB and is now the 4th largest cryptocurrency in the world.

BITCOIN (BTC) Long line measurement, past halving high, current price measure, future dated location map, temporary potential, bitcoin triangle, bitcoin into triangle, bitcoin falls out of triangle, short term loss in prices,.

BTCUSDT Long futureExcuse me!
It's been a long time since I wrote an opinion or an idea here, but I'm learning the dynamics and laws of the market.
In my opinion, this is a flag formation at 4 o'clock. An eruption is expected from it until November 22. I believe that if this pattern is confirmed, BTC may have growth potential in the future. I look forward to your opinions and comments in the comments. Thank you for reading.
R3ncso

Overview of Cryptocurrency Volatility - 1h, November, 2022.Analysis of the volatility index in November. Time interval - 1 hour.
Currency - USDT or equivalent to BUSD .
The selection is carried out according to the lists of cryptocurrencies that are represented on the spot and futures markets, with a total of more than a hundred coins.
Top 15 Coins (1 hour):
1. PHB /busd - 1413.67% (High&Low: 3119.4%)
2. MASK /usdt - 1386.55% (High&Low: 2940.2%)
3. BAND /usdt - 1266.71% (High&Low: 2605.56%)
4. AMB /busd - 1068.75% (High&Low: 2363.97%)
5. LEVER /busd - 1061.4% (High&Low: 2339.31%)
6. PEOPLE /usdt - 1034.08% (High&Low: 2146.72%)
7. DYDX /usdt - 1008.12% (High&Low: 2113.56%)
8. GTC /usdt - 1006.37% (High&Low: 2069.63%)
9. SFP /usdt - 959.68% (High&Low: 2125.98%)
10. CHZ /usdt - 946.32% (High&Low: 1971.69%)
11. SOL /usdt - 915.31% (High&Low: 1899.99%)
12. LIT /usdt - 874% (High&Low: 1793.31%)
13. DODO /busd - 869.22% (High&Low: 1759.8%)
14. AR /usdt - 857.38% (High&Low: 1782.73%)
15. SUSHI /usdt - 855.32% (High&Low: 1774.11%)
The coin showed the worst result: BTC /usdt - 287.52% (High&Low: 644.26%)
Thanks for your attention!

Overview of Cryptocurrency Volatility - 1D, November, 2022.Analysis of the volatility index in November. Time interval - 1 day.
Currency - USDT or equivalent to BUSD .
The selection is carried out according to the lists of cryptocurrencies that are represented on the spot and futures markets, with a total of more than a hundred coins.
Top 15 Coins (1 day):
1. MASK /usdt - 361.63% (High&Low: 696.13%)
2. BAND /usdt - 337.16% (High&Low: 715.42%)
3. LEVER /busd - 279.01% (High&Low: 624.26%)
4. PHB /busd - 265.87% (High&Low: 816.13%)
5. SFP /usdt - 260% (High&Low: 543.59%)
6. DYDX /usdt - 228.3% (High&Low: 473.58%)
7. SOL /usdt - 224.96% (High&Low: 403.6%)
8. GTC /usdt - 221.38% (High&Low: 481.87%)
9. CHZ /usdt - 213.19% (High&Low: 415.79%)
10. CELO /usdt - 205.89% (High&Low: 380.34%)
11. C98 /usdt - 203.71% (High&Low: 405.97%)
12. REN /usdt - 203.28% (High&Low: 452.57%)
13. AMB /busd - 202.06% (High&Low: 553.96%)
14. APE /usdt - 201.33% (High&Low: 380.98%)
15. CRV /usdt - 201.2% (High&Low: 396.61%)
The coin showed the worst result: CTK /usdt - 69.79% (High&Low: 170.42%).
Full list of analyzed coins: www.tradingview.com
Analysis information for all coins: docs.google.com
Thanks for your attention!

Overview of Cryptocurrency Volatility - 1M, November, 2022.Analysis of the volatility index in November. Time interval - 1 month.
Currency - USDT or equivalent to BUSD .
The selection is carried out according to the lists of cryptocurrencies that are represented on the spot and futures markets, with a total of more than a hundred coins.
Top 15 Coins (November):
1. MASK /usdt - 73,79% (High&Low: 168,02%)
2. BAND /usdt - 65,23% (High&Low: 218,19%)
3. SOL /usdt - 56,52% (High&Low: 85,51%)
4. NEAR /usdt - 44,51% (High&Low: 64,77%)
5. LTC /usdt - 43,87% (High&Low: 65,54%)
6. REEF /usdt - 41,64% (High&Low: 85,66%)
7. APT /usdt - 39,85% (High&Low: 61,5%)
8. HNT /busd - 39,5% (High&Low: 61,75%)
9. KAVA /usdt - 39,08% (High&Low: 50%)
10. MANA /usdt - 38,64% (High&Low: 57,78%)
11. GALA /usdt - 38,23% (High&Low: 48,02%)
12. ANC /busd - 35% (High&Low: 57,89%)
13. LUNA /usdt - 33,8% (High&Low: 59,45%)
14. FLOW /usdt - 32,42% (High&Low: 59,34%)
15. SAND /usdt - 32,17% (High&Low: 53,61%)
The coin showed the worst result: BCH /usdt - 1.3% (High&Low: 33.91%).
Full list of analyzed coins: www.tradingview.com
Analysis information for all coins: docs.google.com
Thanks for your attention!

SPY: 312 | The Deal is On .. FOMO is REAL last call to buy the dips.. shorts are covering
stubborn shorts are getting crushed
notably bad news in the last 90 days have been
rolled out by big shots that missed the V Bottom ...
--

USD/CAD November IPDA Recap 2022Hello Traders!
Here we can see UJ went for the sell stops or sell side equity for the month of November.

USOIL November IPDA DATA Range Results Hello Traders!
Here is how I think about the market when using the Data ranges.
I'm using the principles of price seeking liquidity.
For this month are we likely to go up or down? Is this month going to most likely move sideways?

Crude Oil is BearishNYMEX:CL1!
Crude Oil futures marked on the 4h chart
After being neutral the past week due to ranging behavior, CL has just possibly shown its hand on where it is headed to in the short term.
Confluences
Overall bearish order flow since the summer.
Liquidity grab at the double top (marked with the X line).
Market Structure Shift (MSS) by breaking the short term low at ~87.60.
Retraced into 4h imbalance and rejected it, thus showing it is respecting a premium price and now seeking a discount.
In premium of September 26 - October 9 dealing range as shown by the fibonacci.
Looks like bread-and-butter sell model in the making.
Current signs show oil is intending to go lower. I am anticipating at least 81.30 as a target level because there is a liquidity void resting below it.

Nifty View - Nov expiry After a fantastic run up from 17k levels to a new 52W we did not saw a retracement in the price. On week to week base i have marked the important fib levels and for a very short term trend 18100 support need to be protected if by any chance we broke the support level we may see the price going for a retracement/gap filling zones. View for the Nov month expiry will be the 18200-18500 if these levels are protected we can see the expiry somewhere in between and if either side gives up we may see a major move.

Crash before CPI. CPI will ignite more selloff.Crash before CPI. CPI will ignite more selloff.
Its coming. Winter is coming.

BTCUSDT 01 Nov 2022 Long Term Analysis (Daily)Following a large number of requests here is my 01 November 2022 long term $BTC / $USDT analysis. #BTC
I have made this analysis of the BTC USDT in order to determine a safe entry point for a long term investment.
To date (01 Nov 2022) I have deduced that the market offers two scenarios. The first one (the most likely one in view of the geopolitical and economic conditions from a macroeconomic point of view) would be a continuation of the decline. I estimated the latter using the Crypto Fear & Greed Index of the alternative.me website with a 70% chance of realization.
The second, less likely scenario would be following the pump that we had this week a reversal of the trend in order to go back up on the long term. 30% chance of success.
I have determined that the red scenario has a better chance of happening for various reasons:
- Firstly the global economic conditions do not allow for a bullish reversal.
- Secondly, we have a bearish divergence in the daily chart this week.
- Thirdly the $18500 / $22500 range has not had a confirmed breakout with enough volume to speak of a long term reversal.
- Fourth, the failure of last week's pump at the $20,800 resistance.
At this time with the information we have I recommend not to buy BTC.
Of course I would like to remind you that I am not a fortune teller, nobody can know how the market will behave. However, we can analyze it and with the help of the past and statistics, try to find the best entry and exit points
However, if you have any questions, I remain at your disposal in the comment space.
THIS IS NOT INVESTMENT ADVICE

$BTC: A move to monthly 38.2% shallow fib for November- $29.3k?The September monthly close could be a turn around month.
If so, $29.3 could be in order for November.
Just reading the "sines" .. lol
Fibo.

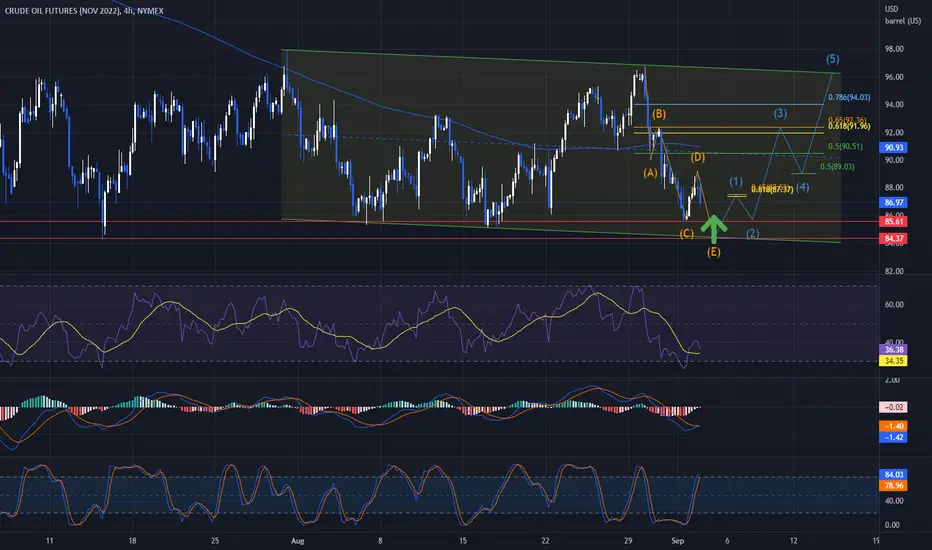
Crude Oil... Long for now, maybe short soon after?Oil has been getting smacked sense the 29th of Aug. losing nearly 17%. It is time for a bounce. Today we are getting a nice reaction at the major trendline that started back in Oct. of 2020. Not only is there an important trendline to consider, but we also have a descending channel that is also coming into play. This channel is also very important as it contains all price action since the invasion of Ukraine.
As we move on into the channel we see a smaller channel, a key range to recapture, and multiple golden pockets. The small channel, I feel, is self-explanatory. The key range to recapture is a price range that has influenced the price sense Nov. 2021, we must break above this range to make this a valid long trade. Finally, I use GPs to help me determine where prices will go. The GP nearest to the current price will be my first take profit target and possible short opt. The second and third GPs are simply two more major Tp targets. The top GP will not only be a great Tp but it will also be a amazing spot to get short on oil.
Good luck!

Nov. Crude Oil... OPEC+ meeting on the 5thNext week on the 5th of Sept. OPEC+ will have a meeting to talk all things oil. I am thinking they will pull back on production due to the massive decline in oil prices this week. (11.5% on Nov. Crude). With lower production, brings lower supply, lower supply brings higher demand!
That being sad, I am looking to get long today or next week. On the chart I am looking for a swing failure of yesterdays lows into the red horizontal area. I will scale in as the price enters this zone and double down at the bottom of the zone. There is a lot of confluence at the bottom of that area. Along with all of that I see a bullish divergence forming right now that would also aid in a nice rally here.
My take profit targets are signified by wave 1, 3, and 5.
This trade has a 75-85% chance of playing out to at least the top of wave 1, I plan to take 25% of my position off there and leave the rest for other targets. Move stop loss into profit.
Please leave a comment below on what you think and if you have an opposing idea!
Goodluck
DeFi Hype Play - CRVDear traders,
Intro: My name is Hugo, I am 25 years old and trading crypto currencies since late 2017. English is not my main language, however, I will try to explain everything brief and clear. Be aware that I am still in the learning curve. Every idea I post is not financial advice and is only meant for entertainment purposes only.
The chart looks amazing IMO. The price action of Curve (CRV/BTC) has experienced a long consolidation period. Now, the range of consolidation is getting extremely tight. If this blasts through, I think it will be an extremely swift move.
If it rejects, I will be scaling some of my Bitcoin into this coin around 0.00004573 sats.
& here some for the FA guys:
Curve is a popular automated market maker (AMM) platform that offers a highly efficient way to exchange tokens while maintaining low fees and low slippage by only accommodating liquidity pools made up of similarly behaving assets. While this approach results in lower fees for the liquidity providers who supply the pools with tokens, Curve incentivizes their participation by integrating with external DeFi protocols and delivering rewards in the form of CRV tokens and interest.
Goodluck,
Doctor Hugo

I HAVE LEARNED HOW TO BLOK.. I'm going to keep it simple with this one..
Check out the video. I have noticed a few trends that stand out and have consistently traded for a 25% profit every trade. That adds up pretty quickly, right? Anyways, trade smart and be cautious. This time of the year is a big unknown, and of course, there are people always spreading hype and trying to convince you to put more money into crypto. When we are in an area or time like this, I always consider these things... One, the news is not my friend. Two, the positive news released is meant to motivate us to buy. Three, the negative news that is released is intended to encourage us to buy. Fourth and final, I must trust my decision and accept every trade for what it is. Number four is a reminder to us all that we do make bad decisions sometimes and not to let that beat us up.
I hope all stays well, and everyone gets that 2-3X soon!
