a BuySide QuickScalp #USDCAD📌 Market Insight: {#USDCAD }
⚠️ Risk Assessment: {High}
🚀 Approach:
Not a Quality one ... need to have a Momentum Structure first .... Don't rush .
#Ash_TheTrader #Forex #GBPJPY #MarketAnalysis #TradingSetup #RiskManagement #GOLD #Scalper #NQ #EURUSD
Nq!

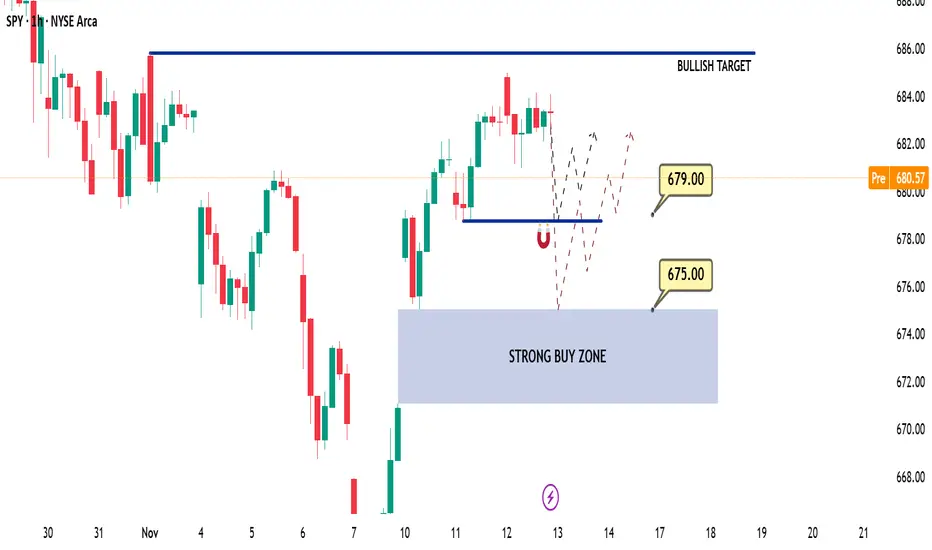
Daily SPY (US500-SPX) Outlook - Prediction (13 NOV)Daily SPY (US500-SPX) Outlook - Prediction (13 NOV)
📊 Market Sentiment
Market sentiment appears neutral, in my opinion. The U.S. government is expected to reopen soon; however, officials have decided not to release previous economic data. This adds uncertainty for traders without data, it becomes difficult to gauge the FED’s next policy decision.
📈 Technical Analysis
SPY experienced a range-bound session yesterday, consolidating between 680 and 685. On higher timeframes, price action still suggests a desire to expand higher, but momentum has temporarily slowed.
📌 Game Plan
In my opinion, the market may show slight bearish pressure early in the session, followed by a moderate bullish bounce.
Scenario 1: SPY may drop to 679 and bounce from there, returning to the 682–685 range.
Scenario 2: If SPY breaks 679 aggressively, I expect a retracement toward 675. At that level, I plan to load calls for a potential bullish move.
💬 For detailed insights and broader market context, please check my Substack link in profile.
⚠️ For educational purposes only. This is not financial advice.
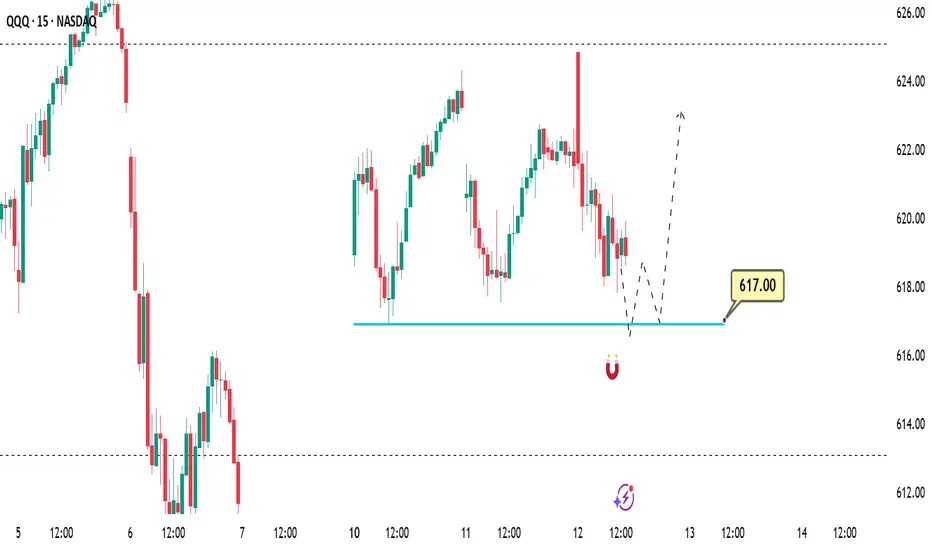
Daily QQQ (US100-NQ) Outlook - Prediction (13 NOV)Daily QQQ (US100-NQ) Outlook - Prediction (13 NOV)
📊 Market Sentiment
Market sentiment appears neutral, in my opinion. The U.S. government is expected to reopen soon; however, officials have decided not to release previous economic data. This creates uncertainty for traders without key data, it becomes difficult to anticipate the FED’s next policy decision.
📈 Technical Analysis
QQQ experienced a range-bound session yesterday, while the Dow Jones carried most of the market’s momentum. Compared to SPY, QQQ showed more weakness throughout the session. However, the higher-timeframe structure remains bullish, and I will continue following that bias.
📌 Game Plan
Scenario 1: Price may dip to the 616–617 zone and bounce from there, returning to the 621–623 range.
Scenario 2: If price breaks 617 aggressively, it may retrace toward 613 before bouncing back into the 620–625 zone.
In my opinion, calls may work better on SPY today, while puts could perform better on QQQ.
💬 For detailed insights and broader market context, please check my Substack link in profile.
⚠️ For educational purposes only. This is not financial advice.

a QuickScalp on #USDJPY 📌 Market Insight: {#USDJPY }
⚠️ Risk Assessment: {High}
🚀 Approach:
Same as GJ , Don't Rush ... need valid momentum Structure and LTF entry ... need it !
#Ash_TheTrader #Forex #GBPJPY #MarketAnalysis #TradingSetup #RiskManagement #GOLD #Scalper #NQ #EURUSD

another BuySide QuickScalp #GBPJPY 📌 Market Insight: {#GBPJPY }
⚠️ Risk Assessment: {High}
🚀 Approach:
Lets see , does it give us another QuickScalp or not ... its More Riskier than Yesterday
#Ash_TheTrader #Forex #GBPJPY #MarketAnalysis #TradingSetup #RiskManagement #GOLD #Scalper #NQ #EURUSD

Monitoring AI Valuation - Precision on Upcoming CorrectionThese are the three largest market-cap listed companies on the Nasdaq.
If we are concerned about an AI bubble, I’m going to show you how I perform a quick glance at some top companies and their index to determine the likelihood of an upcoming short-, mid-, or long-term correction.
In 2017, Microsoft’s P/E reached its highest at 45 — and it continued to rise after that.
In 2023, Nvidia’s P/E reached its highest at 147 — and it continued to rise after that.
In 2024, Apple’s P/E reached its highest at 40 — and it continued to rise after that.
Micro E-mini Nasdaq-100 Index
Ticker: MNQ
Minimum fluctuation:
0.25 index points = $0.50
Disclaimer:
• What presented here is not a recommendation, please consult your licensed broker.
• Our mission is to create lateral thinking skills for every investor and trader, knowing when to take a calculated risk with market uncertainty and a bolder risk when opportunity arises.
CME Real-time Market Data help identify trading set-ups in real-time and express my market views. If you have futures in your trading portfolio, you can check out on CME Group data plans available that suit your trading needs www.tradingview.com

QQQ (NQ/US100) Quick Trade Idea - (12 NOV)📌 Prediction / Game Plan
In my opinion, the price is currently attempting to reprice the gap around the 617 level.
If the price reaches this zone, we may see a rejection-bounce toward 620 first, followed by 625.
I’ll be closely watching the 617 zone for a potential call entry setup.
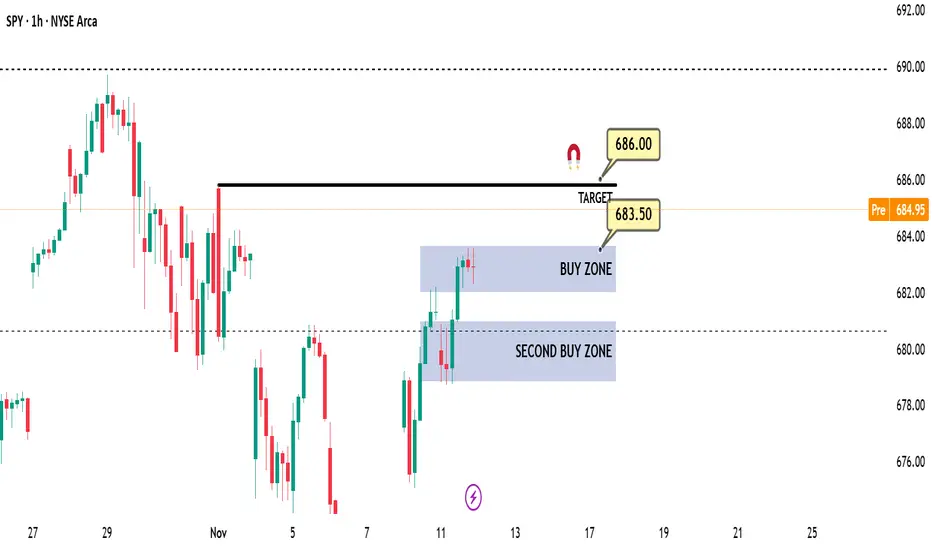
Daily SPY (US500) Outlook - Prediction (12 NOV)Daily SPY (US500) Outlook - Prediction (12 NOV)
📊 Market Sentiment
The market continues to lean bullish following the potential resolution of the U.S. government shutdown, along with the proposed $2,000 incentives for U.S. citizens. These developments could drive stronger inflows into equities and sustain short-term positive sentiment.
📈 Technical Analysis
Price moved higher overnight, likely targeting the 686 level, supported by strong momentum carried over from the Dow Jones (US30).
📌 Game Plan
In my opinion, I will look to buy if the price retraces to the 683.5–682 zone for a potential continuation move toward 686.
However, if we see a strong breakout below 682 and a 4H candle close beneath that level, I plan to exit my position. Another possible bounce could occur around 681, but confirmation would be required before entering such a trade.
💬For detailed insights and broader market context, please check my Substack link in profile.
⚠️ For educational purposes only. This is not financial advice.
a BuySide QuickScalp #GBPJPY 📌 Market Insight: {#GBPJPY }
⚠️ Risk Assessment: {High}
🚀 Approach:
Not a bad Structure , we need momentum first then a nice LTF entry sign .
#Ash_TheTrader #Forex #GBPJPY #MarketAnalysis #TradingSetup #RiskManagement #GOLD #Scalper #NQ #EURUSD

Daily SPY (US500) Outlook - Prediction (11 NOV)Daily SPY (US500) Outlook - Prediction (11 NOV)
📊 Market Sentiment
The market is turning bullish following the potential resolution of the U.S. government shutdown, along with the proposed $2,000 incentives for U.S. citizens. These factors could create strong inflows into equities and improve short-term sentiment.
📈 Technical Analysis
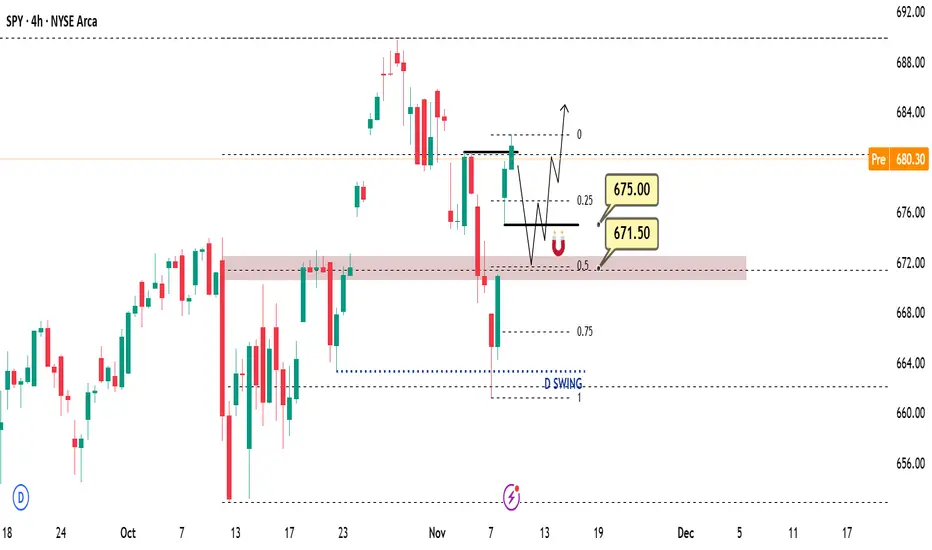
Price moved sharply higher on Monday, reaching the 681 level as expected (see my previous SPY outlook). The 681 level remains a strong resistance zone, and we have already seen a rejection from that area.
📌 Game Plan
In my opinion, the market may turn short-term bearish today. After rejecting 681, the price could target the 675 level and possibly though not necessarily reach 671.5.
My plan is to short the market toward 675 and observe if a bounce occurs. If it does, I will look to buy calls, expecting a move toward new highs around 685.
💬For detailed insights and broader market context, please check my Substack link in profile.
⚠️ For educational purposes only. This is not financial advice.
SPY (S&P 500 ETF) – Game PlanSPY (S&P 500 ETF) – Game Plan
📊 Market Sentiment
On October 29, the FED lowered rates by 25bps as expected. However, Powell’s remarks introduced uncertainty around further cuts in December, emphasizing that future policy will depend on incoming data.
One FED member dissented, preferring no cut this cycle — a notable shift from September’s unanimous decision.
Additionally, ADP Non-Farm Employment Change came at 42K versus 32K expected. It’s slightly higher, but since other macro data are missing due to the U.S. government shutdown, the overall sentiment remains unclear.
For now, sentiment leans bearish, as rate cuts may be delayed into 2026.
📈 Technical Analysis
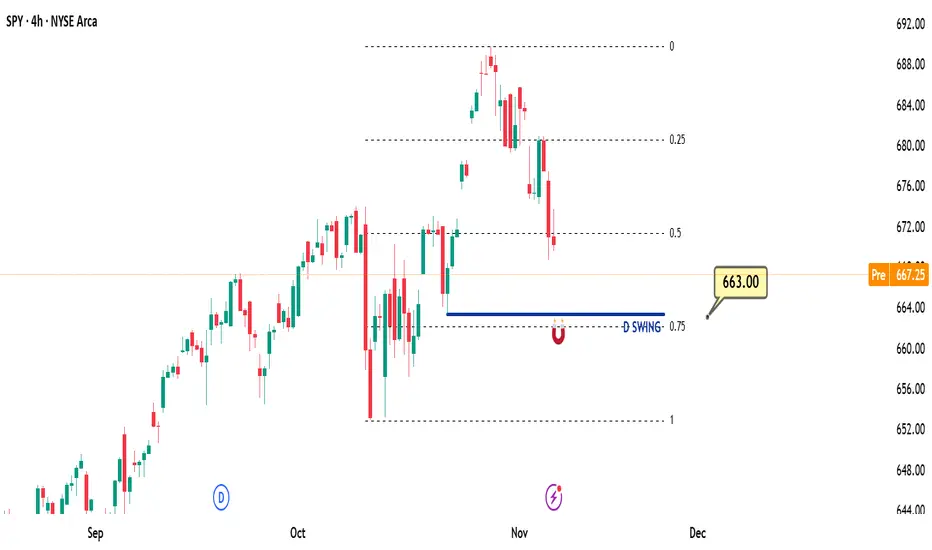
SPY recently touched the 670 level an important support zone representing the equilibrium of the current daily range and an area with significant liquidity.
However, with bearish macro sentiment, I don’t expect this level to hold for long. The structure suggests that price wants to seek lower liquidity zones.
📌 Game Plan / Expectations
My primary scenario is a short move targeting 663, which aligns with the 0.75 max discount zone. From there, a potential rally toward all-time highs could begin.
Scenario 2: If the 663 level fails to hold, I will look for another bounce opportunity near 657.
Overall, I don’t see this as a start of a bear market — rather a healthy correction within the broader bullish structure. I’ll be positioning for buys once the downside liquidity objectives are met.
💬 For deeper sentiment and strategy insights, subscribe to my Substack — free access available.
⚠️ Disclaimer
This analysis is for educational purposes only and does not constitute financial advice. Always conduct your own research before trading or investing.

Weekly QQQ (US100) Outlook - Prediction (09 NOV)Weekly QQQ Outlook - Prediction (09 NOV)
📊 Market Sentiment
Market sentiment remains slightly bearish as expectations for a December rate cut may be postponed into 2026. We have seen some sell-offs, likely due to hedging or profit-taking activity. However, the market experienced a healthy bounce last Friday, as anticipated in my previous Daily SPY Outlook on November 7.
Today, Trump announced that American citizens, excluding high-income individuals, will receive a $2,000 payment. This news could inject additional liquidity into risk assets, similar to what occurred during his first term. In my opinion, this development may create a short-term bullish narrative for the markets.
📈 Technical Analysis
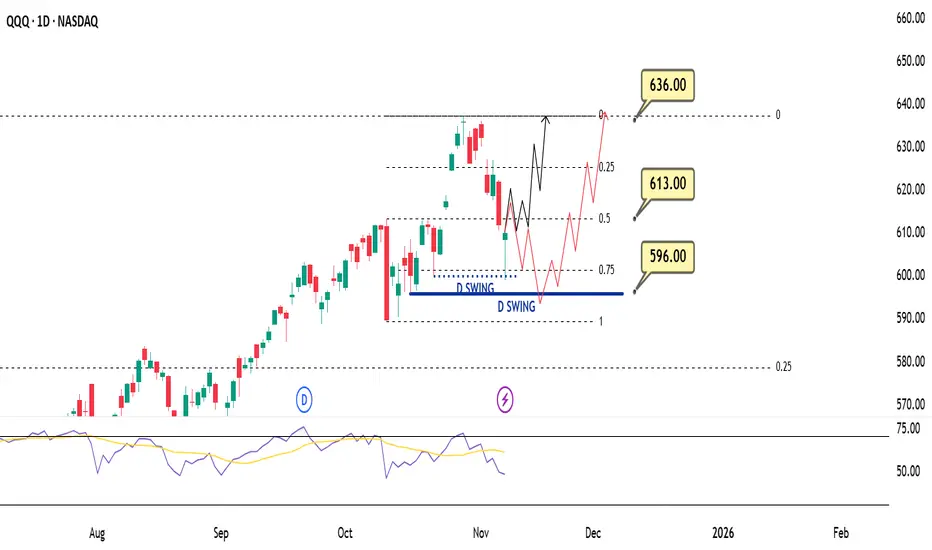
Price retraced throughout the week and reached the 600 level. The 601 zone represents the most discounted range (based on my quarterly range theory, 0.75 fib level), which I consider an optimal buy area. This level also aligns with daily swing liquidity, and the recent reaction suggests a potential move toward new all-time highs.
📌 Game Plan
I’m considering two possible scenarios for this week:
Scenario 1 (Black Line):
In my opinion, the price now has enough momentum to extend higher and create new all-time highs. Therefore, I’ll be watching for a daily close above the 613 level. If confirmed, I plan to buy QQQ calls targeting new highs.
Scenario 2 (Red Line):
If the price fails to close above 613, it may indicate that more accumulation is needed before another upward move. In that case, I’ll look to short (buy puts) toward the 596 level and observe whether we can bounce from there. Should that happen, I’ll then switch to calls and target higher prices.
💬For detailed insights and broader market context, please check my Substack link in profile.
⚠️ For educational purposes only. This is not financial advice.
Daily SPY (US500) Outlook - Prediction (10 NOV)📊 Market Sentiment
Market sentiment remains slightly bearish as expectations for a December rate cut may be postponed into 2026. We have seen some sell-offs, likely due to hedging or profit-taking activity. However, the market experienced a healthy bounce last Friday, as anticipated in my previous Daily SPY Outlook on November 7.
Trump announced that American citizens, excluding high-income individuals, will receive a $2,000 payment. This news could inject additional liquidity into risk assets, similar to what occurred during his first term. In my opinion, this may create a short-term bullish narrative for the markets.
📈 Technical Analysis
The ES market is showing strong pre-market inflows. I think the price may continue seeking higher levels, possibly targeting the 681 zone today.
📌 Game Plan
In my opinion, calls may perform well today. I plan to buy at the market open and take profits around the 681 level.
💬For detailed insights and broader market context, please check my Substack link in profile.
⚠️ For educational purposes only. This is not financial advice.

Daily SPY Outlook - Prediction (07 NOV)Daily SPY Outlook - Prediction (07 NOV)
📊 Market Sentiment
Market sentiment is slightly bearish as expectations for a December rate cut may be delayed into 2026. We have seen some sell-offs, likely due to hedging or profit-taking activity.
📈 Technical Analysis
Price is currently pulling back from the all-time high and moving within the equilibrium zone near the 670 level, which acts as short-term support. This is where I think accumulation may occur.
📌 Game Plan
In my opinion, price could reach the 663 level before showing a potential rebound. Therefore, I plan to stay short-biased toward 663, as puts might perform well today — unless I see a strong 4H candle close after the market open.
💬For detailed insights and broader market context, please check my Substack link in profile.
⚠️ Disclaimer: For educational purposes only. This is not financial advice.
Nasdaq reversa 6-11-25Sellers were absorbed in that area, and the Nasdaq will likely reverse from this point in the coming days.
If it breaks through the supply zone, the trend could turn bullish in the next few days.


QQQ Weekly Map 3–7 Nov 2025Context
QQQ finished the week near the highs after a steady October climb. Buyers keep absorbing every shallow pullback. This week sits on two hinges. First, jobs and services data that nudge yields and implied vol. Second, a small cluster of tech earnings that can rotate leadership inside semis and handsets. The plan is simple. Let the market prove strength above the record band or let it pull back into patient demand. You will trade the reaction, not the forecast.
Chart setup
Use a one hour chart. Add 20 and 50 EMAs, a daily VWAP with bands, and the previous week high and low. Keep plots at global scope and turn lookahead off. Display VIX on a small separate pane for bias only.
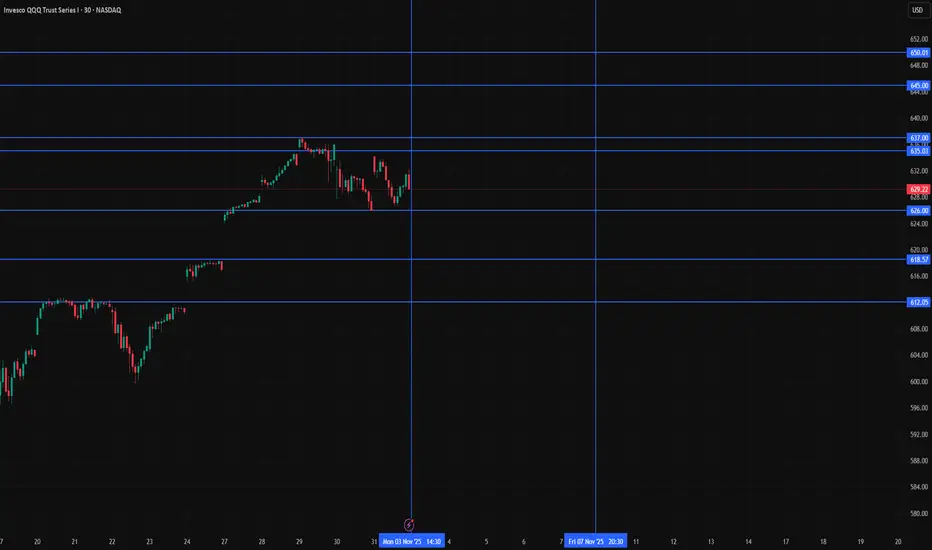
Levels that matter
• 637.01 is the record high and the top of the current band
• 635 to 637 is the breakout ridge where wicks happen first and real holds happen later
• 629 is the Friday close reference for gap work on Monday
• 626 is last week’s first shelf where buyers defended cleanly
• 620 is a round shelf with memory from October
• 612 is the mean reversion area that often aligns with short term moving averages
• 597 is the bigger trend check where the intermediate crew steps in
How to read the week
Imagine a door at 637. When price opens that door and stays inside the new room for a while, trend traders have permission. If price knocks and gets rejected, range traders take the other side. If price steps down into 620 to 612 while volatility stays tame, that is where you seek bounces with tight risk. Your confirms are simple. VIX under the upper teens is friendly. Yields not jumping is friendly. If either flips, you slow down.
Three rules only
• Rule 1. Momentum only above the ridge. If cash breaks and holds above 637 for at least thirty minutes, take a starter. First target 645, stretch 650. Invalidate on a clean loss and thirty minute close back inside 635.
• Rule 2. Buy the dip into 620 to 612 only if volatility stays calm. Enter in the 620 to 612 pocket when VIX stays below your upper guardrail. Manage a first target 620 to 626 and trail. Invalidate on a decisive thirty minute close under 609 to 610.
• Rule 3. Risk first below 597. If the week forces a daily close below 597, treat it as a trend health check. Reduce gross and net and wait for a reclaim before trying to be a hero.
Why this works
One instrument. One band at the highs. One pocket for mean reversion. You are not predicting the data. You are pricing the reaction at the lines the market already respects. Breakout failures happen and that is fine because your hold filter removes most traps. Dips fail too and that is fine because your volatility guardrail removes the worst ones.
Intraday guide
• Morning plan. If we gap up into the ridge, let the first thrust exhaust and demand the hold. If we gap down toward 626, let the opening range print and only act after the first pullback.
• Midday plan. If price is inside 629 to 635 around lunch, expect chop. Trades there are optional.
• Afternoon plan. If the day is trending, trail behind a five minute reclaim of your entry line.
Risk and heat
Set maximum portfolio heat per idea at one half of one percent. Scale entries in thirds. Respect your stop even when it feels unfair. A string of small scratches is the tuition for the one clean runner that pays for the week.
Earnings and calendar awareness
AMD and Qualcomm after the close on Tuesday and Wednesday can swing semis and handsets. Shopify and Airbnb bookend consumer tone. The first week of the month carries ADP, services PMIs, ISM services, and payrolls. Do not guess the print. Trade the reaction at the levels on your chart. If VIX jumps before data, size down and wait for the dust to settle.
Cross checks
• If the ten year sits near recent levels or drifts lower, multiples breathe and the 637 break has better odds
• If VIX pins below the upper teens, dips are easier to buy
• If one of these flips, you slow down and treat the day like a range
Reminder
Education and analytics only. No advice. No guarantees. Process beats prediction.
NQ Vision for the next daysWe swept 4h candles low. Shifted structure, I'm expecting the price to go into discount and to my enhanced OTE zone and reverse. If the price doesn't get accepted there and supply exceeds demand I expect further down movements.

$NDX Make or BreakNDX is consolidating in a triangle, and is now re-test 25200 strong level.
Inability to break above the triangle should see a break below the triangle and a move down to 24700 first.

Will the second scenario come true? |October 17 2025Based on the evidence, price action, and fundamental news, it seems the second scenario is about to play out.
The Nasdaq index turned positive after recovering its losses when Trump responded “No” to a question about whether he would maintain the heavy tariffs on China.
From today, my outlook is bullish until the previous high gets hunted — after that, I’ll reassess whether we’re likely to see further downside or if the bullish outlook should remain.
If market conditions shift and a continuation of the downtrend becomes more likely, we can take a solid short position next week to catch the move.
But for now, my bias is bullish, and the second scenario will likely play out.
If price reaches the second high I marked in blue, we’ll probably see a reaction from that zone.
If I open a trade, I’ll share it with you.

NQ Shorts IncomingYM approaching 4H imbalance, ES could sweep asian session high and play into previous OB while NQ sweeps london session liq and mitigates asian session OB

HOW to USE OB After Liq sweept on daily bais CME_MINI:MNQ1!
After we took PDL we Choch on 1H
and 5 min ob appear for more push

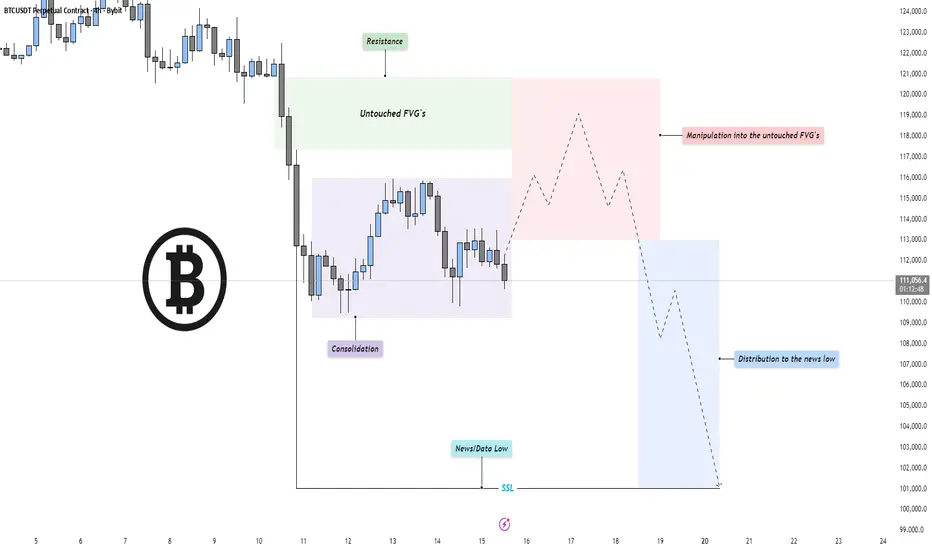
BTC - Perfect Power of 3 setup!Market Context
Bitcoin has entered a phase of compression after an extended bearish leg, with price currently consolidating near recent lows. The previous selloff created a clean structure of inefficiencies and untouched fair value gaps (FVGs) above, now acting as potential magnet zones for short-term retracements. The broader context remains bearish until those imbalances are efficiently mitigated.
Fair Value Gaps & Manipulation Zones
A clear pocket of untouched FVGs sits above the current range, aligning with resistance from prior breakdown points. Price could engineer a manipulation move into this zone, enticing late buyers before resuming the macro bearish direction. Such a move would serve as a liquidity grab and offer premium pricing for distribution before continuation lower.
Liquidity Dynamics
The market structure shows resting sell-side liquidity (SSL) below the recent “news/data low,” marked as a potential target for a deeper sweep. Once manipulation into the upper inefficiencies completes, the market could shift momentum to the downside, distributing into that liquidity and seeking new lows for rebalancing.
Final Thoughts
The current structure points toward a classic bearish continuation setup: consolidation, manipulation into premium inefficiencies, and a drive toward sell-side liquidity. Unless price breaks decisively above the untouched FVG chain, the expectation remains for a redistribution phase leading into the news low or beyond.
If this breakdown helped frame your bias, a like goes a long way — do you think price runs the FVG first, or dives straight into the liquidity below?