NAS100 Bullish Structure Break with Key Fibonacci Level in PlayThe NAS100 is now showing clear signs of strength, with a solid bullish move and a confirmed break of structure on the 4-hour timeframe 🚀. With this shift, the focus turns to how price behaves on the pullback.
The main level of interest is the 61.8% Fibonacci retracement of the current swing. A buy setup becomes valid only if price retraces and holds above the 61.8 level 🔥. Holding above this zone would indicate a shallow pullback — a strong sign that buyers are stepping in aggressively and maintaining control.
If price respects the 61.8 and then breaks structure to the upside again, that’s the confirmation needed to look for long opportunities 📊.
However, if price breaks below the 61.8 level, the idea is invalidated and should be abandoned. A deeper retracement may signal weakness, although it could also be a smart-money liquidity run before a continuation — either way, the priority is to see momentum hold above 61.8 to keep the bullish narrative intact ⚠️.
Not financial advice.
NASDAQ 100 E-MINI FUTURES

NASDAQ $NQ US100 Major Levels And PatternsNasdaq bounced yesterday heavily and completed a W pattern. I personally have been able to capture majority of this move. You can consider yesterday's W pattern a sort of double bottom which means hat more bullishness is expected in the medium term.
On a short term, now that it has completed a W pattern and reached previous important zone which had a gap, so we can expect a correction here but this may not be a big one. In a rare case there may not be any correction here at all because NASDAQ is forming a pattern which when forms usually ignores all the smaller W and M patterns.
For that reason my Bias is bullish and I will look for buying opportunities mostly.
There are certain Higher time frame levels that I am watching closely which you will find on the chart.
Trade what you see, manage the risk.
Follow for more. Please support this analysis by liking, commenting, and sharing with friends, colleagues, traders, and trading communities. Thanks👍🙂
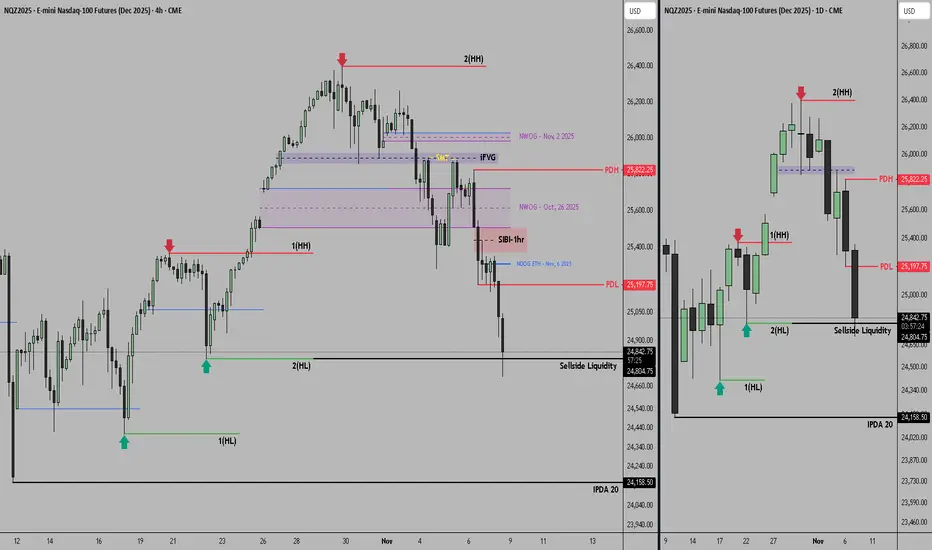
NAS100 Wednesday Reversal Potential from Key SupportOver the past several weeks, the NAS100 has shown a clear tendency for aggressive mid-week reversals, with Wednesdays repeatedly triggering sharp shifts in direction 🔄. This pattern suggests a strong time-based element in the algorithmic delivery of price, rather than random fluctuation.
🗓️ Each Wednesday has produced a notable reaction, whether through a liquidity grab, a stop run, or a full intraday reversal. With today being Wednesday once again, the timing aligns perfectly with the type of behaviour the market has been delivering consistently.
📉 The current decline has brought price directly into a well-defined high-timeframe support region. This area has a history of accumulation and typically holds a large amount of resting liquidity underneath it. The repeated wicks into this zone resemble classic Wyckoff spring behaviour 📦 — a sweep of sell-side liquidity followed by a potential response from larger players.
📐 The most recent bearish leg is noticeably overextended and has not offered a proper retracement since breaking lower. This leaves inefficiencies behind and increases the likelihood of a move back toward equilibrium.
🔄 Given the confluence of mid-week timing, the tap into higher-timeframe support, the liquidity sweep, and the extended nature of the current downswing, the expectation is for at least a corrective move back into equilibrium 📈.
A bullish break of short-term structure on the lower timeframes would strengthen this bias and open the door for a retracement into the premium levels listed above.
⚠️ Not financial advice. This is simply a technical outlook and my opinion.
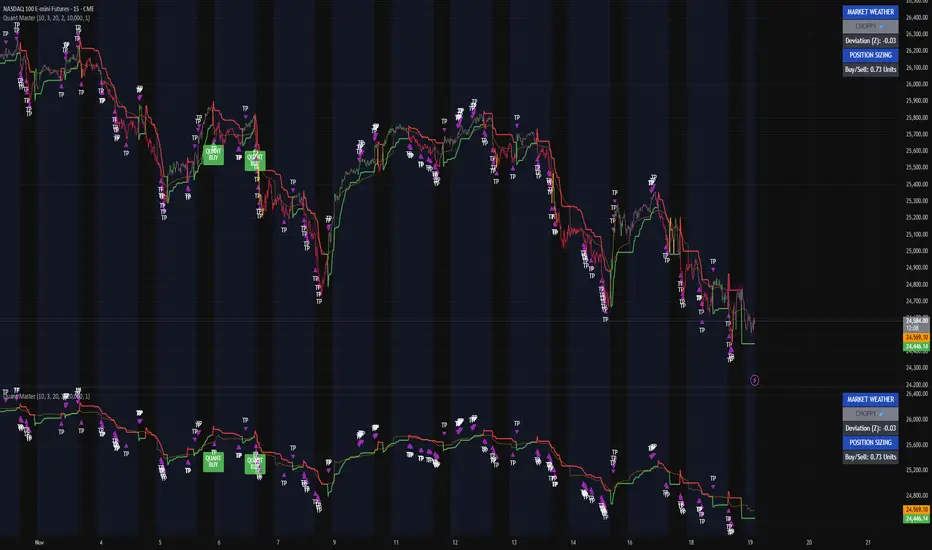
Why I'm NOT Buying the Dip on QQQ (Yet)Many traders are trying to catch a falling knife on the Nasdaq right now. Here is why my system says "Wait."
Looking at the Quant Master system on the 4H timeframe:
Trend is King: The candles are Red. This means Price is below the Volatility Stop and below the institutional VWAP anchor. There is no "Green Light" to buy yet.
Beware the "Black" Zones: If the candles turn Black, it means volatility has spiked or momentum has died (Chop). I do not trade in Black zones. I am waiting for clear Blue structure.
The Exit Was Clear: If you look at the top of the chart, the system printed multiple Purple Triangles. This signaled that the trend was exhausted relative to its statistical baseline. If you didn't take profit there, the market took it for you.
The Plan:
I am sitting on my hands until price closes ABOVE the VWAP (Orange Line) and the Stop Loss line turns Blue.
Trade what you see, not what you think.

Pure signal reading. Here’s how I’m reading NQ right now.I’m tracking NASDAQ 100 e-mini futures (NQ) on the 15-minute using my Quant Master Trend System — the same model I use to separate real directional pressure from intraday noise.
This entire chart is a perfect example of why most traders get chopped to death: they trade emotions, but I trade structure.
The ribbon is choppy, fragmented, and constantly flipping, which is exactly what I expect when Market Weather is labeled CHOPPY in the panel.
That mode tells me one thing:
Breakouts fail.
Breakdowns fail.
Momentum has no conviction.
When the system is in CHOPPY mode, every pullback looks like a setup, but it’s not — the model purposely suppresses continuation trades and fires more TP clusters because it’s detecting distribution, not trend.
You can see it clearly:
• Every time the ribbon tries to go green, it gets rejected within a handful of bars.
• Every red flip lacks strong downside extension — everything fizzles.
• Price oscillates around the volatility stop instead of respecting it.
• TP clusters fire rapidly — that’s your model’s “don’t trust this move” signature.
Even the Quant Buy signals tell the story.
They’re valid moves, but they’re short-lived, because the underlying pressure isn’t unified. That’s the entire point of this system: it’s telling you the environment, not just the direction.
The deviation reading is mild at Z ≈ -0.38, which means price isn’t stretched in either direction — the perfect recipe for messy intraday action.
So here’s how I’m interpreting this:
This is not a trending environment.
This is rotational flow, liquidity probing both sides, and no clean edge.
The ribbon’s behavior, the failed retests, the compression, and the constant TP firing confirm that NQ is stuck in a structure where continuation trades have the lowest probability.
Until Market Weather leaves CHOPPY and we get a clean ribbon alignment, I’m treating everything as low conviction and short-duration.
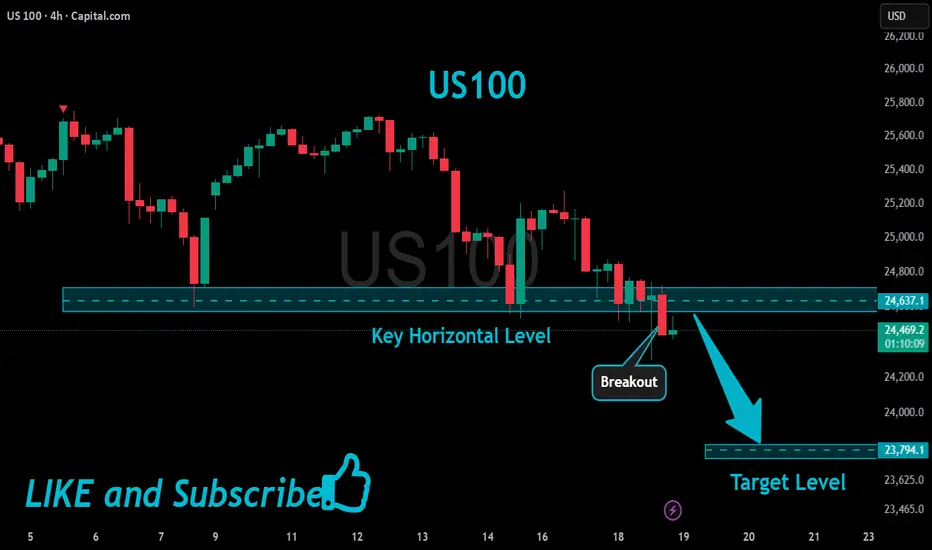
US100 Will Keep Falling!
HI,Traders !
#US100 keeps falling down
And made a strong
Bearish breakout of the key
Horizontal key level of 24637.1
And the breakout is confirmed
So we are bearish biased and
We will be expecting a further
Bearish move down !
Comment and subscribe to help us grow !
Nvidia (NVDA) Price Action Statistics Around EarningsWith Nvidia set to release earnings after the US close on Wednesday, I take a look at recent price action around past reports, the Nvidia chart and the Nasdaq.
Matt Simpson, Market Analyst at City Index.

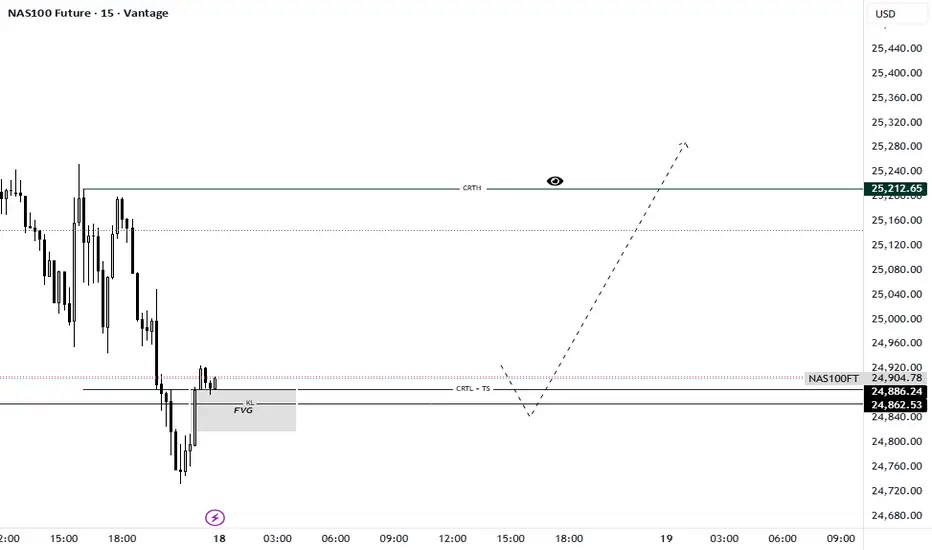
NAS100 Future: The Model #1 Bounce at CRTL SupportTimeframe: 15M | Model: CRT Model #1 / Turtle Soup Reversal
The Nasdaq Index is presenting a high-probability Candle Range Theory (CRT) setup after an aggressive drop. The price action perfectly encapsulates the Manipulation (Candle 2) phase and is setting up for the explosive Distribution (Candle 3) move.
The market has completed a textbook Turtle Soup (TS), aggressively pushing below the structural support to liquidate short-term positions. This hunt was contained by the confluence of the CRTL (Candle Range Theory Low) and a strong underlying Fair Value Gap (FVG).
Here’s the step-by-step breakdown (The CRT Checklist):
Liquidity Sweep: The deep wick confirms the Turtle Soup, clearing the stops below the previous support area around 24,862.53.
Confluence: The reversal attempt is happening right off the FVG area, giving high confidence to the long thesis, as outlined in the CRT Secrets Series (Episode 5: Key Levels).
The Trigger: We are now waiting for the final confirmation—the bullish Model #1 candle close. This candle must reverse the market structure and close decisively above the manipulation low (back into the range).
Targets:
Primary Objective (CRTH): The target is the CRTH (Candle Range Theory High) at 25,217.65, aiming to fill the liquidity above the initial range high.
Mindset: As the chart suggests, this reversal setup has the potential for a swift expansion move, seeking higher liquidity pools.
Discipline: Avoid the temptation to enter early. We must wait for the Model #1 candle to close and confirm the shift in control from sellers back to buyers. Trade what you see, not what you think!
Trade Smart. Trust the Candle Close.
Greetings,
MrYounity
NASDAQ Can the 1D MA50 give one more rally??Nasdaq (NDX) has been trading within a 6-month Channel Up and Friday saw the price breaking below its 1D MA50 (blue trend-line) and the pattern, but managed to close back above it for the 2nd time in a week (blue circles).
This resembles the September 02 break, which eventually also closed above it and initiated a +9.59% Bullish Leg. With the 1D RSI also testing a similar Support Zone with September's, we expect the index to initiate the new Bullish Leg, as long as it continues to close its daily candles above the 1D MA50.
Our Target is 26900 (+9.59%).
---
** Please LIKE 👍, FOLLOW ✅, SHARE 🙌 and COMMENT ✍ if you enjoy this idea! Also share your ideas and charts in the comments section below! This is best way to keep it relevant, support us, keep the content here free and allow the idea to reach as many people as possible. **
---
💸💸💸💸💸💸
👇 👇 👇 👇 👇 👇

NAS100 Trade Plan: Counter-Trend Opportunity Into Friday CloseI’m currently watching the NASDAQ NAS100 📊 and looking for a potential setup as we head into the Friday close. The market has pushed into the weekly low, and I’m anticipating the possibility of a retracement, which could offer a counter-trend opportunity during the New York session. 🚀📉📈 All details are broken down clearly in the video — this is not financial advice. ⚠️

Weekly outlook on NQ, ES and Dow. Index Triad NYSEThis week will be a tricky one. I need more data to understand about the expansion on the weekly. We will take it on a day to day basis after each daily closures

NASDAQ NAS100 Under Pressure – Watching for a Break of StructureThe NASDAQ is currently showing signs of weakness on the 4-hour chart. Sellers are gradually stepping in, and we can see US100 bearish momentum starting to take control. The market is under pressure, and price action is hinting at potential continuation to the downside.
I’ll be watching closely for a NAS100 break below the current range low — if price retests that level and fails to reclaim it, that would confirm a bearish market structure shift 🔻. Such a setup could provide a high-probability short opportunity as momentum accelerates to the downside.
⚠️ This is not financial advice — purely for educational and analytical purposes.

US100 – Consolidation Between FVGs, Watching for Bullish BreakouHello traders,
On the daily timeframe, NASDAQ (US100) is currently consolidating between a bullish and a bearish Fair Value Gap (FVG). Both sides present clear liquidity areas, and the market is preparing for its next directional move.
From my perspective, I’d like to see the price tap into the bullish FVG first, react from that zone, and then invalidate the bearish FVG on its way higher.
If this scenario plays out, the next targets would be the equal highs (EQH) and eventually a new all-time high (ATH).
However, if a daily candle closes below the bullish FVG, this idea becomes invalid and we could expect further downside movement.
For now, I remain bullish while the bullish FVG holds. 📈
💌It is my honor to share your comments with me💌
🔎 DYOR
💡Wait for the update!

NASDAQ 100 (NQ1!): Time To Buy This Dip? Oh Yeah!Welcome back to the Weekly Forex Forecast for the week of Nov. 10-14th.
In this video, we will analyze the following FX market: NASDAQ (NQ1!) NAS100
The NASDAQ pulled back after rallying for weeks! We patiently waited for a dip buying opportunity to form. Well, Friday might have given us the indication of an end to the pullback... and the opportunity to buy the dip may be upon us!
Wait for the shift in the market structure from bearish to bullish to form... then look for your
valid long setups.
Enjoy!
May profits be upon you.
Leave any questions or comments in the comment section.
I appreciate any feedback from my viewers!
Like and/or subscribe if you want more accurate analysis.
Thank you so much!
Disclaimer:
I do not provide personal investment advice and I am not a qualified licensed investment advisor.
All information found here, including any ideas, opinions, views, predictions, forecasts, commentaries, suggestions, expressed or implied herein, are for informational, entertainment or educational purposes only and should not be construed as personal investment advice. While the information provided is believed to be accurate, it may include errors or inaccuracies.
I will not and cannot be held liable for any actions you take as a result of anything you read here.
Conduct your own due diligence, or consult a licensed financial advisor or broker before making any and all investment decisions. Any investments, trades, speculations, or decisions made on the basis of any information found on this channel, expressed or implied herein, are committed at your own risk, financial or otherwise.

Will NAS100 Sustain Its Bullish Momentum After the Pullback?NAS100 🚀 Bullish Swing Setup | SuperTrend Pullback & Layered Entry Strategy
🎯 TRADE IDEA: NAS100 (US100) BULLISH SWING
Capitalize on a structured pullback in the NASDAQ 100! This plan leverages a proven indicator confluence for a high-probability long opportunity.
📊 ANALYSIS & CONFIRMATION:
Trend: Primary Bullish Trend is intact. ✅
Trigger: Price is pulling back into a demand zone, offering a favorable risk-to-reward entry.
Indicator: The SuperTrend ATR Line is acting as dynamic support on the 4H/Daily timeframe. A bounce from this level confirms our bullish bias.
⚡ STRATEGY: "THE THIEF" LAYERED ENTRY
This method uses multiple limit orders to average into a position, perfect for volatile markets like the NASDAQ.
Entry Zone: Look for entries between 25,200 - 25,600
Layer Example:
🟢 Limit Order 1: 25,600
🟢 Limit Order 2: 25,400
🟢 Limit Order 3: 25,200
👉 You can adjust the number of layers and prices based on your capital and risk appetite.
❗ RISK MANAGEMENT:
Stop Loss (SL): A decisive break below 24,800 would invalidate the bullish structure.
⚠️ IMPORTANT NOTE: This is MY protective stop. Dear Thief OG's 👑, you MUST adjust your position size and SL based on your personal risk management strategy. Protect your capital first!
🎯 PROFIT TARGETS:
Primary Target: 25,600 (Initial resistance & profit-taking zone).
Key Reasoning: We anticipate a reaction here due to:
Moving Average resistance.
Potential overbought conditions on lower timeframes.
A "trap" for late buyers.
👉 Smart Move: Consider taking partial profits at 25,600 and trailing your stop for the remainder. Escape the trap with your profits! 💰
⚠️ REMINDER: Dear Thief OG's 👑, your Take Profit (TP) is your own decision. Secure gains based on your trading plan and market behavior.
🔍 RELATED ASSETS & MARKET CORRELATION:
Watching these related instruments can provide confirmation and a broader market view.
TVC:DXY (U.S. Dollar Index): 🟡 NEGATIVE CORRELATION
A weakening Dollar ( TVC:DXY DOWN) is generally bullish for Nasdaq. If the Dollar is falling, it adds confidence to this long thesis.
USTECH (CFD on Nasdaq 100): 🟢 DIRECT CORRELATION
Moves in sync with NAS100. Perfect for cross-verifying price action and volume.
NASDAQ:AAPL , NASDAQ:MSFT , NASDAQ:TSLA (Mega-Caps): 🟢 HIGH IMPACT
These heavily weighted Nasdaq components drive the index. Bullish momentum in these stocks supports a rising NAS100.
FOREXCOM:SPX500 (S&P 500): 🟢 POSITIVE CORRELATION
A strong S&P 500 often lifts the Nasdaq. Monitor for overall U.S. market strength.
💬 Let me know your thoughts in the comments!
What's your entry strategy for the NAS100 this week?
#NAS100 #US100 #TradingView #SwingTrading #Bullish #SuperTrend #TradingStrategy #IndexTrading #LayeredEntry #ThiefStrategy

Nasdaq Potential for Further CorrectionThe NASDAQ index currently appears to be in a short-term correction, with the price likely to retest 25430 from 25570 before further movement.
- Above 25430–25575: Bullish continuation towards 25700 → 25820 → 25960.
- Below 25430: Bearish momentum is likely towards 25230 → 25010.
Market Focus on QQQ — Bullish Setup Taking Shape!🎯 QQQ ($INVESCO NASDAQ-100) Bullish Swing Trade Setup
The Layered Entry "Thief" Strategy | Profit Playbook 💰
📈 MARKET OUTLOOK
The QQQ (INVESCO QQQ TRUST) is positioned for a bullish swing trade setup. 🚀 This technical analysis focuses on strategic multi-layer entry execution with defined risk/reward parameters suitable for intermediate swing traders.
🎪 ENTRY STRATEGY: "LAYERED THIEF" METHOD
This isn't your typical entry—we're using smart limit order layering 🎯 to accumulate positions at key support zones. Think of it as a professional scale-in approach!
📍 Limit Order Entry Layers:
Layer 1: $605.00 ⭐
Layer 2: $610.00 ⭐
Layer 3: $615.00 ⭐
Layer 4: $620.00 ⭐
💡 Pro Tip: Feel free to add additional layers ($625, $630, etc.) based on your risk tolerance and account size. The thief's advantage is patience and positioning!
Entry Triggers: Volume confirmation + Support zone bounce + Institutional accumulation signals 📊
🛑 STOP LOSS (Risk Management)
⚠️ THIEF SL: $590.00
📢 DISCLAIMER: This stop loss is a suggestion only. You are responsible for setting your own risk parameters based on your trading capital, risk tolerance, and market conditions. Trade at your own risk! 🎲
🎊 PROFIT TARGETS (Exit Strategy)
PRIMARY TARGET: $650.00 ✅
SECONDARY RESISTANCE: $660.00 ⚠️
Note: The $660 zone presents strong technical resistance combined with overbought conditions and potential reversal traps. We recommend taking profits at $650 and letting a small portion run if momentum confirms. Smart money moves!
📢 DISCLAIMER: Target levels are suggestions based on technical analysis. Your profit-taking strategy should align with your personal risk/reward ratio. Final exit decisions rest with you! 🎯
🔗 CORRELATED PAIRS TO MONITOR
Keep an eye on these related assets for confirmation signals:
🔴 QQQ Constituents & Index Correlation:
NASDAQ:AAPL (Apple Inc.) — Tech sector heavyweight; if AAPL breaks support, QQQ may follow 📱
NASDAQ:MSFT (Microsoft Corp.) — AI & cloud leader; typically leads QQQ moves upward 🤖
NASDAQ:NVDA (NVIDIA Corp.) — Semiconductor bellwether; massive correlation to tech rallies 💻
NASDAQ:TSLA (Tesla Inc.) — Growth driver; watch for momentum continuation signals ⚡
NASDAQ:GOOGL (Alphabet Inc.) — Large-cap tech anchor; supports QQQ uptrend confirmation 🔍
📊 Macro-Level Pairs:
NASDAQ:NDX (NASDAQ-100 Index) — Direct parent index; should mirror QQQ closely 📈
AMEX:SPY (S&P 500 ETF) — Broader market health check; risk-on environment confirmation ⭐
AMEX:IWM (Russell 2000 Small-Cap) — Risk sentiment gauge; divergence = caution ⚠️
TVC:DXY (US Dollar Index) — Inverse correlation; strong dollar = headwind for tech 💵
Key Correlation Points: Watch for tech sector strength continuation and macro risk-on sentiment. If NDX confirms, QQQ breakout is highly probable! 🚀
💡 STRATEGY BREAKDOWN
✅ Bullish Bias with patience-based accumulation
✅ Defined Risk at the $590 level
✅ Layered Entry for optimal position sizing
✅ Technical Confluence at resistance zones
✅ Risk/Reward Potential = Approx 1:2.5 ratio
🎓 TECHNICAL VALIDATION CHECKLIST
✅ Support zone identification at $605-620 range
✅ Volume analysis at entry levels
✅ RSI divergence confirmation
✅ Moving average alignment (200 SMA positioning)
✅ Institutional order flow patterns
✅ Market structure (Higher Highs/Higher Lows)
✨ If you find value in my analysis, a 👍 and 🚀 boost is much appreciated — it helps me share more setups with the community!
#QQQ #SwingTrade #TechETF #NASDAQ100 #TradingStrategy #ThiefStrategy #LayeredEntry #ProfitPlaybook #Bullish #TechnicalAnalysis #ETFTrading #RiskManagement #ActiveTrading

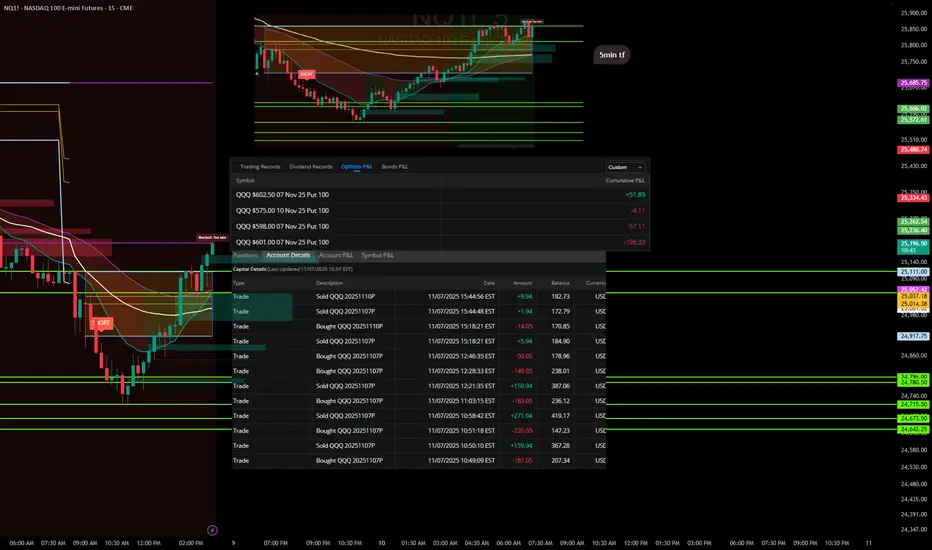
Trades with B – Daily Recap (Nov 10 2025)Ticker: QQQ / NQ1!
Strategy: ORB Pro with Filters + 5 min / 15 min Multi-Timeframe Confluence
Result: Green day ✅ (+$97.78 total gain)
🧭 Market Context
The market opened inside an early consolidation range with mixed momentum. The 5-minute chart gave the first confirmation through a clean ORB signal rejection, while the 15-minute held the higher-timeframe structure and kept the EMA slope intact.
The plan today was simple — trade the first valid signal from ORB Pro, confirm with the higher timeframe trend, and respect stops.
🎯 Trade Execution Recap
9:37 AM: First Call entry (ORB signal + fib retest) — caught the initial push before stall. + $172.94
9:44 AM: Locked profits on strength into EMA resistance.
11:14 AM: Put entry after ORB Pro signaled a short on the 5 min matching 15 min trend.
11:40 AM: Exit for + $194.94 after momentum follow-through.
Cumulative Options P/L:
QQQ $618 Put (11/10/25) → + $67.89
QQQ $621 Call (11/10/25) → + $29.89
Net: + $97.78
💡 What Went Right
Followed the ORB signal with confirmation from the higher-timeframe trend filter.
Perfect execution on the Put trade — clean entry and timely exit.
Didn’t overstay the welcome once the move completed.
⚠️ What to Improve
Stay patient for stronger confluence before taking early entries.
Avoid re-entries once price returns to mid-range (less edge after initial break).
🧘♂️ Reflection
“The 5 min showed me the trigger, the 15 min confirmed the story. ORB Pro did its job — I just had to listen.”

NASDAQ Excellent rebound on the 1D MA50. Bullish.Nasdaq (NDX) has been trading within a 6-month Channel Up and last Friday made another 1D MA50 (blue trend-line) test exactly at the bottom (Higher Lows trend-line) of the pattern, and rebounded.
This has market the last two bottoms of the Channel Up and kickstarted the Bullish Legs, which have both been at +9.59%. As you realize, this it technically the pattern's strongest Support and most optimal buy entry for the medium-term.
We expect at least another +9.59% rally on the emerging Bullish Leg, targeting 26950.
-------------------------------------------------------------------------------
** Please LIKE 👍, FOLLOW ✅, SHARE 🙌 and COMMENT ✍ if you enjoy this idea! Also share your ideas and charts in the comments section below! This is best way to keep it relevant, support us, keep the content here free and allow the idea to reach as many people as possible. **
-------------------------------------------------------------------------------
💸💸💸💸💸💸
👇 👇 👇 👇 👇 👇

META Pullback or Power Move? Technical Structure Decides🎯 META PLATFORMS INC. (NASDAQ) | THE THIEF'S PROFIT PLAYBOOK 💰
Bullish Swing Trade Setup | Supertrend + Triangular Moving Average Pullback
📊 SETUP OVERVIEW
This analysis presents a disciplined swing trading strategy on META (NASDAQ: Meta Platforms Inc.) leveraging proven technical indicators combined with strategic entry layering methodology.
Current Market Context: 🔍
Current Price: ~$625.24 (as of Nov 9, 2025)
RSI Status: Oversold Territory (<30) ⚠️
52-Week High: $796.25 | 52-Week Low: $479.80
Analyst Target: $824.02 (+32.54% potential upside) 📈
Sentiment: 44 Analysts = "Strong Buy" Rating ✅
🎬 ENTRY STRATEGY: THE LAYERING APPROACH
Rather than risking a single entry, this "Thief" methodology utilizes multiple limit order layers for optimal risk-adjusted position building:
Primary Entry Layers (Building Position Gradually):
Layer 1️⃣: $590 | Entry volume allocation: 25%
Layer 2️⃣: $600 | Entry volume allocation: 25%
Layer 3️⃣: $620 | Entry volume allocation: 25%
Layer 4️⃣: $630 | Entry volume allocation: 15%
Layer 5️⃣: $640 | Entry volume allocation: 10%
💡 Strategy Rationale: Layering captures value through market dips while maintaining capital preservation. Adjust layer counts/prices based on your risk tolerance and account size.
🛑 RISK MANAGEMENT
Stop Loss Level: $560 🛑
Represents approximately -10.4% from current price
Protects against breakdown of support structure
Triggered if key technical support fails
⚡ IMPORTANT DISCLAIMER: Stop loss placement is a personal decision based on your risk appetite. The 560 level is suggested only—manage YOUR risk YOUR way.
🎁 PROFIT TARGET
Primary Target: $730 🚀
Represents +16.8% upside potential from current levels
Aligns with resistance confluence + technical overbought signals
Incorporates trap avoidance in highly contested resistance zones
🎯 Exit Strategy Note: Take profits strategically as price approaches target. Don't get greedy—serious resistance + market structure at these levels. The $730 zone is crowded; exit positions intelligently.
⚡ DISCLAIMER: Target selection is your own. Book profits when comfortable—risk management requires personal decision-making, not blind following.
🔗 RELATED PAIRS TO WATCH (TECH SECTOR CORRELATION)
Monitor these correlated assets for confirmation signals:
📱 NASDAQ:GOOGL (Alphabet Inc.) - Tech sector bellwether; typically leads META moves in AI narrative
Correlation: Strong positive | If GOOGL struggles, META upside may be capped
Watch: Positive correlation breakouts suggest sector momentum
💻 NASDAQ:NVDA (NVIDIA Corp.) - AI chip leader; META's infrastructure partner
Correlation: Strong positive | NVDA strength = confidence in AI capex spending
Watch: NVDA drops could signal META weakness despite fundamentals
🤖 NASDAQ:MSFT (Microsoft Corp.) - Competing AI ecosystem player
Correlation: Moderate positive | Sector rotation indicator
Watch: MSFT outperformance = potential META underperformance
📊 NASDAQ:QQQ (Nasdaq-100 ETF) - Tech sector aggregate
Correlation: Very strong | META weighted ~4.7% in QQQ
Watch: If QQQ breaks down, META faces headwinds regardless of company-specific factors
🌐 NASDAQ:SMH (Semiconductors ETF) - Supply chain health indicator
Correlation: Moderate positive | AI infrastructure demand gauge
Watch: SMH weakness signals potential capex disappointment
📈 TECHNICAL ANALYSIS FRAMEWORK
✅ Supertrend Confirmation: Bullish alignment detected—uptrend structure intact
✅ Triangular Moving Average (TMA) Pullback: Price respecting key moving average zones, setting up continuation
✅ Oversold RSI: Current market conditions suggest reversal potential
✅ Support Structure: $560 level acts as psychological + technical floor
🎓 WHY THIS SETUP WORKS
Entry Discipline: Layering reduces emotional decision-making; mechanical execution improves psychology
Risk Control: Multiple entries allow tighter overall stop losses while maintaining position exposure
Technical Confirmation: Supertrend + TMA alignment = higher probability setups
Sector Tailwinds: META's $600B AI investment announcement provides fundamental support
Oversold Bounce Potential: RSI <30 historically precedes relief rallies in strong companies
⚠️ RISK FACTORS & CONSIDERATIONS
🔴 Key Risks:
Meta's aggressive capex spending concerns some investors—watch for guidance revisions
Regulatory pressure on AI/advertising practices could derail momentum
Macro headwinds (interest rates, economic data) always threaten growth narratives
Market structure at $730 is HEAVY—resistance may be tougher than expected
Position sizing matters: don't over-leverage this trade
💼 Trade Management Checkpoints:
Scale in via layering rather than going all-in
Monitor daily closes near stop loss; don't let winners turn into losers
Consider taking partial profits as price approaches resistance zones
Watch related pairs ( NASDAQ:QQQ , NASDAQ:NVDA ) for confirmation/divergence
💡 PRO TIPS FOR THIEF TRADERS
🔓 Lock in Partial Gains: At $670 level, consider closing 40% of position to secure profits
🔓 Trail Your Stop: Once price establishes above $650, move stop to breakeven to protect capital
🔓 Watch Earnings Calendar: Next catalyst could accelerate move—prepare position accordingly
🔓 Timeframe Matters: This is swing trade—target 2-4 week holding period
🔓 Keep Thesis Tight: Market conditions change—be prepared to exit if setup breaks
📌 FINAL NOTES
This analysis is provided for educational & entertainment purposes only. ✨
Every trader must make independent decisions regarding position sizing, entry levels, exit targets, and risk management. What works for one trader's account may not work for another. Test strategies on smaller positions first; respect your stops; manage your risk.
Remember: The best trade isn't always the one that makes the most money—it's the one that lets you live to trade another day.
📢 SUPPORT THE ANALYSIS
✨ If you find value in this analysis, a 👍 and 🚀 boost is much appreciated — it helps me share more setups with the community!

Trades with B – Daily Recap (Nov 7, 2025) "Lesson Learned"Ticker: QQQ / NQ1!
Strategy: ORB Pro + Fib Confluence + EMA Trend Filters
Result: Small red day – self-inflicted
🧭 Market Context
Today’s price action gave a clear short opportunity during the mid-morning fade, but momentum stalled mid-session. The first entries lined up beautifully with the ORB breakdown and EMA confluence, offering solid profits early on.
Where it fell apart was after the first wins — I overstayed, chasing secondary flushes that never came. The market started to base, and I kept expecting continuation instead of taking what the chart gave me.
📉 Trade Summary
Multiple put entries between $601–$602 levels
Early trades locked quick gains (+$271.94, +$159.94)
Gave back a chunk re-entering late into chop
Final P/L across contracts: -$205.66 total
Cumulative Options P/L breakdown:
QQQ $602.50 07 Nov 25 Put – +$51.89
QQQ $575 10 Nov 25 Put – -$4.11
QQQ $598 07 Nov 25 Put – -$57.11
QQQ $601 07 Nov 25 Put – -$196.33
💡 Lessons & Takeaways
The first clean move is often the best move. Don’t overcomplicate a confirmed win.
Late-day trades = low probability. Volume dries up, conviction fades.
Protect the capital, not the ego. There’s no “making up” missed points — only protecting what’s already earned.
🧘♂️ Reflection
“The setup worked, but I didn’t. I tried to extract more from a move that was already complete. Next time, once my target hits, I’m walking away.”
Nasdaq - The most important structure!💰Nasdaq ( TVC:NDQ ) perfectly respects structure:
🔎Analysis summary:
Over the course of the past couple of months, the Nasdaq has been rallying an expected +50%. Still, until the Nasdaq will retest the upper channel resistance trendline, this rally won't be over. Therefore, we can still see a rally of another +10% in the very near future.
📝Levels to watch:
$25,000 and $30,000
SwingTraderPhil
SwingTrading.Simplified. | Investing.Simplified. | #LONGTERMVISION

$NQ this week price action as per ICTSEED_ALEXDRAYM_SHORTINTEREST2:NQ this week price action as per ICT
-HTF MMSM (Market maker sell model)