NAS100 Trade Opportunity: Will Buyers Defend the Pullback?📊 NAS100 (NASDAQ-100) Swing Trade Opportunity 🚀
Bullish Pullback Setup | Super Trend ATR + TMA Confirmation
🎯 TRADE SETUP OVERVIEW
Instrument: NAS100 (NASDAQ-100 Index)
Timeframe: Swing Trade (4H-Daily)
Bias: BULLISH ✅
Setup Type: Super Trend ATR Line Pullback + Triangular Moving Average (TMA) Confirmation
🎬 ENTRY STRATEGY - "LAYERING METHOD" 📍
This strategy employs multiple limit order placement (Layer Entry Technique) to optimize entry points during the pullback phase.
Recommended Layer Entry Points:
🔵 Layer 1: 24,500
🔵 Layer 2: 24,600
🔵 Layer 3: 24,700
🔵 Layer 4: 24,800
⚡ Pro Tip: Scale layers based on your account size and risk tolerance. Each layer reduces average entry price.
🛑 STOP LOSS (SL)
Primary SL Level: 24,300
Strategy: Placed below the latest swing low + Super Trend confirmation
⚠️ DISCLAIMER: This SL is a guideline only. You must adjust based on your personal risk management strategy and account equity. Risk is YOUR responsibility.
🎁 PROFIT TARGETS (TP)
PRIMARY TARGET (TP1): 25,700 🎯
First resistance zone
Ideal for taking partial profits
Recommended exit: 30-50% position
SECONDARY TARGET (TP2): 26,200 🔥
Strong resistance + Historical overbought zone
⚠️ TRAP ALERT: Expect potential reversal or consolidation
Recommended exit: Remaining 50-70% position
Use trailing stop for final portion
📈 TECHNICAL CONFIRMATION
✅ Super Trend ATR: Aligned bullish
✅ TMA (Triangular MA): Pullback to key level confirmed
✅ Higher Lows Pattern: Intact
✅ Volume Analysis: Supporting move
🔗 RELATED PAIRS TO WATCH 💡
Positive Correlation (Move Together):
🔴 SPY (S&P 500 ETF) - $380-395 Range
Correlation: +0.92 | Often leads NAS100 lower-cap stocks
Key Point: If SPY breaks $390, expect NAS100 momentum confirmation
Watch for divergence signals
🔴 QQQ (Invesco QQQ Trust - Nasdaq 100 ETF) - $450-470 Range
Correlation: +0.99 | DIRECT tracking of NAS100
Key Point: Primary barometer for Nasdaq sentiment
Use for volume + volatility confirmation
🔴 TECH Sector ETF (XLK) - $205-215 Range
Correlation: +0.88 | Tech-heavy holdings overlap
Key Point: Tech rotation affects Nasdaq flow
Monitor for sector strength/weakness
Inverse Correlation (Move Opposite):
🔵 DXY (US Dollar Index) - $103-106 Range
Correlation: -0.65 | Stronger dollar = Risk-off mood
Key Point: If DXY spikes, expect NAS100 pullback extension
Monitor Fed rate expectations
🔵 TLT (20+ Year Treasury ETF) - $75-80 Range
Correlation: -0.58 | Rising yields hurt growth stocks
Key Point: Check 10Y yield trend for rate pressure
Watch Fed policy announcements
Key Monitoring Points:
📌 Earnings Season Impact: Tech earnings can create ±2% moves
📌 Fed Minutes/Announcements: Watch for rate guidance changes
📌 Market Breadth: Compare Advance/Decline lines for confirmation
📌 Volatility Index (VIX): Levels above 20 = Caution; Below 15 = Risk-on
📋 BEFORE YOU TRADE - CHECKLIST ✅
Is price currently at/near Layer 1 entry (24,500)?
Does current 4H chart show TMA pullback + Super Trend confluence?
Is volume confirming the setup?
Have you set your SL below 24,300?
Do you understand you're risking X to make Y?
Is this aligned with your trading plan?
🎓 FINAL NOTES
This is a mechanical swing trade setup designed for traders who use limit orders and layering technique. The confluence of Super Trend ATR + TMA creates higher probability entries during bullish pullbacks.
Remember: Trading involves substantial risk of loss. This idea is shared for educational analysis. Your trading decisions are YOUR responsibility alone.
Happy Trading! 🚀💎
NASDAQ 100 E-MINI FUTURES

Market Focus on QQQ — Bullish Setup Taking Shape!🎯 QQQ ($INVESCO NASDAQ-100) Bullish Swing Trade Setup
The Layered Entry "Thief" Strategy | Profit Playbook 💰
📈 MARKET OUTLOOK
The QQQ (INVESCO QQQ TRUST) is positioned for a bullish swing trade setup. 🚀 This technical analysis focuses on strategic multi-layer entry execution with defined risk/reward parameters suitable for intermediate swing traders.
🎪 ENTRY STRATEGY: "LAYERED THIEF" METHOD
This isn't your typical entry—we're using smart limit order layering 🎯 to accumulate positions at key support zones. Think of it as a professional scale-in approach!
📍 Limit Order Entry Layers:
Layer 1: $605.00 ⭐
Layer 2: $610.00 ⭐
Layer 3: $615.00 ⭐
Layer 4: $620.00 ⭐
💡 Pro Tip: Feel free to add additional layers ($625, $630, etc.) based on your risk tolerance and account size. The thief's advantage is patience and positioning!
Entry Triggers: Volume confirmation + Support zone bounce + Institutional accumulation signals 📊
🛑 STOP LOSS (Risk Management)
⚠️ THIEF SL: $590.00
📢 DISCLAIMER: This stop loss is a suggestion only. You are responsible for setting your own risk parameters based on your trading capital, risk tolerance, and market conditions. Trade at your own risk! 🎲
🎊 PROFIT TARGETS (Exit Strategy)
PRIMARY TARGET: $650.00 ✅
SECONDARY RESISTANCE: $660.00 ⚠️
Note: The $660 zone presents strong technical resistance combined with overbought conditions and potential reversal traps. We recommend taking profits at $650 and letting a small portion run if momentum confirms. Smart money moves!
📢 DISCLAIMER: Target levels are suggestions based on technical analysis. Your profit-taking strategy should align with your personal risk/reward ratio. Final exit decisions rest with you! 🎯
🔗 CORRELATED PAIRS TO MONITOR
Keep an eye on these related assets for confirmation signals:
🔴 QQQ Constituents & Index Correlation:
NASDAQ:AAPL (Apple Inc.) — Tech sector heavyweight; if AAPL breaks support, QQQ may follow 📱
NASDAQ:MSFT (Microsoft Corp.) — AI & cloud leader; typically leads QQQ moves upward 🤖
NASDAQ:NVDA (NVIDIA Corp.) — Semiconductor bellwether; massive correlation to tech rallies 💻
NASDAQ:TSLA (Tesla Inc.) — Growth driver; watch for momentum continuation signals ⚡
NASDAQ:GOOGL (Alphabet Inc.) — Large-cap tech anchor; supports QQQ uptrend confirmation 🔍
📊 Macro-Level Pairs:
NASDAQ:NDX (NASDAQ-100 Index) — Direct parent index; should mirror QQQ closely 📈
AMEX:SPY (S&P 500 ETF) — Broader market health check; risk-on environment confirmation ⭐
AMEX:IWM (Russell 2000 Small-Cap) — Risk sentiment gauge; divergence = caution ⚠️
TVC:DXY (US Dollar Index) — Inverse correlation; strong dollar = headwind for tech 💵
Key Correlation Points: Watch for tech sector strength continuation and macro risk-on sentiment. If NDX confirms, QQQ breakout is highly probable! 🚀
💡 STRATEGY BREAKDOWN
✅ Bullish Bias with patience-based accumulation
✅ Defined Risk at the $590 level
✅ Layered Entry for optimal position sizing
✅ Technical Confluence at resistance zones
✅ Risk/Reward Potential = Approx 1:2.5 ratio
🎓 TECHNICAL VALIDATION CHECKLIST
✅ Support zone identification at $605-620 range
✅ Volume analysis at entry levels
✅ RSI divergence confirmation
✅ Moving average alignment (200 SMA positioning)
✅ Institutional order flow patterns
✅ Market structure (Higher Highs/Higher Lows)
✨ If you find value in my analysis, a 👍 and 🚀 boost is much appreciated — it helps me share more setups with the community!
#QQQ #SwingTrade #TechETF #NASDAQ100 #TradingStrategy #ThiefStrategy #LayeredEntry #ProfitPlaybook #Bullish #TechnicalAnalysis #ETFTrading #RiskManagement #ActiveTrading

Will NAS100 Sustain Its Bullish Momentum After the Pullback?NAS100 🚀 Bullish Swing Setup | SuperTrend Pullback & Layered Entry Strategy
🎯 TRADE IDEA: NAS100 (US100) BULLISH SWING
Capitalize on a structured pullback in the NASDAQ 100! This plan leverages a proven indicator confluence for a high-probability long opportunity.
📊 ANALYSIS & CONFIRMATION:
Trend: Primary Bullish Trend is intact. ✅
Trigger: Price is pulling back into a demand zone, offering a favorable risk-to-reward entry.
Indicator: The SuperTrend ATR Line is acting as dynamic support on the 4H/Daily timeframe. A bounce from this level confirms our bullish bias.
⚡ STRATEGY: "THE THIEF" LAYERED ENTRY
This method uses multiple limit orders to average into a position, perfect for volatile markets like the NASDAQ.
Entry Zone: Look for entries between 25,200 - 25,600
Layer Example:
🟢 Limit Order 1: 25,600
🟢 Limit Order 2: 25,400
🟢 Limit Order 3: 25,200
👉 You can adjust the number of layers and prices based on your capital and risk appetite.
❗ RISK MANAGEMENT:
Stop Loss (SL): A decisive break below 24,800 would invalidate the bullish structure.
⚠️ IMPORTANT NOTE: This is MY protective stop. Dear Thief OG's 👑, you MUST adjust your position size and SL based on your personal risk management strategy. Protect your capital first!
🎯 PROFIT TARGETS:
Primary Target: 25,600 (Initial resistance & profit-taking zone).
Key Reasoning: We anticipate a reaction here due to:
Moving Average resistance.
Potential overbought conditions on lower timeframes.
A "trap" for late buyers.
👉 Smart Move: Consider taking partial profits at 25,600 and trailing your stop for the remainder. Escape the trap with your profits! 💰
⚠️ REMINDER: Dear Thief OG's 👑, your Take Profit (TP) is your own decision. Secure gains based on your trading plan and market behavior.
🔍 RELATED ASSETS & MARKET CORRELATION:
Watching these related instruments can provide confirmation and a broader market view.
TVC:DXY (U.S. Dollar Index): 🟡 NEGATIVE CORRELATION
A weakening Dollar ( TVC:DXY DOWN) is generally bullish for Nasdaq. If the Dollar is falling, it adds confidence to this long thesis.
USTECH (CFD on Nasdaq 100): 🟢 DIRECT CORRELATION
Moves in sync with NAS100. Perfect for cross-verifying price action and volume.
NASDAQ:AAPL , NASDAQ:MSFT , NASDAQ:TSLA (Mega-Caps): 🟢 HIGH IMPACT
These heavily weighted Nasdaq components drive the index. Bullish momentum in these stocks supports a rising NAS100.
FOREXCOM:SPX500 (S&P 500): 🟢 POSITIVE CORRELATION
A strong S&P 500 often lifts the Nasdaq. Monitor for overall U.S. market strength.
💬 Let me know your thoughts in the comments!
What's your entry strategy for the NAS100 this week?
#NAS100 #US100 #TradingView #SwingTrading #Bullish #SuperTrend #TradingStrategy #IndexTrading #LayeredEntry #ThiefStrategy

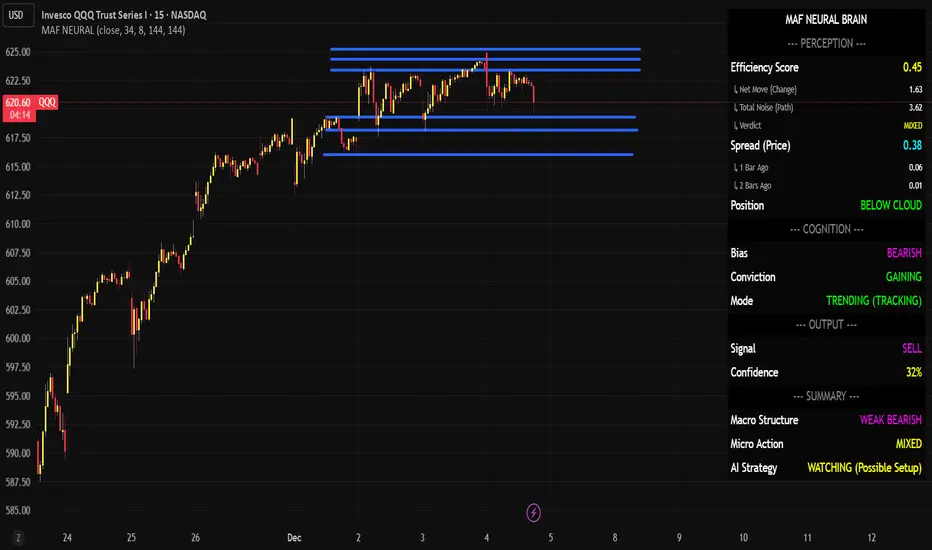
QQQ Neural Brain Analyzing Price Action — Watch ModeCurrent Status: The system is tracking a potential bearish setup, but conditions are not yet aligned for a high-probability entry. The signal is "SELL," but with low confidence (39%), suggesting caution.
1. Perception (The Data)
Efficiency Score: 0.59 (Mixed)
The market is moving with moderate efficiency. It is not purely "choppy" (which would be <0.30), but it isn't a clean, strong trend yet either.
Spread (Price): 0.44
Volatility is somewhat compressed.
Position: BELOW CLOUD
Price is trading below the key resistance cloud, which is a bearish technical characteristic.
2. Cognition (The Trend)
Bias: BEARISH
The underlying trend direction is down.
Conviction: GAINING
Despite the mixed price action, the algorithm's internal belief in the bearish bias is strengthening.
Mode: TRENDING (TRACKING)
The system is in "Tracking" mode, meaning it is following the price action closely rather than filtering it out as noise.
3. Output (The Signal)
Signal: SELL
Confidence: 39% (Low)
CRITICAL NOTE: While the directional signal is valid (Sell), the confidence is below the typical threshold for aggressive entry (usually 70%+). This indicates a higher risk of a false breakout or a "bear trap."
Final Verdict
Macro Structure: WEAK BEARISH
Micro Action: MIXED
AI Strategy: WATCHING (Possible Setup)
Trader's Takeaway: Do not short aggressively yet. The "Neural Brain" is telling you that while the structure is bearish (Price < Cloud) and conviction is building, the current moment lacks the momentum or clarity for a high-confidence trade.
Action: Wait for the Confidence to increase (ideally >60%) or for the Efficiency Score to improve before entering a short position.
NASDAQ NAS100 Analysis and My Trade Plan📊 Currently analysing NAS100 (NASDAQ), we can see that price has broken structure to the upside, confirming bullish intent. Right now, NAS100 is retesting the value area and the Point of Control (POC) on the volume profile — a critical zone to watch 👀📈
⚠️ Price action is a bit precarious. After a strong impulsive move, we’ve now seen a deep and aggressive retracement, which opens the door for potential bearish movement this week.
📆 However, my higher-timeframe bias remains bullish, with the weekly chart still supporting upward continuation.
📌 My plan:
If price holds above the current POC, then breaks and retests cleanly, I’ll be looking for long opportunities. If it breaks below the POC, I will step aside and abandon the long bias 🚫
This is not financial advice — just my personal market outlook. 💬📉📈

NASDAQ 100: Bullish! Look For Valid Buys With The Trend!Welcome back to the Weekly Forex Forecast for the week of Dec. 1-5th.
In this video, we will analyze the following FX market: NASDAQ (NQ1!) NAS100
The NASDAQ closed last week strong. It would indicated the potential for follow through going into this week, at least early.
Bear in mind that the previous 3 weeks were very bearish, coming down from ATHs, and forming a bearish MSS.
Look out for confirmations for valid trades. The overall trend is bullish, so I am personally looking for valid buys. A bearish MSS would invalidate those ideas.
Enjoy!
May profits be upon you.
Leave any questions or comments in the comment section.
I appreciate any feedback from my viewers!
Like and/or subscribe if you want more accurate analysis.
Thank you so much!
Disclaimer:
I do not provide personal investment advice and I am not a qualified licensed investment advisor.
All information found here, including any ideas, opinions, views, predictions, forecasts, commentaries, suggestions, expressed or implied herein, are for informational, entertainment or educational purposes only and should not be construed as personal investment advice. While the information provided is believed to be accurate, it may include errors or inaccuracies.
I will not and cannot be held liable for any actions you take as a result of anything you read here.
Conduct your own due diligence, or consult a licensed financial advisor or broker before making any and all investment decisions. Any investments, trades, speculations, or decisions made on the basis of any information found on this channel, expressed or implied herein, are committed at your own risk, financial or otherwise.

NASDAQ Santa Rally already underway.Nasdaq (NDX) has made a strong V-shaped recovery on its 1D MA100, as projected on our previous analysis and is extending the uptrend above the 4H MA200 (orange trend-line).
The rally may need a relief pull-back towards its 4H MA50 (blue trend-line) but technically, the seasonal end-of-the-year 'Santa Rally' is already underway.
V-shaped recovery and Inverse Head and Shoulders patterns typically target their 2.0 Fibonacci extensions. That is currently at 26600.
---
** Please LIKE 👍, FOLLOW ✅, SHARE 🙌 and COMMENT ✍ if you enjoy this idea! Also share your ideas and charts in the comments section below! This is best way to keep it relevant, support us, keep the content here free and allow the idea to reach as many people as possible. **
---
💸💸💸💸💸💸
👇 👇 👇 👇 👇 👇

CISD and Inversions for framing a narrative. My main ModelThe next day model of MMXM. Thought process on how you can frame your bias for the next day next 4h next hourly and next 15min

Nasdaq 100 (NQ): Hyper-Extended Momentum – Breakout or Exhaust
Category: Trend Analysis / Support & Resistance
Ticker: NQ1! (CME)
Analysis:
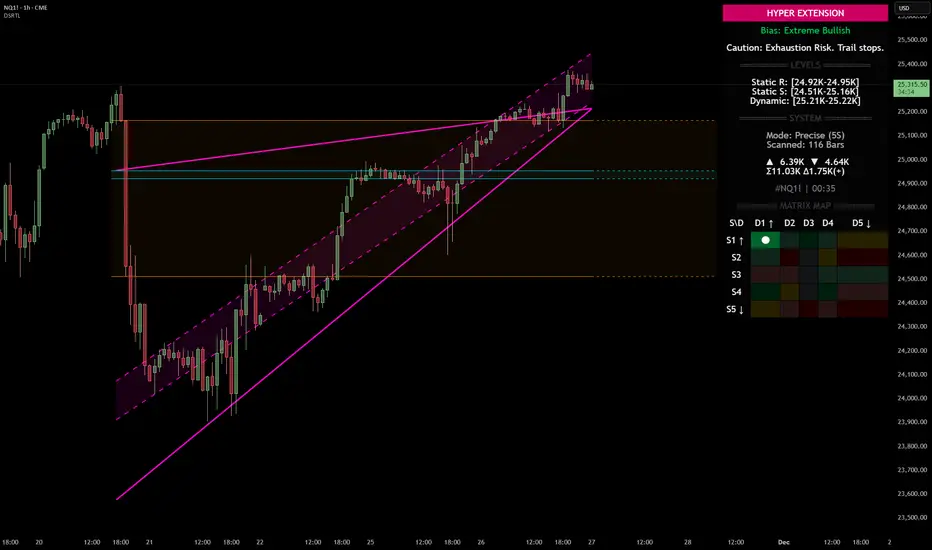
We are looking at the Nasdaq 100 Futures (NQ1!) on the 1H timeframe using the Dynamic Support & Resistance (DSRTL) system. The market is currently displaying a textbook example of a high-momentum breakout that has pushed into statistical extremes.
Here is the breakdown of the current technical landscape based on the indicator's Matrix Logic:
1. The "Hyper Extension" State (S1 / D1)
The indicator’s dashboard has triggered a "HYPER EXTENSION" alert. This specific state occurs when two conditions are met simultaneously:
• Static Breakout (S1): Price has cleared the horizontal resistance structures (indicated by the volume clusters).
• Dynamic Overextension (D1): Price has pierced above the upper limit of the dynamic trend channel (the purple trendlines).
2. Bias: Extreme Bullish
The current bias is rated as "Extreme Bullish". The trend is undeniably strong, confirmed by the positive Volume Delta (+965) shown on the dashboard. The price action is aggressive, creating a steep angle of ascent that has moved away from the mean.
3. The Warning Signal: Exhaustion Risk
While the trend is up, the system issues a cautionary note: "Exhaustion Risk. Trail stops."
In technical terms, when price action moves into "D1" (Dynamic Overextension), it indicates that the asset is trading significantly above its standard deviation or channel geometry. Historically, markets often seek mean reversion or consolidation after such rapid expansions to sustain the trend.
Key Levels to Watch:
• Dynamic Support (Immediate): The top of the purple channel (approx. 25,220) acts as the first layer of defense. A retest of this level is common after a breakout.
• Static Support (Structural): The breakdown level of the previous resistance, now turning into support around the 24.95K region.
Scenario Conclusion:
This is a pure momentum play. Traders should be aware that while the path of least resistance is up, the probability of a "snap-back" or consolidation increases the further price stretches above the dynamic channel. This is not a signal to short the trend immediately, but rather a signal to manage risk tightly on existing long positions.
Disclaimer: This analysis is for educational purposes only and explains the logic of the DSRTL technical indicator. It does not constitute financial advice.
Nasdaq Rallies into Thanksgiving, Meta Bounce Kicks InWall Street sentiment has perked up on renewed Fed cut bets, with the Nasdaq leading the way. This has allowed Facebook to finally rally from support levels I highlighted 3 weeks ago.
Matt Simpson, Market Analyst at City Index.

Pre open Heads Up. Index NSYECME_MINI:NQ1!
Looking for bearish prices on the Index triads for this NYO while the overall thought process is bullish on the HTF

Nasdaq 100, USD Index: Thanksgiving PerformanceToday I’m digging into my Excel data to see how the Nasdaq and the US Dollar Index performed across the three trading days either side of Thanksgiving.
Matt Simpson, Market Analyst at City Index.

Will December Rate Cut Save the Market?Is Rate Cut Probability up a Short-Term Bounce or continuation of the downtrends?

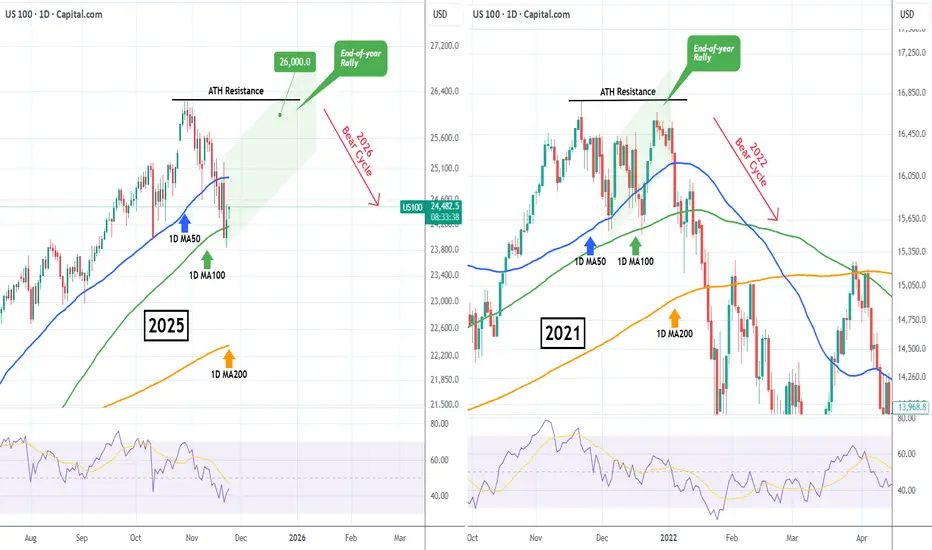
NASDAQ Santa Rally back to 26000 started?Nasdaq (NDX) rebounded on Friday after marginally breaching below its 1D MA100 (green trend-line) for the first time since May 09! The continuation today is a sign of a potentially strong rebound, the traditional end-of-year rally that is know as 'Santa's rally'.
Based on the 2021 Bull Cycle, which after touching its own 1D MA100 it started a final rally that almost tested its ATH Resistance, we can expect Nasdaq to now rise towards the end of the year to potentially 26000.
Could this be the last rally before a new Bear Cycle in 2026?
---
** Please LIKE 👍, FOLLOW ✅, SHARE 🙌 and COMMENT ✍ if you enjoy this idea! Also share your ideas and charts in the comments section below! This is best way to keep it relevant, support us, keep the content here free and allow the idea to reach as many people as possible. **
---
💸💸💸💸💸💸
👇 👇 👇 👇 👇 👇
Nasdaq NAS100 Analysis: The Conditions I Need Before Going ShortI'm keeping a close eye on NAS100 (Nasdaq) right now. 📉✨ On the 4H timeframe, price remains in a clean, sustained bearish trend, and I'm anticipating a potential continuation lower.
If price rejects the current level and fails to retrace through the 1H imbalance, and we see a rotation followed by a bearish break of structure, I'll be preparing for a short opportunity. 📊🔻
Not financial advice.

US100 Reversal Map – Hull MA + Heikin Ashi Confirmation🧠 US100 / NASDAQ100 Profit Pathway Setup — The Thief’s Bullish Escape Plan! 💰🚀
📊 Market Bias: Bullish (Day Trade Setup)
The Thief Trader has spotted a golden pathway in the NASDAQ100 (US100)!
Here’s the breakdown of the plan — straight from the thief’s vault 🕵️♂️📈
🎯 Plan Overview
Bias: Bullish continuation confirmed
Technical Confirmation:
✅ Double Pullback on Hull Moving Average
✅ Retest Zone successfully defended
✅ Heikin Ashi Bullish Doji signaled a trend reversal confirmation
💡 Momentum is shifting upward — the trend has officially changed!
💎 Entry Strategy (Layered Thief Style)
The Thief Strategy applies a layered entry method — multiple buy limits to average into strength.
📥 Buy Limit Layers:
25,300
25,400
25,500
25,600
(Traders can adjust or add more layers based on risk appetite and confirmation zones.)
🛡️ Stop-Loss Setup
This is the Thief SL @ 25,100
⚠️ Note to Thief OG’s:
I’m not recommending my SL as your SL — always customize risk and secure your own bag. Manage your position with discipline and independence! 💼
🎯 Take-Profit Zone
Target: 26,200
🚨 The Police Barricade Zone acts as a strong resistance — overbought levels spotted and potential bull trap alert!
Kindly exit with profit before the officers arrive. 😎
⚠️ Note: Profit-taking is at your discretion. Book and Run!
📈 Related Pairs to Watch (Correlation Insight)
NASDAQ:NDX / CAPITALCOM:US100 / NASDAQ:QQQ : All mirror NASDAQ movement.
SP:SPX / AMEX:SPY : Often correlate with NASDAQ’s momentum (watch divergence for clues).
TVC:VIX : If volatility spikes, expect pullbacks on tech-heavy indices.
TVC:DXY : A weak dollar often fuels US100 bullish legs — keep an eye on it.
NASDAQ:AAPL / NASDAQ:MSFT / NASDAQ:NVDA : Leading drivers of NASDAQ — if they pump, the index follows. 💪
🧩 Key Insights
Hull MA alignment confirms momentum shift.
Retest + bullish Heikin Ashi Doji = market reversal confirmation.
Layered entries give flexibility in volatile intraday conditions.
Dynamic risk management is key — never marry a position.
✨ “If you find value in my analysis, a 👍 and 🚀 boost is much appreciated — it helps me share more setups with the community!”
#US100 #NASDAQ100 #ThiefTrader #DayTrading #IndexTrading #HullMA #HeikinAshi #LayeredEntries #TechnicalAnalysis #TradingSetup #PriceAction #MarketReversal #TradingCommunity #BullishPlan #SmartMoneyFlow #TradeIdeas #ThiefStrategy

Weekly Market Forecast: Indices Are Weak! Wait For Sells!In this Weekly Market Forecast, we will analyze the S&P 500, NASDAQ, Gold and Silver futures, for the week of Nov 24-29th.
Enjoy!
May profits be upon you.
Leave any questions or comments in the comment section.
I appreciate any feedback from my viewers!
Like and/or subscribe if you want more accurate analysis.
Thank you so much!
Disclaimer:
I do not provide personal investment advice and I am not a qualified licensed investment advisor.
All information found here, including any ideas, opinions, views, predictions, forecasts, commentaries, suggestions, expressed or implied herein, are for informational, entertainment or educational purposes only and should not be construed as personal investment advice. While the information provided is believed to be accurate, it may include errors or inaccuracies.
I will not and cannot be held liable for any actions you take as a result of anything you read here.
Conduct your own due diligence, or consult a licensed financial advisor or broker before making any and all investment decisions. Any investments, trades, speculations, or decisions made on the basis of any information found on this channel, expressed or implied herein, are committed at your own risk, financial or otherwise.

E mini S&P 500 weekly outlook and HTF reference pointsCME_MINI:ES1!
Expansion levels on ES. Will approach on a day to day basis with the daily closures

Emini Nasdaq 100. Important Areas to look for and Weekly outlookCME_MINI:NQ1!
Highlighted the important levels. what to look for how we can approach the next week in terms of higher timeframe reference points

NASDAQ 100 (NQ1!): Wait For Price To Reach -FVG!Welcome back to the Weekly Forex Forecast for the week of Nov. 17-21st.
In this video, we will analyze the following FX market: NASDAQ (NQ1!) NAS100
The NASDAQ gave some bearish-neutral price action last week. It ended in a doji candle, not giving us much in the way of directioin. But, there is a bearish FVG on the Daily TF formed. The reaction to it will provide all the insight we need regarding the directional bias of this market for this coming week.
If the -FVG holds, sell it. If it is disrespected, buy it.
Simple.
Enjoy!
May profits be upon you.
Leave any questions or comments in the comment section.
I appreciate any feedback from my viewers!
Like and/or subscribe if you want more accurate analysis.
Thank you so much!
Disclaimer:
I do not provide personal investment advice and I am not a qualified licensed investment advisor.
All information found here, including any ideas, opinions, views, predictions, forecasts, commentaries, suggestions, expressed or implied herein, are for informational, entertainment or educational purposes only and should not be construed as personal investment advice. While the information provided is believed to be accurate, it may include errors or inaccuracies.
I will not and cannot be held liable for any actions you take as a result of anything you read here.
Conduct your own due diligence, or consult a licensed financial advisor or broker before making any and all investment decisions. Any investments, trades, speculations, or decisions made on the basis of any information found on this channel, expressed or implied herein, are committed at your own risk, financial or otherwise.

Nasdaq 100, Tesla and Apple OutlookWall Street is on the verge of closing lower for a third week for the first time in eight months. I explain why I think there could be further losses ahead, why Tesla (TSLA) is a preferred short setup and why to keep an eye on Apple (AAPL).
Matt Simpson, Market Analyst at City Index

How to Identify Stocks Uptrends and Downtrends to Gain a TradingHow to Identify Stocks Uptrends and Downtrends to Gain a Trading Edge and understand the psychology behind the patterns

NQ Short setup on 1HR Bearish DivergenceNQ Short setup on 1HR Bearish Divergence
Entry: 25447
SL: 25835
TP: 24282
RR: 1:3
