NASDAQ 100 ShortRetracement function on the daily chart...
Price has filled the inefficiency on the daily chart here on NQ and formed a Reversal on all 3 correlated assets alongside Dow Jones 30 and S&P500
Anticipating price to drop down to the lows outlined before the end of next week 24 Oct 25', option puts??
Daily chart projection, nothing more than that, lower timeframes are subject to fluctuations that we may not be able to update quickly enough, so yeah.
I use the VANTAGE:NAS100FT by Vantage
GLGT
NASDAQ 100 E-MINI FUTURES

Back to ATHs? Inverse Head & Shoulders Imminent!I’m starting to get a strong sense that price won’t fill the new week opening imbalance at 24,336. The Inverse Head & Shoulders pattern I’ve been anticipating all week looks ready to form — and if it does, I believe it’ll propel us right back toward all-time highs.
If price rips through 24,724, this idea becomes invalid, and I’ll reassess the chart for the next trade opportunity.
Lets see how this plays out!

Can NASDAQ100’s Retest Turn Into a Full-Fledged Rally?⚡ NASDAQ100 — “The Wall Street Engine” Trade Opportunity Guide (Swing / Day Trade)
Plan:
📈 Bullish confirmation awaited at the Hull Moving Average retest.
When price respects that dynamic zone and momentum aligns, the Thief layers up — ready to stack positions like a pro!
💰 Thief Strategy Playbook:
Thief’s weapon? Layering entries — the art of scaling in like a patient hunter.
Multiple buy limit orders are placed around:
🔹 24,400 🔹 24,500 🔹 24,600
(You can adjust or add more layers based on your own trading structure and capital.)
🛡️ Stop-Loss:
This is the Thief’s SL → @24,200
🕵️♂️ Note to all Thief OGs:
I’m not recommending that you copy my SL — risk management is your call.
Remember: Make money, then take money at your own risk.
🎯 Target Zone:
@25,300 — where the POLICE BARRICADE (resistance) stands tall!
⚠️ The zone aligns with overbought levels + liquidity trap potential, so don’t overstay your welcome.
Escape with profits like a smart thief before the market cuffs you! 💨
🕵️♂️ Note again to Thief OGs:
Targets are flexible — adapt based on your execution and structure confirmation.
🔍 Correlated Assets to Watch:
SP:SPX (S&P500) — often mirrors NASDAQ’s overall direction.
TVC:DJI (Dow Jones) — gives early risk-on/risk-off sentiment clues.
TVC:US10Y (US Treasury Yield) — rising yields can pressure tech stocks.
TVC:VIX (Volatility Index) — watch for volatility spikes; they often precede reversals.
Correlation Key Insight:
When the dollar weakens and yields cool, NASDAQ tends to fly 🚀 — liquidity rotation favors growth stocks and tech-heavy indices.
⚙️ Quick Recap:
✅ Bias: Bullish (with retest confirmation at Hull MA)
💸 Entry Zone: 24,400 → 24,600 (Layered limits)
🧱 SL: 24,200 (risk-controlled zone)
🎯 TP: 25,300 (liquidity + resistance zone)
⚠️ Risk: Adjust position size and trail stops as structure evolves
✨ “If you find value in my analysis, a 👍 and 🚀 boost is much appreciated — it helps me share more setups with the community!”
📜 Disclaimer:
This is a Thief-style trading strategy — designed for entertainment, education, and market storytelling. Trade responsibly; it’s just for fun, not financial advice.
#NASDAQ100 #US100 #IndexTrading #HullMA #PriceAction #MarketStructure #SwingTrade #DayTrade #TechnicalAnalysis #SmartMoneyConcepts #TradingCommunity #ThiefTrader #ChartArt #EditorPickCandidate

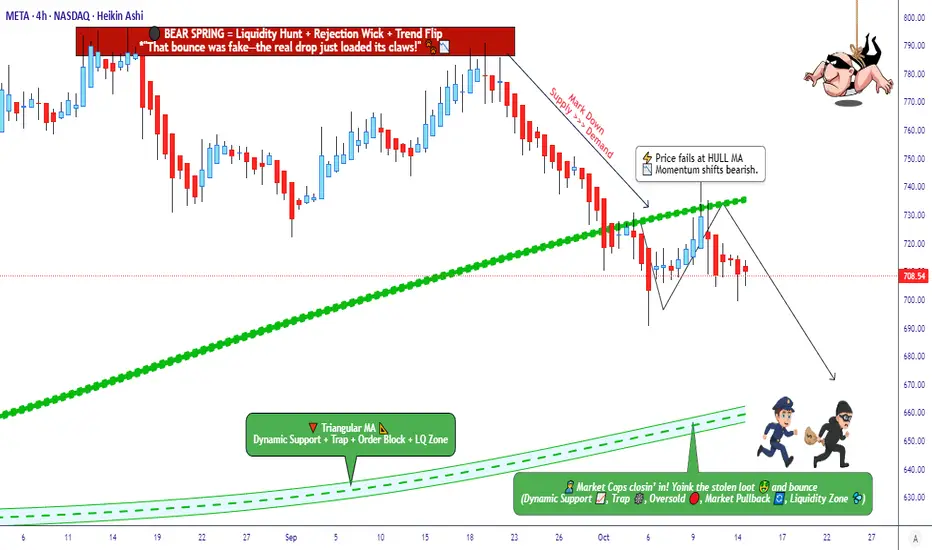
META Platforms Chart – Technical Reversal Signals Sell Momentum🎯 META's Bearish Heist: Time to Rob the Bears' Bank! 💰
📊 Asset Overview
META PLATFORMS, INC - The social media giant is about to get socially distanced from higher prices!
🔍 Market Analysis
Current Setup: Bearish Momentum Confirmed ⚠️
The Hull Moving Average just broke down like my New Year's resolutions! 🐻 Bears have grabbed the steering wheel and they're driving this bus downhill. The technical setup is screaming "SHORT" louder than your stop loss alerts at 3 AM.
🎭 The "Thief Strategy" Game Plan
🎯 Entry Strategy: Layer Like a Pro
The Layered Limit Order Approach (because catching falling knives is for amateurs!)
Layer 1: $740 🎯
Layer 2: $730 🎯
Layer 3: $720 🎯
Layer 4: $710 🎯
You can add more layers based on your risk appetite and portfolio size. Think of it as building a profit sandwich - the more layers, the tastier! 🥪
Alternative: Direct market entry at current price levels (for the adrenaline junkies among us)
🛡️ Risk Management
🚨 Stop Loss: $760
⚠️ IMPORTANT NOTE: Dear Thief OG's (Ladies & Gentlemen),
This is MY stop loss level based on my risk tolerance. This is NOT a recommendation - you MUST set your own stop loss based on YOUR risk management rules. Trade at your own risk, secure your own bag! 💼
🎯 Profit Target
💎 Target: $660
Why $660?
✅ Triangular Moving Average acting as Fort Knox-level support
✅ Oversold conditions brewing like a perfect storm
✅ Bull trap zone where buyers might step in
✅ Technical barricade stronger than a police checkpoint 🚓
⚠️ IMPORTANT NOTE: Dear Thief OG's,
This is MY take profit level. You can exit whenever you want - secure those gains at YOUR comfort zone. Take profits when you're happy, not when I tell you! Your money, your rules. 💵
📈 Related Pairs to Watch
Keep your eyes on these correlated assets:
🔗 NASDAQ:GOOGL - Fellow tech giant showing similar bearish pressure
🔗 NASDAQ:AAPL - Tech sector leader; weakness here confirms broader tech selloff
🔗 NASDAQ:MSFT - Big tech correlation play
🔗 NASDAQ:AMZN - FAANG/Magnificent 7 correlation
🔗 NASDAQ:QQQ - Nasdaq ETF; META's moves often mirror tech sector sentiment
Key Correlation: When META sneezes, social media stocks catch a cold! Watch NYSE:SNAP and NYSE:PINS for sympathy plays.
🎪 The Thief Style Philosophy
This isn't your grandpa's trading strategy - we're playing chess while others play checkers! ♟️ The "Thief" approach uses strategic layering to maximize entry opportunities while managing risk like a boss.
Remember: We're not thieves in the literal sense - we're just stealing profits from the market inefficiencies! 😎
📊 Technical Summary
✅ Hull MA Breakdown Confirmed
✅ Bearish Momentum Building
✅ Multiple Technical Resistance Overhead
✅ Risk-Reward Ratio Favoring Shorts
✨ If you find value in my analysis, a 👍 and 🚀 boost is much appreciated — it helps me share more setups with the community!
#META #MetaPlatforms #StockMarket #SwingTrading #DayTrading #TechnicalAnalysis #BearishSetup #ShortSetup #HullMovingAverage #ThiefStrategy #LayeredEntry #RiskManagement #TradingStrategy #StockTrading #MarketAnalysis #TradingIdeas #TradingView #FAANG #TechStocks #BearishMomentum
14 oct push down nasdaqas seen in the video.
we are going short.
dominant force of the day in short.
entry in blue.
stop in red
targets in green
Have fun
Elektra

Nasdaq - Clearly heading to $30.000!🎉Nasdaq ( TVC:NDQ ) points much higher:
🔎Analysis summary:
Yes, we witnessed a short term correction over the past couple of days. But no, this does not mean that the bullrun is now entirely over. In fact, looking at the longer term rising channel pattern, the Nasdaq can still rally higher until it will retest the upper trendline.
📝Levels to watch:
$25.000, $30.000
SwingTraderPhil
SwingTrading.Simplified. | Investing.Simplified. | #LONGTERMVISION

NASDAQ Did the 1D MA50 just save the day??Nasdaq (NDX) suffered a historically strong daily sell-off on Friday following President Trump's tariff threats and touched (and closed on) its 1D MA50 (blue trend-line).
Last time it hit that trend-line was on September 02 and that was a technical Higher Low on the 5-month Channel Up. Friday's Low was also very close to the bottom of this pattern. At the same time the 1D RSI hit and rebounded on its Lower Lows Support trend-line.
With the market rebounding and opening considerably higher today, it is more likely technically that we have started the pattern's new Bullish Leg. With the last two such sequences rising by at least +11.00%, we expect a new similar uptrend, which as long as the 1D MA50 holds, could hit at least 26000 within a 40 day horizon.
-------------------------------------------------------------------------------
** Please LIKE 👍, FOLLOW ✅, SHARE 🙌 and COMMENT ✍ if you enjoy this idea! Also share your ideas and charts in the comments section below! This is best way to keep it relevant, support us, keep the content here free and allow the idea to reach as many people as possible. **
-------------------------------------------------------------------------------
💸💸💸💸💸💸
👇 👇 👇 👇 👇 👇

NASDAQ 100 (NQ1!): Still Bullish! Wait For Valid Buys!Welcome back to the Weekly Forex Forecast for the week of Oct. 13 - 17th.
In this video, we will analyze the following FX market: NASDAQ (NQ1!) NAS100
The NASDAQ dumped last Friday with the Trump tariffs on China announcement. His latest tweet seems to have lowered the temperature on the tension. The markets have opened with a gap up.
The plan: look for valid buy setups, and stay with the overall trend. Avoid selling this market.
Simple.
Enjoy!
May profits be upon you.
Leave any questions or comments in the comment section.
I appreciate any feedback from my viewers!
Like and/or subscribe if you want more accurate analysis.
Thank you so much!
Disclaimer:
I do not provide personal investment advice and I am not a qualified licensed investment advisor.
All information found here, including any ideas, opinions, views, predictions, forecasts, commentaries, suggestions, expressed or implied herein, are for informational, entertainment or educational purposes only and should not be construed as personal investment advice. While the information provided is believed to be accurate, it may include errors or inaccuracies.
I will not and cannot be held liable for any actions you take as a result of anything you read here.
Conduct your own due diligence, or consult a licensed financial advisor or broker before making any and all investment decisions. Any investments, trades, speculations, or decisions made on the basis of any information found on this channel, expressed or implied herein, are committed at your own risk, financial or otherwise.

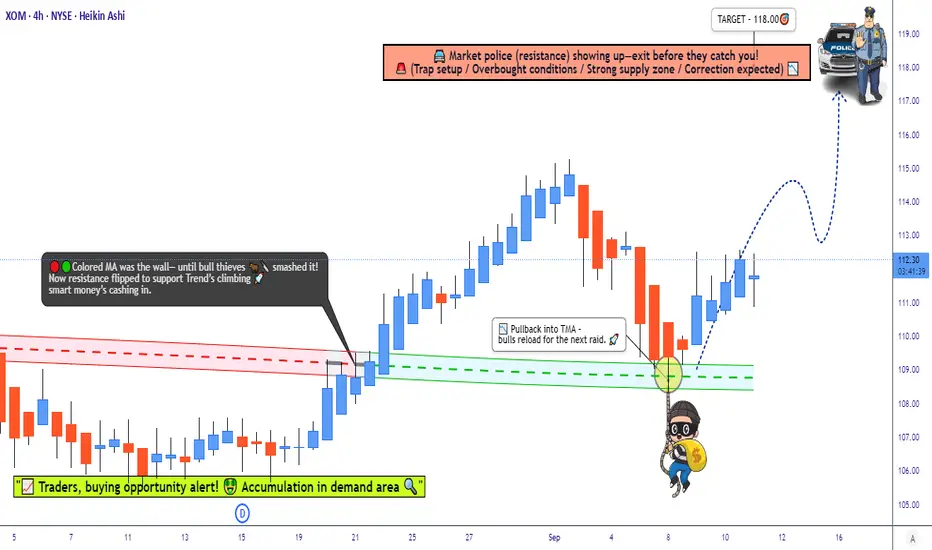
Exxon Mobil Stock Outlook: Fundamentals + Technicals Aligned📌 Exxon Mobil Corporation (XOM) — Bullish Master Plan (Swing / Scalping Trade)
🛠️ Plan Setup (Thief Strategy)
Bias: Bullish — Triangular Moving Average Pullback 📈
Entry: Multiple layered limit orders at 🔹 $110.00 🔹 $111.00 🔹 $112.00 (You can adjust layers based on your own strategy).
Stop Loss (Protective Layer): $108.00 (adjust to your own risk preference).
Target Zone: Around $118.00 (key resistance area).
⚠️ Note: These levels are not financial advice. Manage risk carefully and adjust according to your own strategy.
❓ Why This Plan?
This Thief Plan Strategy uses layered limit orders for flexible entries. It combines technical pullback signals with fundamental, macro, sentiment, and fear/greed insights to build a confluence-based trade idea.
📊 Stock Price Overview
Daily Change: -0.20% (from $112.50 previous close)
1-Month Trend: +5.66% (from $106.27 on Aug 12)
1-Year Trend: -4.21% (from $117.22 in Sep 2024)
Year-to-Date: +2.26% (from $109.57 in 2024)
😊 Investor Sentiment
Retail Investors: 50.76% bullish 😄
Institutional Investors: 47.25% bearish 😕
Overall Mood: Mixed ⚖️
😨 Fear & Greed Index
Current Level: 39 (Fear)
Interpretation: Cautious tone, may signal undervaluation.
📈 Fundamental Score (7.55/10) ✅
Strong revenue: $340.57B in 2024 (+1.16% YoY) 💰
Stable dividend: $0.99/share quarterly 🎉
Weaknesses: Net profit -6.47% in 2024, higher operating costs 📉
🌍 Macro Score (6.8/10) 🌎
Oil demand projected to rise 20% by 2050 🛢️
Geopolitical risks support oil prices 🔥
OPEC+ output hike could moderate momentum 📉
🐂🐻 Market Outlook
Consensus: Neutral → Mildly Bullish ⚖️
Analyst Ratings: Moderate Buy (12 Buy, 7 Hold, 0 Sell)
Key Drivers: Stable fundamentals + oil price volatility = balanced setup.
🔑 Takeaway
Exxon Mobil (XOM) offers a layered-entry bullish opportunity with mixed sentiment but strong long-term fundamentals.
Fear-dominated mood may provide contrarian opportunities.
Keep an eye on oil prices & geopolitics for momentum triggers.
Layering strategy provides flexibility across multiple levels. 🚀
🔗 Related Pairs to Watch (in USD)
Chevron Corporation (CVX): Another oil major with similar exposure to crude prices. 🛢️
United States Oil Fund (USO): Tracks WTI crude oil prices, a key driver for XOM. 📈
Energy Select Sector SPDR Fund (XLE): Broad energy sector ETF for context. 💡
✨ “If you find value in my analysis, a 👍 and 🚀 boost is much appreciated — it helps me share more setups with the community!”
#XOM #ExxonMobil #EnergyStocks #SwingTrade #Scalping #StockMarket #Oil #Fundamentals #TechnicalAnalysis #Macro #FearGreedIndex #TradingStrategy #LayeredEntry #StockIdeas
Emini Nasdaq 100. 10.10.2025, WalkthroughCME_MINI:MNQ1!
One-sided expansion after Trump announcement on China tariffs. A geopolitical event and major liquidation across the board.

Final sell off ahead of FOMC | Head n ShouldersI believe price will stage one final sell-off before resuming its push toward higher highs. On the 4H chart, a potential Head & Shoulders pattern is forming, suggesting price may fill the hourly gap at 24,856 before or during the FOMC release.
The 15-minute chart offers a more precise entry compared to the 1H and 4H timeframes.
I plan to enter within the 25,149–25,150 price range, provided my bias remains valid heading into the New York open.
Lets get it!⚡

8 oct pushing uplooking for a long
entry in blue
target in green
stop in red.
all details are explained in the video.
Have fun
Elektra

MNQ1! Shorts to RTH Range for Monday 10-6-25This is my idea for Monday Oct 6 2025 that MNQ1! can be a bearish day looking for levels 24,980.

Is the Nasdaq a Bubble? A Technical Correction Is PossibleCME_MINI:NQ1!
Here’s a breakdown of the current Nasdaq correction scenarios based on the Nasdaq Futures (NQ1!) chart.
Every time I reached the top of the channel, an adjustment came out.
Based on the monthly chart, it has closed positively for six consecutive months since the tariff reduction, and it is judged to have entered the overbought zone by breaking through the upper Bollinger Band.
While a Santa Rally could still occur in Q4, we expect a short-term correction within one to two weeks.
Your follow and boost would mean a lot. 🚀
I am Korean and I used Google Translate.

7 oct looks short to melooking at the market today.
usa players have shown great strenght to short the markert.
so as seen on the video .
entry in blue 25248
target in 25028
stop in red 25291
have fun
Elektra

NASDAQ Future long: after resitance broken, new support formed Current Analysis: Nasdaq futures are currently facing a critical support at 22100
I see the chance of a Bullish rebound:
Support Strength: This support was a resistance in past weeks, then it was broken on Feb 14th and act as support in last 3 days.
Additionally, from Dec. 17th to February 12th, price formed a triangle that was broken up on Feb.13th.
Expected Movement: If the price successfully breaks above 22100, I expect it to rally towards the $22400 area.
Action Plan:
Entry Point: entered long with limit order at 22100
Target: Set a target in the $22425 (high of December 17th)
Stop Loss: Place a stop loss at 21937.75, below minimum of Feb.20th and with Risk/Reward Ratio of 2.

NASDAQ Channel Up found support and aims for 25600.Nasdaq (NDX) has been trading within a Channel Up since the August 28 High and on Friday it tested its 1H MA100 (green trend-line) again and rebounded. That has been a bullish continuation signal within this pattern every time a 1H MA50/ 100 takes place.
On the previous Bullish Leg that confirmed the upside continuation all the way to the 2.382 Fibonacci extension before a 1H MA50/ 100 Bearish Cross and new Low.
As a result, the current short-term Target on Nasdaq is 25600.
-------------------------------------------------------------------------------
** Please LIKE 👍, FOLLOW ✅, SHARE 🙌 and COMMENT ✍ if you enjoy this idea! Also share your ideas and charts in the comments section below! This is best way to keep it relevant, support us, keep the content here free and allow the idea to reach as many people as possible. **
-------------------------------------------------------------------------------
💸💸💸💸💸💸
👇 👇 👇 👇 👇 👇

BUY NASDAQOn the Nasdaq Futures, we went long on the market since it grabbed the minor sellside liquidity and gave us a FVG to ride, our target is the buyside liquidity.
Follow for more!

Nasdaq to 25,300? | Long Idea 10/3I believe Nasdaq still has room to climb, with the 25,300 range in sight to finish off the week. The price action closely mirrors the pattern from September 5th–9th, 2025, and I wouldn’t be surprised to see history repeat itself here.
I’m planning to go long from the 25,105 imbalance, holding through all-time highs and into the void through 25,300. Once ATHs are broken, I’ll trail my stop closely to lock in profits.

Nasdaq Is About to Choose: Melt Up or MeltdownNasdaq E-minis (NQ1) are coiling at a key inflection point.
-If 24,874 breaks, a push into 25,100 looks likely.
-Clear that level, and bulls can stretch to 25,300–25,385 for a solid run.
-But if we lose 24,782, pressure builds toward 24,689… and a break there exposes 24,439.
Here’s the part most traders miss: these levels aren’t just numbers; they’re liquidity traps. One side of the market gets baited in, then the other side runs with it.
👉 Smart money already knows which pockets matter most. Retail will find out the hard way.
How are you positioning if NQ1 breaks either way?

Short Trade Idea for 9/30 | NQI’m anticipating price to either push into the 1H bearish imbalance at 24,894 or reject from the NWOG around the 24,856 range before turning lower toward the 24,640.00 range. My bias is firmly short for now — but I’ll reassess as we approach the open.

30 sept DOWN NASDAQshort in nasdaq.
looking at weaknes in daily.
entry in blue
stop in red.
target in green.
have fun
all details of the trade are explained on the video
Electra 33

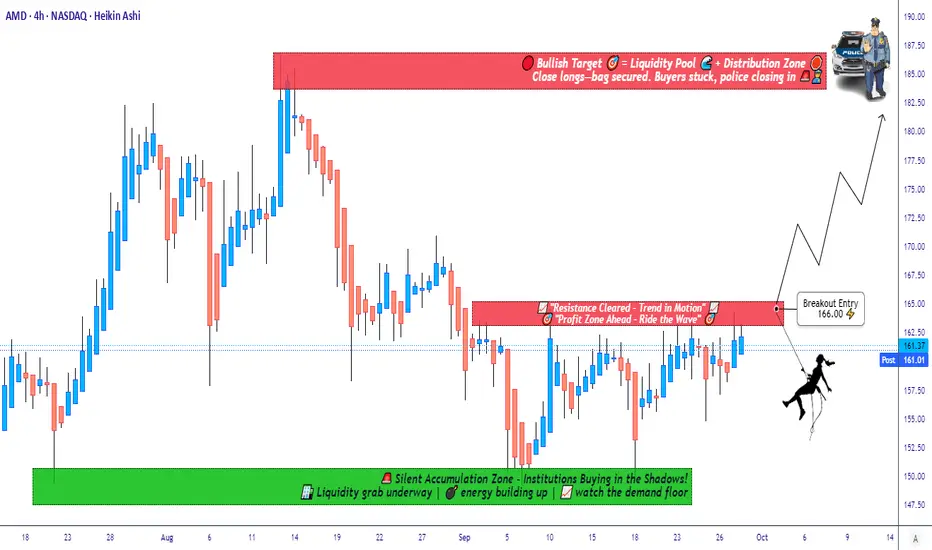
Breakout or Fakeout? Watching AMD Resistance for Next Big Move📈 AMD “Advanced Micro Devices, Inc” – Wealth Strategy Map (Swing/Day Trade)
🗺️ Plan:
I’m tracking AMD with a bullish strategy — waiting for a resistance level breakout to confirm momentum. Once price breaks the key barrier, entry opportunities open up.
🎯 Entry Setup (Thief Strategy Layering Method):
Instead of one entry, I’m applying a layering strategy with multiple buy limit orders. This approach helps average entries across different levels.
Buy limit layers: 155.00, 158.00, 160.00, 162.00, 163.00. 164.00
(💡 You can increase layers based on your own risk & comfort.)
Breakout confirmation: Entry after breakout price level mentioned.
🛑 Stop Loss (Thief SL):
Suggested stop loss @150.00
⚠️ Note: Dear Ladies & Gentlemen (Thief OG’s), this is my SL level, but you are not required to follow it. Manage risk according to your own plan.
🎯 Profit Target (Police Barricade Zone 🚨):
Price faces a strong resistance around 186.00 — this area acts as a trap zone with overbought conditions.
Target @186.00 (escape with profits before police catch you 🚔).
⚠️ Note: Again, TP is personal. Take profit when satisfied — your money, your choice.
🔗 Related Assets to Watch (Correlation Insight):
AMD tends to move in line with broader tech sentiment and semiconductors:
NASDAQ:NVDA (NVIDIA) – Direct sector competitor, often mirrors momentum.
NASDAQ:SMH (VanEck Semiconductor ETF) – Strong correlation, broader chip market direction.
NASDAQ:QQQ (NASDAQ 100 ETF) – AMD is a major component; index momentum often drives AMD.
NASDAQ:INTC (Intel) – Rival stock; negative news on INTC can boost AMD sentiment.
Watching these pairs helps confirm breakouts & avoid false signals.
✨ “If you find value in my analysis, a 👍 and 🚀 boost is much appreciated — it helps me share more setups with the community!”
⚠️ Disclaimer:
This is a Thief Style Trading Strategy — shared for fun & educational purposes only.
Not financial advice. Trade at your own risk.
#AMD #SwingTrade #DayTrade #Stocks #Semiconductors #TradingStrategy #BreakoutSetup #StockMarket #NVDA #QQQ