NQ - Sub Dividing Elliott Wave CountIs this possible? Multiple 1st and 2nd wave sub divisions, a small 3rd wave, and then again multiple 4th and 5th wave sub divisions.
Nq100signals

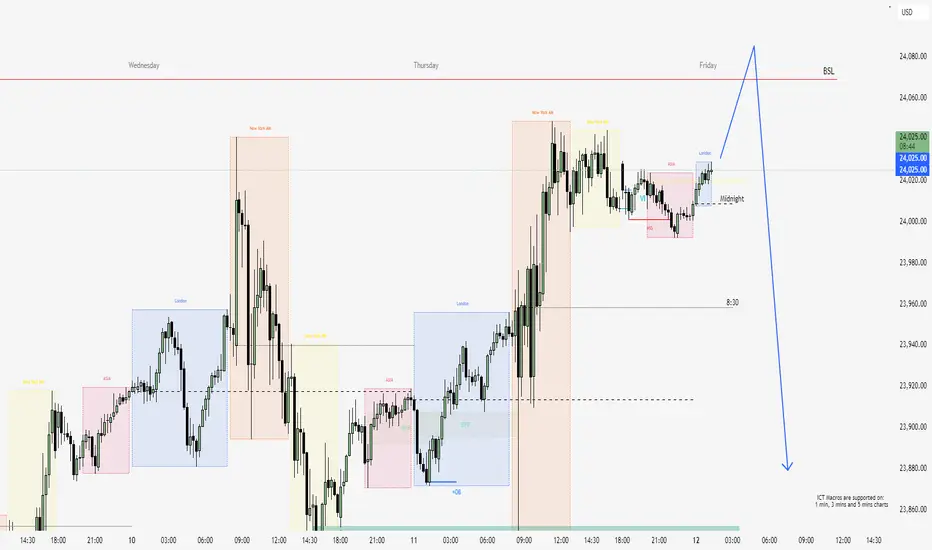
Friday Liquidity Sweep & Reversal Setup – NQNarrative:
Price action on NQ has swept the Buy Side Liquidity (BSL) on the daily timeframe around 24,060 during Thursday’s NY session. After the sweep, price consolidated just below the high, suggesting the potential for a Friday Reversal, in line with ICT’s classic "Reversal Friday" concept.
Today (Friday), I am watching for a potential Judas Swing to the upside during the New York AM session, aiming to lure breakout buyers above yesterday’s highs.
Once that buy-side liquidity is taken, I’ll look for:
A Market Structure Shift (MSS) on the 5M or 3M chart.
Entry on a Fair Value Gap (FVG) or a refined Order Block.
Stop Loss just above the Friday high (above the sweep).
Target 1: Return to the weekly open area or 1H OB.
Target 2: 23,880–23,900 → previous BPR zone and discount level.
Confluences:
✅ Daily BSL swept.
✅ Asian MSS already occurred.
✅ Price is sitting inside premium & consolidating.
🔍 Watching for SMT divergence between NQ and ES (S&P) – if ES breaks high and NQ doesn’t → bearish confirmation.
Execution:
Will wait for price to spike above the current range (Judas), then confirm BOS/MSS and enter short on the retracement.
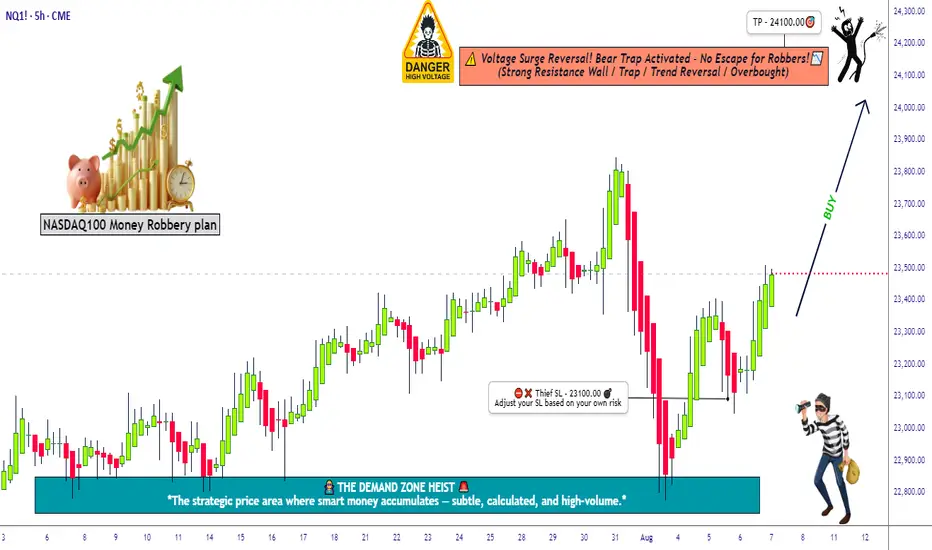
Robbing the Nasdaq Futures | NQ1! Plan with Precise Targets💥🚨NQ1! “E-Mini Nasdaq 100” Heist Alert 🚨💥
🎯Thief Trader Bullish Takeover Plan🕵️♂️📈
🌍 Dear Global Looters & Market Bandits, 💰💸💎
It's time to crack the vaults of the Nasdaq 100 Futures (NQ1!) — Thief-style! No mercy. No fear. Just profits. 🔥
🔓 The digital vault is open — we’re layering multiple limit orders like pros to snatch the tech treasure chest. This isn’t just a trade…
👉 This is an organized robbery of Wall Street’s most elite index. 🏦🕶️
💎 Entry Point = Anywhere on the Grid!
Set your buy limit orders at juicy dips — 15m / 30m / 1H zones, support bounces, or wherever the chart whispers "steal me." 🎧📉
⏰ Stay alert — we don’t chase, we trap. 🐍
🛑 Stop Loss = 23100.00
Set it & forget it below key swing low.
You’re not in this heist to bleed. Risk small. Layer tight. Protect the stash. 🛡️💼
🎯Target = 24100.00
That’s the exit zone before the feds (aka market makers) catch on.
Be smart — take profit early if the heat gets real. 🚓🚨
🧠Strategy Mode: Layering Limit Orders
Thief never enters with one shot. We layer in like ghosts — scaling into value zones, controlling the risk, and building power before liftoff. 🚀📊
This ain’t gambling — it’s structured robbery with exit plans. 🎯💼
🧲 Scalpers & Swingers Welcome!
⚔️ Got big capital? Smash the levels and ride the breakout.
💼 Small cap thief? Ride with the swing crew — safer, smoother, more stealthy.
📍Always use Trailing SL — never let the market take back what you stole. 💰
📰 Market Sentiment: Bullish Bias 😈
AI hype. Earnings season. Rate cuts. You name it — it’s all fueling the Nasdaq rocket.
We’re riding momentum, not hope. This ain’t luck — it’s Thief precision execution.
🔔 Pro Thief Tips:
⚠️ Avoid entries during high-impact news.
🚀 Use alerts. Monitor VIX + QQQ.
💻 Watch for liquidity zones & trap setups.
🚀💣 Smash that 🔥Boost Button🔥 if you love robbing the market like a pro!
Help grow the Thief Trading Crew — one like = one stolen candle from the whales. 💵🦈
We rob institutions, not each other. 💯🤝
Stay locked in — next heist plan coming soon. 📡📈
#NQ1 #Nasdaq100 #EminiFutures #ThiefTrader #RobTheMarket #LayeringStrategy #SmartMoneyMoves #BullishPlan #WallStreetHeist #TradingViewSetup
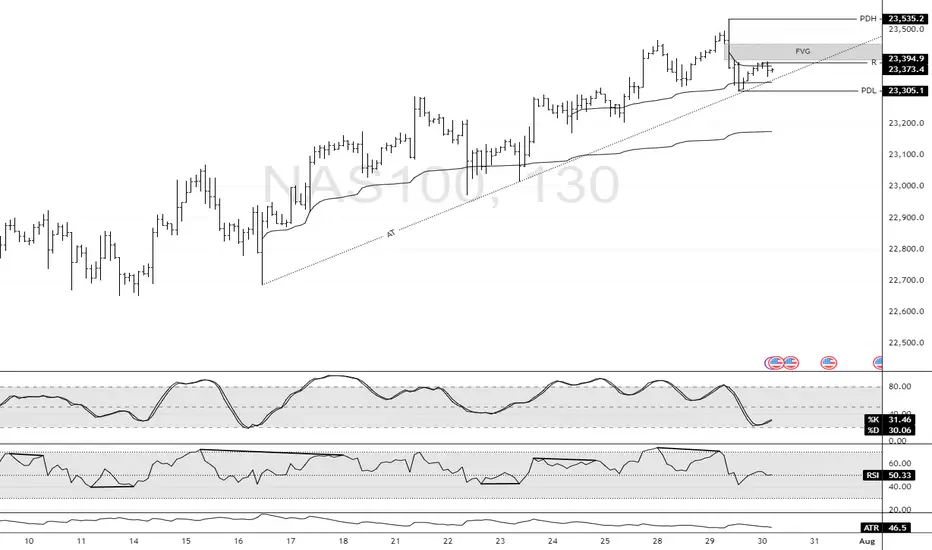
Nasdaq Finds Support at $23,305.0FenzoFx—Nasdaq dipped yesterday and formed a bearish FVG. However, the selling pressure eased as soon as the price tested the ascending trendline.
The last day's low at $23,305.0 is the immediate support. That said, a close above the immediate resistance at $23,375.0 can trigger the uptrend, targeting the highs at $23,535.0.
#NQ1! "E-Mini Nasdaq 100" Index Market Bullish Robbery Plan 🌟Hi! Hola! Ola! Bonjour! Hallo! Marhaba!🌟
Dear Money Makers & Robbers, 🤑 💰💸✈️
Based on 🔥Thief Trading style technical and fundamental analysis🔥, here is our master plan to heist the NQ1! "E-Mini Nasdaq 100" Index Market Heist. Please adhere to the strategy I've outlined in the chart, which emphasizes long entry. Our aim is to escape near the high-risk YELLOW MA Zone. It's a Risky level, overbought market, consolidation, trend reversal, trap at the level where traders and bearish robbers are stronger. 🏆💸"Take profit and treat yourself, traders. You deserve it!💪🏆🎉
Entry 📈 : "The heist is on! Wait for the Crossing previous high (19800) then make your move - Bullish profits await!"
however I advise to Place Buy stop orders above the Moving average (or) Place buy limit orders within a 15 or 30 minute timeframe most recent or swing, low or high level for Pullback entries.
📌I strongly advise you to set an "alert (Alarm)" on your chart so you can see when the breakout entry occurs.
Stop Loss 🛑: "🔊 Yo, listen up! 🗣️ If you're lookin' to get in on a buy stop order, don't even think about settin' that stop loss till after the breakout 🚀. You feel me? Now, if you're smart, you'll place that stop loss where I told you to 📍, but if you're a rebel, you can put it wherever you like 🤪 - just don't say I didn't warn you ⚠️. You're playin' with fire 🔥, and it's your risk, not mine 👊."
📍 Thief SL placed at the nearest/swing low level Using the 2H timeframe (19200) Day trade basis.
📍 SL is based on your risk of the trade, lot size and how many multiple orders you have to take.
🏴☠️Target 🎯: 20500
🧲Scalpers, take note 👀 : only scalp on the Long side. If you have a lot of money, you can go straight away; if not, you can join swing traders and carry out the robbery plan. Use trailing SL to safeguard your money 💰.
💰💵💸NQ1! "E-Mini Nasdaq 100" Index Money Heist Plan is currently experiencing a bullishness,., driven by several key factors. .☝☝☝
📰🗞️Get & Read the Fundamental, Macro Economics, COT Report, Geopolitical and News Analysis, Sentimental Outlook, Intermarket Analysis, Index-Specific Analysis, Future trend targets with Overall outlook score... go ahead to check 👉👉👉🔗🔗🌎🌏🗺
⚠️Trading Alert : News Releases and Position Management 📰🗞️🚫🚏
As a reminder, news releases can have a significant impact on market prices and volatility. To minimize potential losses and protect your running positions,
we recommend the following:
Avoid taking new trades during news releases
Use trailing stop-loss orders to protect your running positions and lock in profits
💖Supporting our robbery plan 💥Hit the Boost Button💥 will enable us to effortlessly make and steal money 💰💵. Boost the strength of our robbery team. Every day in this market make money with ease by using the Thief Trading Style.🏆💪🤝❤️🎉🚀
I'll see you soon with another heist plan, so stay tuned 🤑🐱👤🤗🤩

High Probability Long Position NQHigh Probability Long Position NQ
SL: Swing Low
TP: FE 1.618
Size based on your risk management strategy

High Probability Short Position NQTP: FE 4.618
SL: Swing high
Size based on your risk management strategy

Short position NQShort position NQ high probability setup
SL: swing high
TP: FE 1.618
Size based on your risk management strategy

Short Position High Probability NQShort Position High Probability NQ
TP: FE 1.61
SL: Swing High
Size based on your risk management strategy

NQ High Probability Short TradeNQ High Probability Short Trade
Short position
TP: 20245.75
SL: 20374.25
Adapt the size to your risk management strategy

Intraday Levels for Nasdaq 100 Futures - 12/19/2024This analysis focuses on the Nasdaq 100 Futures, aiming to identify potential support and resistance levels where the price could experience intraday bounces or trend reversals, as well as zones where the price might potentially break higher or move lower.
Considerations
The range used in this analysis serves only as a reference for broader-level insights.
For intraday operations, it is advisable to utilize a lower timeframe to refine entry and exit points more accurately.
To confirm the validity of these levels, it is essential to evaluate real-time conditions as the price approaches these zones. Factors such as pressure, trading volume, and Order Flow will play a critical role in determining whether these supports hold or are likely to be broken.

us100 & NQ pullback retracement of 0.618. If it is a descending wave, then the stop loss is at 50 % 19031.3 retracement and the target is at 1.618."extenxsion 18954.9

NQ-M2024: Q2 positional short trade setuphello TradingView members,
after all kinds of analysis done, when possible future events taken into account, now it is time to translate into risk management analysis and bias. this is related only to the current leg, we may go lower than the target as long the stop-loss is not triggered.
the idea is about sharing this setup is to allow also others to consider a possibility, to think about a scenario that may mature into the right trade setup.
do not treat the whole as holy bible but as risk management practice for a bias. it is just an idea. personally, I do trade this setup also in narrower time frames and I would scalp in addition during the process, but each person has own strategy and own approach to the market and trading the market.
feel free to comment, try to do that in a productive manner, so the oversight over this idea would allow fine tuning and improvements. let us see how the market to show this setup in a hindsight. again, feel free to comment and to contact me directly.
sincerely, all the best,
Fluke

sell limit in us 100a probability of scalp sell in the US100 with risk benefit of 1/5 managing following my trading plan, if for more information do not hesitate to ask

NQ Bull Flag into Demand NQ - Daily - 14350
This is supply and demand to the tee on the NQ daily. You can see 4 days of resistance before price gapped up 580 points before pulling back. We are now retesting this area. After a demand that large, we are bound to see some sort of interest in buying within this area (theoretically).
If we are to bounce on NQ, this is likely the area we'd bounce. Either for a small relief bounce, or a large one. Keep an eye out here tomorrow.

NASDAQ 100 E-mini Futures NASDAQ 100 E-mini FuturesCME_MINI:NQ1!
NASDAQ 100 E-mini Futures
When the Nasdaq market is described as being in a downward direction, it means that the overall trend of the market is experiencing a decline. This downward movement is typically reflected in the broad-based Nasdaq Composite Index, which tracks the performance of thousands of stocks listed on the exchange

NASDAQ 100 E-mini FuturesCME_MINI:NQ1!
Very strong ascent in the direction of the top peaks with the strongest penetration of the display area and resistance

NASDAQ is Correcting - Don't Buy in Short Term
Technical Analysis:
- As you can see in the daily chart, in the very short term we've two possible paths - Path 1 and Path 2
- Today with actual data - the odds for Path 1 is 60% and the odds for Path 2 is 40%
- We expect to buy wave II in red completely around $8,000
Technical Analysis:
- H1 & H4 Right Side is Turning Down

US02Y: BOND MELTDOWN / 4.00% CROSS / MACD CONVERGENCE / RSIDESCRIPTION: In the chart above I have provided a simple MACRO ANALYSIS on current bond market meltdown where the US02Y dropped nearly 25% within FIVE TRADING SESSIONS.
POINTS:
1. US02Y deviation is simple & marked at every 1% difference as bonds rise and fall within the same range percentage therefore it has a rubber band like price action relationship with it's lowest 1% points.
2. Overlapping Orange Line represents ES1! a US Market Future.
3. Dotted Green Lines represent continuous downward momentum in past Bear Markets (2002 & 2008).
4. Bubbles overlapping dotted green lines represent initial break of supporting bond percentage %.
IMO: In my opinion the most concerning factor to take into consideration when it comes to current bond positioning is the STEEP RISE IN PERCENTAGE especially when the overall US market momentum is tied to BOND PERCENTAGE during both RISES & FALLS & the STEEPER THE INCLINE THE STEEPER THE DECLINE can become.
MACD: Notice a complete meltdown of Bonds when MACD confirms convergence to MEDIAN & eventually breaks past median and falls into into negative territory.
RSI: Notice that unlike in other recessions RSI levels have seen more consistent exposure to MEDIAN of 50. But as of lately from a MACRO perspective that is not the case as we have seen current RSI levels linger around 70 or above in EXTREMELY OVERBOUGHT TERRITORY.
SCENARIO #1: In a very BEARISH scenario we come to see BONDS PERCENTAGE go through a complete free fall.
SCENARIO #2: In a less BEARISH scenario we come to see BONDS PERCENTAGE go through an extended consolidation phase with PERCENTAGE LINGERING ABOVE 4%.
FULL CHART LINK: www.tradingview.com
TVC:US02Y

NASDAG SELLPeace be upon you, merchants. The Nasdaq market is in a negative state. with a fracture. Model double BOTTOM. As well as breaking the bullish trend. There is a possibility of re-testing. The price is 122800. and re-descend. to the level of 11800

NASDAQ 100 E-MINI FUTURESNASDAQ 100 E-MINI FUTURES
Sharp and strong landing, which means it's going to the bottom peaks as targets with all the strength.

NASDAQ 100 E-MINI FUTURESNASDAQ 100 E-MINI FUTURES
We expect very strong landing traffic to bottom points or bottoms that we consider to be great targets

NASDAQ 100 E-MINI FUTURES
NASDAQ 100 E-MINI FUTURES
Change in direction strongly with the formation of a strong and effective Double toop pattern and is proof of strong bear motion
