Nqfutures

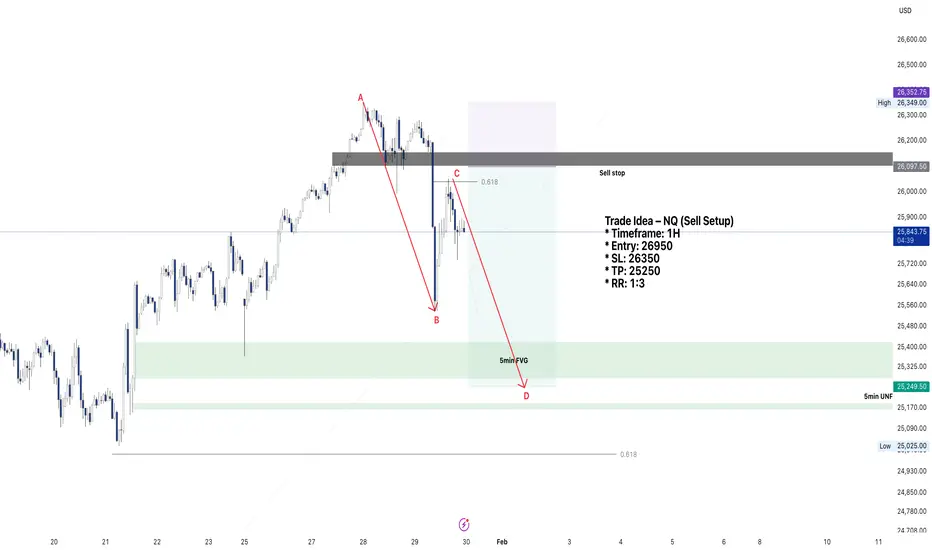
NQ Sell Setup – Dead Cat Bounce After BOS (1H, 1:3 RR)Trade Idea – NQ (Sell Setup)
* Timeframe: 1H
* Entry: 26950
* SL: 26350
* TP: 25250
* RR: 1:3
- We dropped from 26349 to 25536 after moving from the Jan2026 lows near 25000 to the Jan highs at 26349, which marked a 0.618 Fib retracement.
- From the sharp sell-off between 25536 and 26050, price has already completed another 0.618 retracement, which I consider a classic dead cat bounce.
- The break of structure (BOS) was confirmed once we closed below 26,100, so this move back to 26050 is corrective rather than impulsive.
- The decline from 26349 to 25536 formed Wave A to B. After the current 0.618 retracement up to 26050, I expect price to complete Wave C to D, targeting the 25250 area.
- The RR setup is excellent, with approximately 255 points of stop loss versus 848 points of potential profit, giving a 1:3 RR.
- There is also a strong probability of a deeper move back toward 25000, which aligns with the 0.618 Fib retracement from the Nov 2025 lows to the Jan 2026 highs.
Short setup on NQI see a beautiful and most probable short setup on NQ in 4HR TF.
Entry: 25800-25700
SL: 26050
TP: 24750
RR: 1:3RR

NQ Short setup on 1HR Bearish DivergenceNQ Short setup on 1HR Bearish Divergence
Entry: 25447
SL: 25835
TP: 24282
RR: 1:3

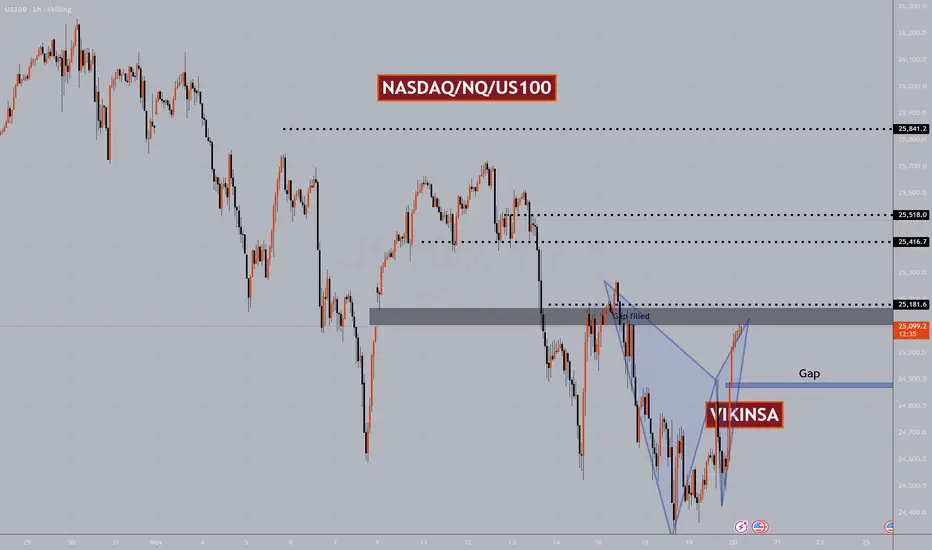
NASDAQ $NQ US100 Major Levels And PatternsNasdaq bounced yesterday heavily and completed a W pattern. I personally have been able to capture majority of this move. You can consider yesterday's W pattern a sort of double bottom which means hat more bullishness is expected in the medium term.
On a short term, now that it has completed a W pattern and reached previous important zone which had a gap, so we can expect a correction here but this may not be a big one. In a rare case there may not be any correction here at all because NASDAQ is forming a pattern which when forms usually ignores all the smaller W and M patterns.
For that reason my Bias is bullish and I will look for buying opportunities mostly.
There are certain Higher time frame levels that I am watching closely which you will find on the chart.
Trade what you see, manage the risk.
Follow for more. Please support this analysis by liking, commenting, and sharing with friends, colleagues, traders, and trading communities. Thanks👍🙂
NQ - Sub Dividing Elliott Wave CountIs this possible? Multiple 1st and 2nd wave sub divisions, a small 3rd wave, and then again multiple 4th and 5th wave sub divisions.

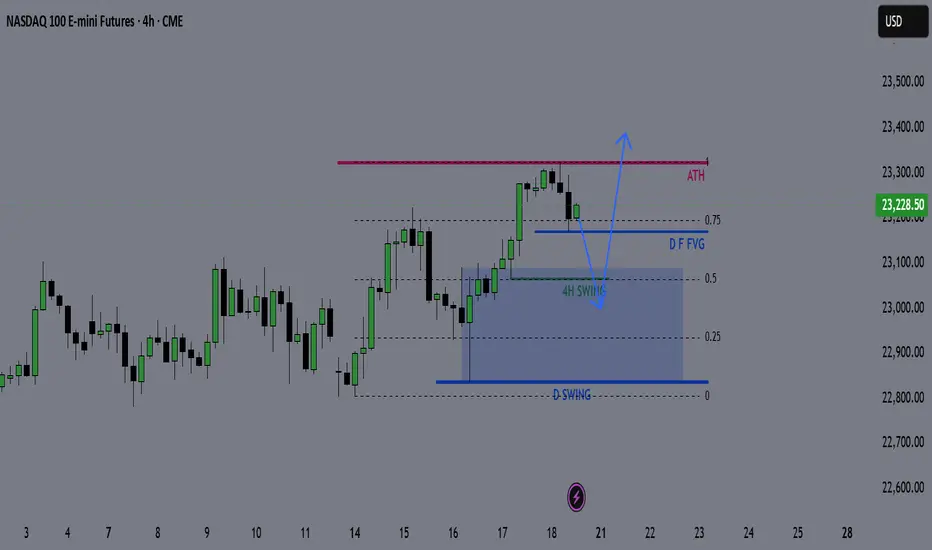
NQ Weekly Outlook & Game Plan 20/07/2025NQ Weekly Outlook & Game Plan
🧠 Fundamentals & Sentiment
Market Context:
NQ continues its bullish momentum, driven by institutional demand and a supportive U.S. policy environment.
📊 Technical Analysis:
Price is currently in price discovery, and the weekly structure remains strongly bullish — so I prefer to follow the strength.
We might see a minor retracement before pushing further above the all-time high (ATH).
🎯 Game Plan:
I'm expecting a potential retracement to the 0.5 Fibonacci level, which is the discount zone in a bullish environment.
Interestingly, the 4H liquidity zone aligns perfectly with the 0.5 Fib level — this confluence suggests price may gather enough energy from there to make new highs.
✅ Follow for weekly recaps & actionable game plans.
NASDAQ: Minor Pullback, Still on TrackOn Friday, the Nasdaq experienced a slight pullback, which was quickly absorbed at the start of the week. Currently, the index is still developing the turquoise wave B, which should top out just below resistance at 23,780 points, signaling the start of the bearish wave C. This move should lead to the low of the magenta wave (4) within our turquoise Target Zone between 17,074 and 15,867 points. Alternatively, there is a 42% probability that wave alt.(4) is already complete. In this scenario, the magenta wave alt.(5) could carry the index immediately above the mentioned resistance.
📈 Over 190 precise analyses, clear entry points, and defined Target Zones - that's what we do.

NQ KEY ICT LEVELS - 21st APRIL 2025Levels marked on the chart using my free indicator which marks out all of the ICT key levels which can be used for potential POIs where price might react

High Probability Long Position NQHigh Probability Long Position NQ
SL: Swing Low
TP: FE 1.618
Size based on your risk management strategy

High Probability Short Position NQTP: FE 4.618
SL: Swing high
Size based on your risk management strategy

Short position NQShort position NQ high probability setup
SL: swing high
TP: FE 1.618
Size based on your risk management strategy

Short Position High Probability NQShort Position High Probability NQ
TP: FE 1.61
SL: Swing High
Size based on your risk management strategy

NQ High Probability Short TradeNQ High Probability Short Trade
Short position
TP: 20245.75
SL: 20374.25
Adapt the size to your risk management strategy


NQ Weekly, Daily & 4 HR Chart Bullish Confirmation for Sun MonLooking for a bounce after 3 straight weeks of lower prices here starting with Sunday night's open barring any Trump/geopolitical news. Monday is a No Red Folder News Day, which also makes it look good for the longs. However, starting on Tuesday and for the rest of the week, we have red folder news every day...
Tue
Mar 11
10:00am
USD
JOLTS Job Openings
Wed
Mar 12
8:30am
USD
Core CPI m/m
Thu
Mar 13
8:30am
Core PPI m/m
PPI m/m
Unemployment Claims
226K 221K
Fri
Mar 14
10:00am
USD
Prelim UoM Consumer Sentiment
Prelim UoM Inflation Expectations

Intraday Levels for Nasdaq 100 Futures - 12/05/2024This analysis focuses on the Nasdaq 100 Futures, aiming to identify potential support and resistance levels where the price could experience intraday bounces or trend reversals, as well as zones where the price might potentially break higher or move lower.
Considerations
To confirm the validity of these levels, it is essential to evaluate real-time conditions as the price approaches these zones. Factors such as pressure, trading volume, and Order Flow will play a critical role in determining whether these supports hold or are likely to be broken.

Chart Idea - Swing Long on NQSwing Long Setup
Entry - 21200
SL - 19900
TP - 23600
RR - 2:1
Not a financial advice... Do your own research !!

Chart Idea - NQ Swing TradeBeautiful Descending Broadening Wedge formed on Daily TF. Too bullish once breakout gets confirmed.
Entry: 19500
SL: 19000
TP: 21000
NOT A FINANCIAL ADVICE!!
------ DYOR ------

NQ Futures Daily Bullflag to $22,000After a sudden drop from ATHs and a big rebound, a daily bullflag formed into month end setting September up for a very big run.
Upside PTs are: 20150, 20300, 20450, and 22000 if a break above the previous ATH to finish out the bullflag
SL would be invalidation of the flag

SELL NASDAQYesterday I posted to sell NASDAQ and got our TP reached, we're selling again today but this time with a big target and high risk.
You can sell NASDAQ with a low leverage and set your TP and SL as shown on the chart.

NQ | QQQ | Day trading plan 7-26-2024CME_MINI:NQU2024
Bullish Scenario
Immediate Resistance Levels:
Bullish Line: : 19,115.75
Target Price 1: 19,168.75
Target Price 2: 19,278.50
Strategy:
Entry: Consider entering a long position above the immediate resistance at 19,115.75.
Stop Loss: Place a stop loss below the nearest support at 19,041.75 to minimize risk.
Targets: Set targets at the resistance levels mentioned above. Partial profit-taking can be considered at each target level.
Confirmation: Look for bullish candlestick patterns or confirmation from volume indicators before entering the trade.
Bearish Scenario
Immediate Support Levels:
Bearish Line: 19,065.00
Target Price 1: 19,041.75
Target Price 2: 18,998.75
Target Price 3: 18,932.00
Strategy:
Entry: Consider entering a short position if the price breaks below the Bearish Line at 19,065.00.
Stop Loss: Place a stop loss above the nearest resistance at 19,115.75 to minimize risk.
Targets: Set targets at the support levels mentioned above. Partial profit-taking can be considered at each target level.
Confirmation: Look for bearish candlestick patterns or confirmation from volume indicators before entering the trade.
Summary
Bullish Entry: Above 19,115.75 with targets at 19,168.75 and 19,278.50.
Bearish Entry: Below 19,065.00 with targets at 19,041.75, 18,998.75, and 18,932.00.
Stop Losses: Adjust according to the nearest support/resistance levels to manage risk.
This analysis should be used in conjunction with other indicators and market conditions for a comprehensive trading strategy.

7/10 To Soar or Not to Soar Is the Question .GREATTTTTTTTTTTTTTTTTTTTTTTTTTTTTTTTTTTTTTTTTT MORNING YALLLLLLLLLLLLLLLLLLLLLLLLLLLLLLL!!!!!
😏 😏 😏
07/10/2024
**News** ON THE BLOCK TODAY!!!!
**~~Wholesale Inventories (Preliminary)~~**
10:00 AM ET
***EIA Petroleum Status Report***
10:30 AM ET
***Midnight*** **CONSENTRATED CONSOLIDATION **
*#ES 5634.25*
*#NQ 20709.50*
💰 **BUYSIDE**💰
***#ES 5646.5***.--->Above this level we look for --->....
🟢 5653.25
🟢 5676.85
🟢 5694.75
🟢 5711.25
🟢 5727.50
🟢 5738.25
***#NQ 20772.00***...---> Above this level we look for-->
🟢 20788.50
🟢 20813.00
🟢 20843.75
🟢 20878.00
🟢 20902.25
🟢 20933.25
💰 **SELLSIDE**💰
***#ES 5630***--- Below this level and we look for
🔴 5616.75
🔴 5604
🔴 5580
🔴 5564.50
🔴 5550.25
***#NQ 20696.50***---> Below this level and we look for
🔴 20685
🔴 20656
🔴 20639
🔴 20619
🔴 20594
