NIFTY 50 - YEAR END CONSOLIDATION📊 NIFTY 50 TECHNICAL UPDATE: YEAR-END CONSOLIDATION PHASE
Indian markets are wrapping up 2025 in a period of consolidation. While the long-term trend remains bullish, the Nifty 50 is navigating a narrow range as we head into the final week of the year.
📉 CURRENT PRICE ACTION
Close: 26,042.30 (-0.38%)
Volatility: The index is finding significant buying interest near its 50-day EMA.
Volume: Trading volumes are thin due to the holiday season, which can lead to erratic moves.
🚀 CRITICAL LEVELS TO WATCH
UPWARD RESISTANCE
Primary Target: 26,166 – 26,245 (Needed to revive the rally)
Major Hurdle: 26,300 – 26,400 (Recent historical highs)
DOWNWARD SUPPORT
Immediate Floor: 26,000 – 25,950 (Psychological level)
Crucial Base: 25,830 – 25,700 (Break below this could trigger a correction)
📈 INDICATORS AND MOMENTUM
Moving Averages: Trading above the 200-day EMA (~24,880), showing long-term health is intact.
RSI: The 14-day RSI has slipped to 41.7, signaling a move into a neutral-to-cautious zone.
🔍 SECTORAL OUTLOOK AND STRATEGY
Drags: Heavyweight Banking and IT stocks like HDFC Bank and TCS are seeing profit booking.
Gains: Defence and FMCG sectors, including HAL and Titan, continue to show strength.
Strategy: A "wait-and-watch" approach is recommended. A bounce from 26,000 could target 26,550 in January.
#Nifty50 #StockMarketIndia #Nifty #NSEIndia #BankNifty #TradingStrategy #TechnicalAnalysis #InvestingIndia #Sensex #NiftyNextWeek
Nseindia

Review and plan for 24th December 2025 Nifty future and banknifty future analysis and intraday plan.
stocks- shriramfin, nmdc.
This video is for information/education purpose only. you are 100% responsible for any actions you take by reading/viewing this post.
please consult your financial advisor before taking any action.
----Vinaykumar hiremath, CMT

Nifty 4h Chart Analysis: Bullish ScenarioNifty 4h Chart Analysis: Bullish Scenario
*Last Friday's aggressive rejection from 71% fib level(red Fib levels) sent us below last week candle Low.
*Next Support level is Nov3rd down close candle, marked with Green rectangle on weekly chart on Right side +OB(W)
*Mid point of that green rectangle will be a good spot for longs, which is 71% fib level on yellow fib fib
***If market do not show any kind of reversal on that level expecting SellSide Liquidity as next downside target

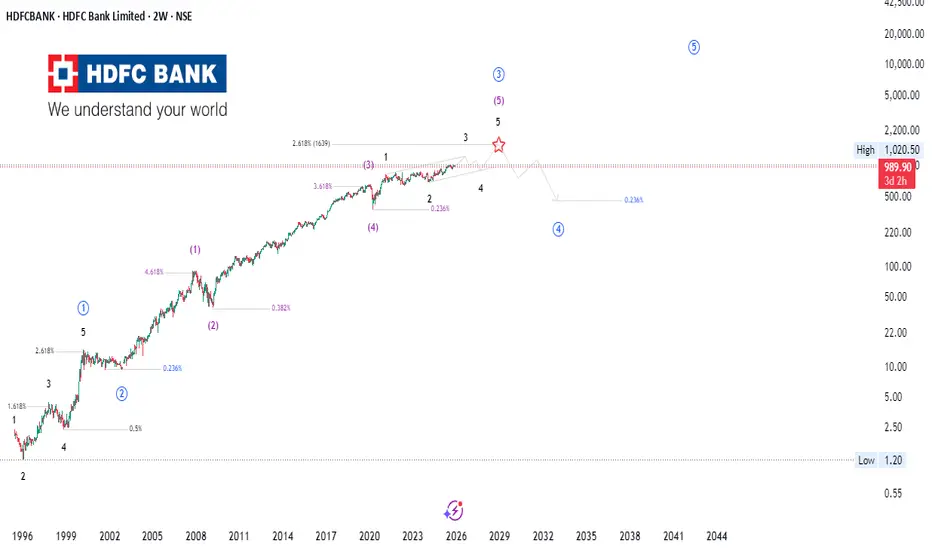
HDFC Bank | Wave-5 Exhaustion or Structural Re-Accumulation?This multi-decade chart of HDFC Bank reflects a compelling confluence of Elliott Wave Theory, Smart Money Concepts (SMC), Price Action, and Fibonacci symmetry —all signaling a maturing macro structure as the market approaches a probable Wave-5 terminal zone.
📈 Institutional Market Structure Outlook
The long-term advance appears to be unfolding within a clean 5-wave impulsive cycle , with the current structure showing:
Wave 3 projecting into the 2.618 extension zone—typical of strong institutional momentum.
A developing Wave-5 that aligns closely with prior impulse proportions, indicating possible trend exhaustion .
Clear structural higher highs and higher lows , yet momentum divergence around the projected terminal region (marked with ⭐), hinting at distribution.
🧠 Smart Money & Price Action Confluence
Price is entering a region historically associated with premium pricing —an area where Smart Money prefers to offload positions.
Multiple internal liquidity grabs near the highs suggest engineered wicks before a potential macro correction.
Market behavior resembles a buy-side liquidity sweep , followed by early signs of distribution on lower-timeframe structures.
🔢 Fibonacci Confluence & Market Cycle Alignment
Long-term impulses consistently respect 1.618 / 2.618 extension geometry.
The projected corrective leg ( Wave 4 ) aligns with the 0.236–0.382 retracement cluster, forming a probable demand re-accumulation zone.
Broader cycle rhythm hints at a transition from growth > distribution > mean reversion before Wave-5 completion.
🔮 What to Monitor Next
Reaction at the terminal Wave-5 zone
Breakdown of internal structure (SMC CHoCH/ BOS)
Volume profile shifts indicating institutional distribution
Retracement into the 0.236–0.382 macro demand zone for long-term opportunities
🚀 Stay Ahead of the Curve
For more institutional-grade analysis, follow our TradingView profile and turn on alerts 🔔 to never miss actionable insights on market structure, macro waves, and smart-money footprints.
⚠️ Disclaimer
This is not financial advice . The analysis is for educational purposes only. Markets are unpredictable—always conduct your own research before taking positions.
Nifty50 4hr Chart Analysis-Nov 30, 2025Nifty50 4hr Chart Analysis-Nov 30, 2025
Case1:
*Expecting 4hr to drop to Daily Support Level (iFVG-D), which almost 50% of current range.
Case2:
*If nifty goes for a deeper retracement then expecting 0.79 which is also a 4hour Support level (+OB-4hr)

NIFTY 50: Navigating the Past Year’s Volatility for Future Gains
Title:
NIFTY 50: Navigating the Past Year’s Volatility for Future Gains
Greetings, Traders!
🌟 Hello everyone,
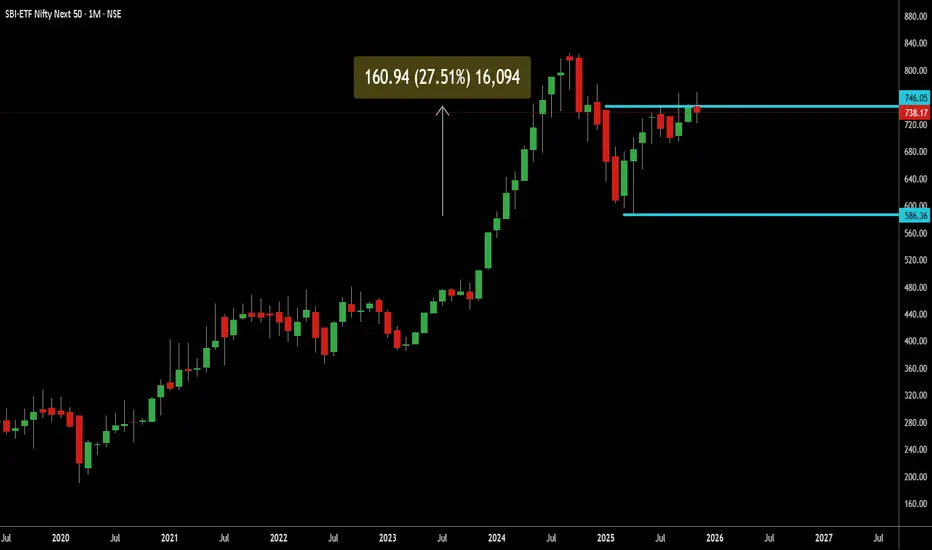
Over the past year, NIFTY 50 has shown significant volatility, with a notable decline and subsequent recovery. Understanding this movement can help traders make informed decisions for future opportunities.
$NIFTY50
Key Observations:
- From January to the present, NIFTY 50 experienced a fall of approximately **27.51%**, dropping from **738** to **586**.
- Many traders who entered positions in January may feel that returns have been stagnant, but the key is to recognize the value of averaging down during market corrections.
- By strategically adding to positions during declines of **10-15%**, traders can effectively lower their average cost basis, setting the stage for stronger returns as the market recovers.
Technical Analysis:
The current price of NIFTY 50 stands at **746**, and technical indicators suggest that there is potential for further upside. A move towards **840** is likely, and beyond that, the index could continue climbing higher. This indicates a promising upward trend in the longer term.
Fundamental Factors:
While technical patterns guide short-term strategies, fundamental factors such as economic growth, corporate earnings, and macroeconomic conditions support the long-term bullish outlook for NIFTY 50. A consistent **15% CAGR** over time can contribute significantly to wealth accumulation.
Trading Strategies:
To capitalize on these insights, traders may consider adopting a disciplined approach:
- Averaging down during market dips to reduce cost basis.
- Holding positions for the long term to benefit from the market’s recovery and growth.
- Monitoring key resistance levels, such as **840**, and preparing for further upside.
In Conclusion:
NIFTY 50’s past year of volatility highlights the importance of patience and strategic investment. By leveraging market dips and maintaining a long-term perspective, traders can achieve substantial growth and build wealth over time.
Engage with Us:
🟢 If you find this analysis insightful, please give it a LIKE.
🟡 Don’t forget to FOLLOW for more updates.
🔵 SHARE with fellow traders who might benefit from this information.
🔴 Feel free to COMMENT with your thoughts and insights!
Your active participation enriches our trading community, fostering knowledge exchange and collective growth. Share your feedback and ideas in the comments below or by boosting this post.
Looking forward to connecting with you in the next post.
Happy trading!
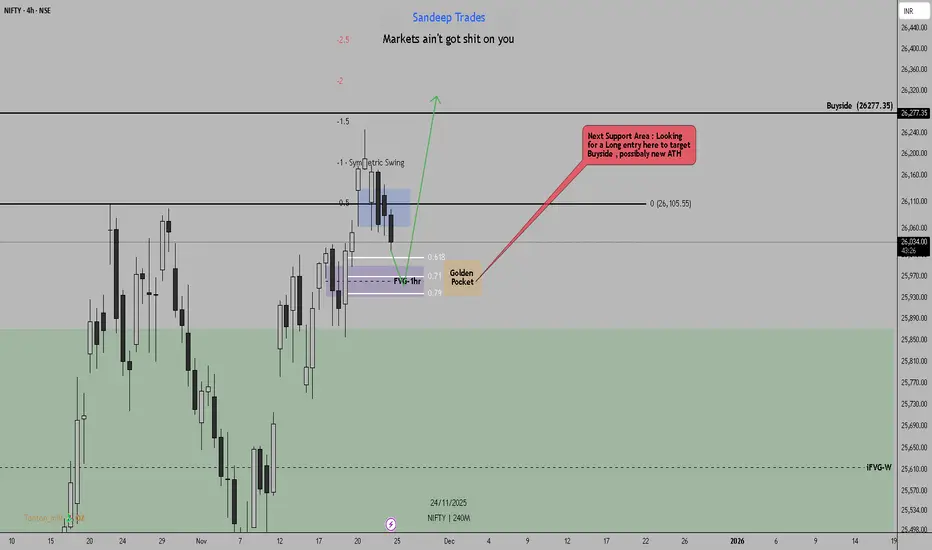
Nifty50 4Hour Chart Analysis: Setup Longs Nifty50 4Hour Chart Analysis: Setup Longs
*4hr iFVG(Purple rectangle) which is also Golden Pocket area on Fib retracements.
*Will be looking for a long setup there to target Buyside(previous ATH)
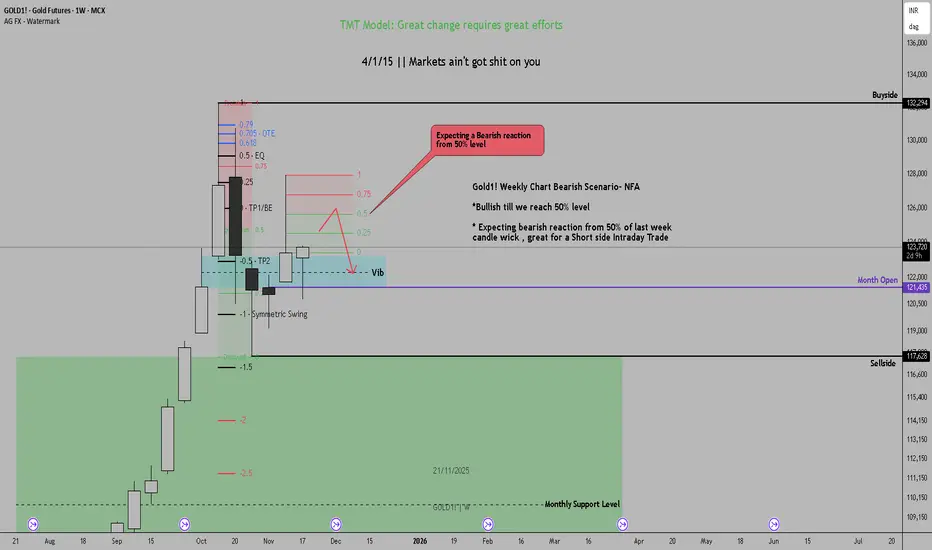
Gold1! Weekly Chart Bearish Scenario- NFAGold1! Weekly Chart Bearish Scenario- NFA
*Bullish till we reach 50% level
* Expecting bearish reaction from 50% of last week candle wick , great for a Short side Intraday Trade
NIFTY 50 Bullish Scenario: Weekly ChartNIFTY 50 Bullish Scenario: Weekly Chart
* Expected next couple of weeks Bullish and upside target is 26277.
* We might get a retracement day when we hit previous short term high (27107.10) which will be a good opportunity to add longs for
*Area market with green rectangle is SR flip/Support , price recently showed are strong upside reaction from this are.

THYROCAREThyrocare technologies Ltd has breakout ATH and 4 years round pattern breakout so if stock come for retest level then entry will triggered.
This is just for educational purpose and not any buy and sell recommendation

CITY UNION BANK LTD5 Years resistance level breakout with good volume
This is just for educational purpose and not any buy and sell recommendation

PHOENIXThis stock has good consolidation level breakout and further up to move will come TGT up ATH
and this is just for educational purpose only

TCS 60 MINS TIME FRAME MY VIEW The Structure looks good to us, waiting for this instrument to correct and then give us these opportunities as shown on this instrument (Price Chart).
Note: Its my view only and its for educational purpose only. Only who has got knowledge about this strategy, will understand what to be done on this setup. its purely based on my technical analysis only (strategies). we don't focus on the short term moves, we look for only for Bullish or Bearish Impulsive moves on the setups after a good price action is formed as per the strategy. we never get into corrective moves. because it will test our patience and also it will be a bullish or a bearish trap. and try trade the big moves.
We do not get into bullish or bearish traps. We anticipate and get into only big bullish or bearish moves (Impulsive Moves). Just ride the Bullish or Bearish Impulsive Move. Learn & Know the Complete Market Cycle.
Buy Low and Sell High Concept. Buy at Cheaper Price and Sell at Expensive Price.
Please keep your comments useful & respectful.
Keep it simple, keep it Unique.
Thanks for your support
Tradelikemee Academy
Saanjayy K G

TATASTEEL LTD 240 MINS TIME FRAME - MY VIEW ONLYThe Structure looks good to us, waiting for this instrument to correct and then give us these opportunities as shown on this instrument (Price Chart).
Note: Its my view only and its for educational purpose only. Only who has got knowledge about this strategy, will understand what to be done on this setup. its purely based on my technical analysis only (strategies). we don't focus on the short term moves, we look for only for Bullish or Bearish Impulsive moves on the setups after a good price action is formed as per the strategy. we never get into corrective moves. because it will test our patience and also it will be a bullish or a bearish trap. and try trade the big moves.
We do not get into bullish or bearish traps. We anticipate and get into only big bullish or bearish moves (Impulsive Moves). Just ride the Bullish or Bearish Impulsive Move. Learn & Know the Complete Market Cycle.
Buy Low and Sell High Concept. Buy at Cheaper Price and Sell at Expensive Price.
Please keep your comments useful & respectful.
Keep it simple, keep it Unique.
Thanks for your support
Tradelikemee Academy
Saanjayy K G

Denta Water & Infra Solutions Ltd <>Returns Chart shared on July 16th has already yielded a 20%+ return. Analysis suggests the stock should consolidate at its current high level after the recent steep rise, followed by a potential breakout.

GRMOVER - UPTREND BUY Stock Name - GRM Overseas
Trade Setup :
Weekly - Uptrend & Fibonacci Golden ration activated .
Day - Uptrend Continue
Suggestion :
Wait for Retest Or Retracement ..
Entry - 205 Rs
Stoploss - 176 Rs
Target - 264 Rs
Expected - 28 % Return ...
Happy Trading - Thank you ..

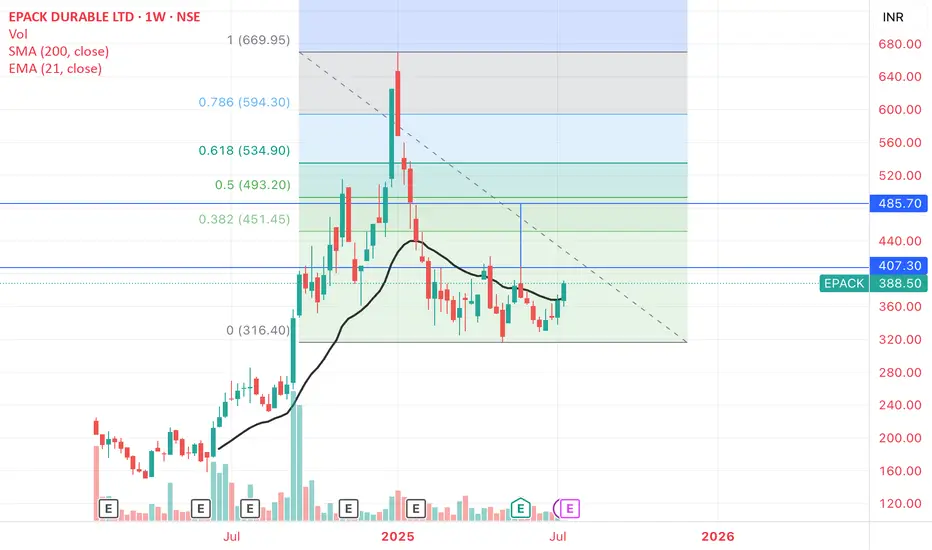
E-PACK_ Potential Double Bottom and TargetsE-PACK DURABLE: Potential Double Bottom with Resistance 407-410 zone.
Weekly close above it - Target 480-490 , that is also the 50% retrace Fib Level of the entire fall from the peak
Weekly close and support held at 407-410 matters
DENTA – SMC & Breakout Structure Analysis (Jul 2025)Accumulation/Distribution: Long consolidation near ₹270–₹311
Break of Structure (BOS): Trendline breakout + recent close above prior top
Neutral toward Bullish: Awaiting volume and price action confirmation to validate trend shift
1. Defined Range Structure
Support ~₹270 (red line) holding over 4+ months
Resistance ~₹311–₹315 (blue line) tested multiple times before today
2. Possible Breakout Attempt
Price has breached the descending trend line—an early mark of bullish structure shift
Close is marginally above resistance, but lacks volume confirmation for breakout validation
3. Volume & Confirmation
No substantial volume spike yet—breakouts typically require accompanying volume
Watch for multi-session closes above ₹315 with sustained volume to support continuation
4. Pullback as an Opportunity
Retracing into ₹305–₹310 could form a higher-low
Such a move would align with healthy trend behavior, offering clearer structure and stronger validation

EDELWEISSAfter a strong uptrend , Price consolidated near the resistance forming a tight closing base
Price is breaking out of the range.

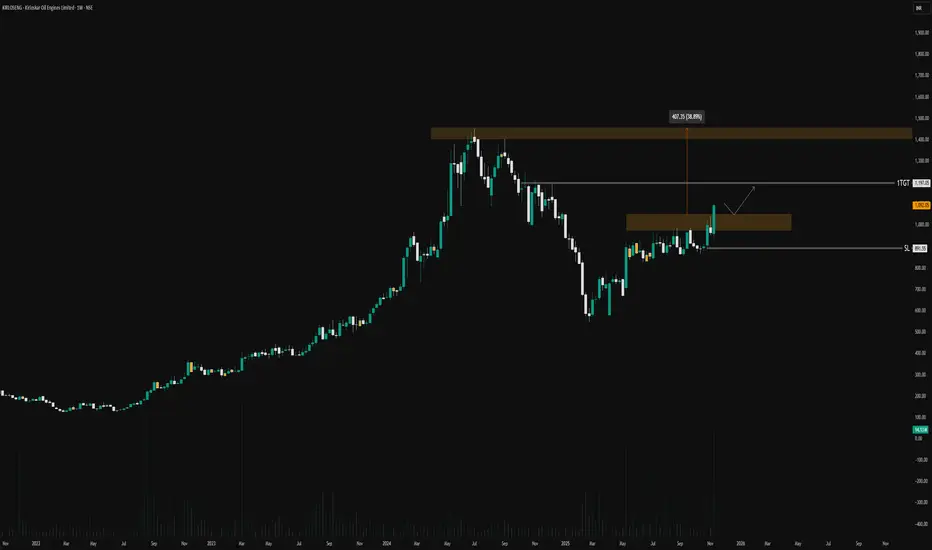
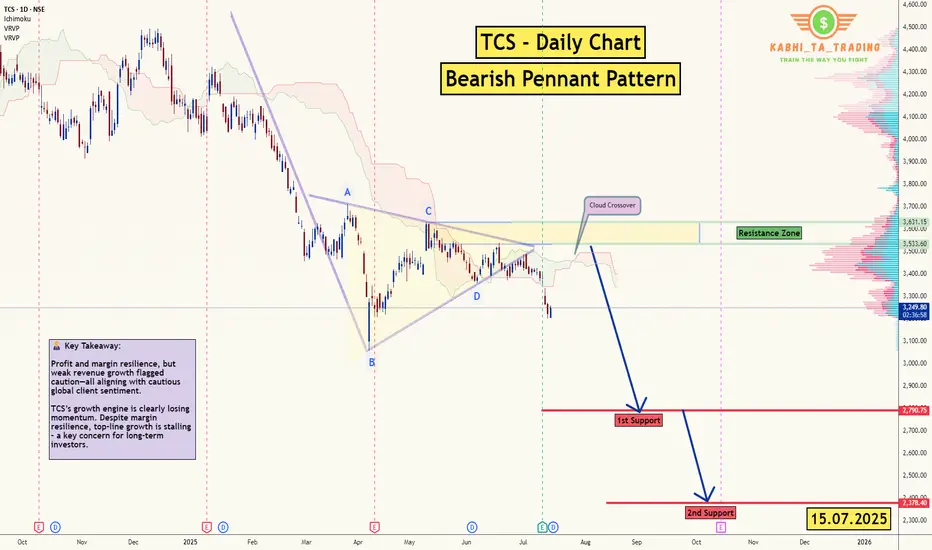
TCS - D1 - Bearish Pennant 🧾 1. 📊 Q1 FY26 Earnings Summary
i. Revenue: ₹63,437 cr (~US $7.4 bn), up just 1.3% YoY, missing expectations of ~₹64,667 cr
ii. Profit/margin held up; revenue disappointed.
📌 Key Takeaway: Profit and margin resilience, but weak revenue growth flagged caution—all aligning with cautious global client sentiment.
🔮 2. Upcoming Events & Catalysts :
Ex‑Dividend Date: Record date July 16, for interim dividend of ₹11/share.
Macro Cues: U.S. tariff developments, global IT spend trends, and sector peers (HCL, Infosys) Q2 reports. Reflation in IT services could shift sentiment.
TCS Investor Engagements: Gen‑AI STEM program (Jul 9); presence at global fintech & life‑sciences events through Sep (SIBOS, COBA) .
📆 3. Catalysts Ahead :
Global IT Budget Trends (esp. U.S. and Europe) → direction for next‑quarter bookings.
Peer Q2 Results (HCL, Infosys) → could provide broader sector cues.
New Deal Wins from BFSI/USD clients → margin & growth potential.
Macro Developments: Trade policies, Fed signals, and inflation data.
Thank you.
AMBUJA CEMENT FOR SWINGA Good opportunity in Ambuja Cement for swing trade, weekly resistance break and retesting, so add in your watchlist.

NIFTY is Testing its long term Trend Line.I’ve been keeping an eye on the ‘Watch Out’ area and the trend line that’s being tested. I’ve been following this trend line for a while now, and I’m excited to share some potential scenarios that could unfold in July.
Here are a few things to keep in mind:
1. The 25450 - 25550 range could become a key resistance and support area.
2. If NIFTY successfully retests this trend line and shows some upward movement, the next target could be 26000. In this case, I would recommend buying July 26000 Call options.
3. If NIFTY can’t hold this retest (which is less likely given NSE:NIFTY the current bullish market sentiment), our next watchout zone could be 25000 - 24800.
4. We might even be seeing an all-time high NIFTY soon!
Disclaimer: Please do your own research before investing. This is just my personal opinion, and I don’t force anyone to invest based on my ideas.
