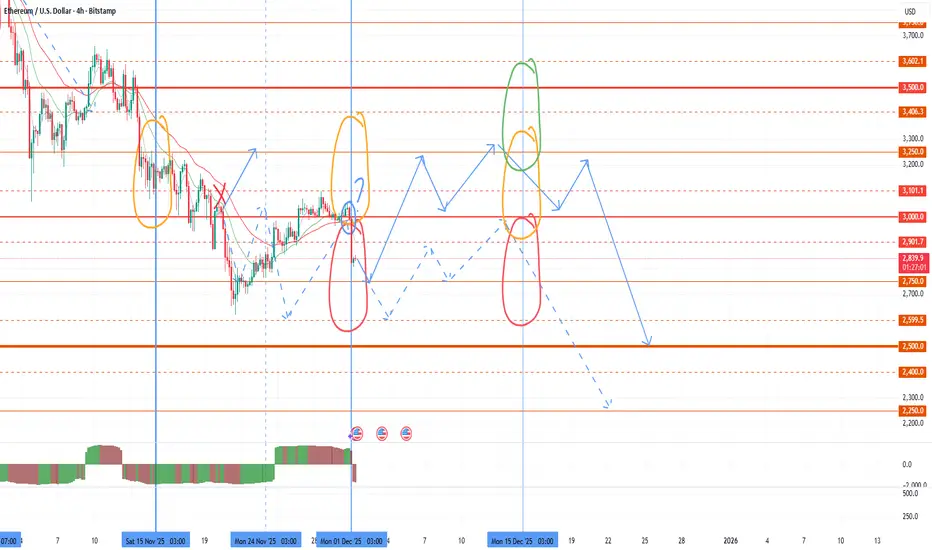
Growth up to 200% according to NFPTo date, the market continues to move exactly according to the scenario that I outlined in the last review. On Monday and Tuesday, the probability of a flat with sales attempts prevails, but from the middle of the week I expect the bullish trend to continue as part of a pullback on the annual candle and seasonal growth with an attempt to consolidate in the range of 3250-3500 ETH.
This week, NFP and SHELL reached medium-term supports, which I am now taking into account to work alongside TURTLE NTRN MITO VIC ENSO HOOK BMT. At the moment, 50% of tokens are already in circulation with further smooth unlocking, which will put minimal pressure on the price. In the future, the area for reliable scalping will shift slightly next year. For this instrument, there are long-term technical signals for growth up to 0.35-45, that is, 10X+. However, with the current bear market, we can still expect an attempt to retest the 0.060-75 range with a further pullback and resumption of growth in a new annual candle, which can already bring up to 150% profit. The intermediate resistance is the 0.05 level. If the daily or weekly candle opens higher, an active continuation of growth is likely. The opening of the second half of the month above this level will also be a signal for support.
Ntrn

An Attempt at Seasonal Market Growth and BTC RollbackTo date, we have reached another bifurcation point in the market and it's time for another review. So far, there is a share of positivity in the market situation. As I wrote earlier, there is strong medium-term support for BTC in the 85-90k zone, from which a rollback is likely. Unfortunately, last month we broke through the 85k level, which is a signal for a possible test of 75k in the spring. However, the probability of a rollback from 85k to 90-100 still prevails. The broadcast opened the month ambiguously. According to Asian time, the opening is in the negative zone below 3000, higher in the neutral zone at GMT. I think the market will move this month based on the bullish BTC signal, and the coins will continue to move in different directions.
The seasonal growth period in the first half of December is also a positive signal. Once again, I would like to draw attention to the background trigger used by the United States to manipulate the market - brent oil. At the last bifurcation point, prices still collapsed, despite the positive data on US stocks, to which ETH immediately reacted with a consolidation below 3k, as I warned in the review. The current monthly candle opened above the interim support of $ 62.5, against which there is a signal for growth in the first half of the month at least.
As a result, we have signals for new growth waves for individual altcoins that have reached supports and have high growth goals, as part of seasonal growth, attempts to rollback BTC with oil and rollback according to the annual schedule. However, most of the alcoins, especially those with high capitalization or upcoming aggressive issuance, will not have time to show significant growth in this short period and will continue the medium-term bearish trend. Be careful with new purchases in the next couple of weeks. Today - tomorrow is the time when coins draw a shadow down the new monthly candle, but starting tomorrow evening or Wednesday, the probability of a reversal for individual coins will increase. If positive oil data is released in the middle of the week, then the growth of the crypt is likely to accelerate steadily by the end of the week, with a continuation in the next weekly candle. Next, the opening zone of the second half of the month will be of great importance.
For altcoins, in the event of a reversal attempt, the minimum target will be to overshoot the last monthly candle. For work today, I am considering the TURTLE NTRN ENSO VIC MITO BMT HOOK first of all. These tools were recently listed on binance, which reduces the threat of delisting hanging over projects from 20-22. The issue of these instruments is also smooth, which reduces the likelihood of further large drawdowns. Given today's circulating supply, these instruments are already in an oversold position and the likelihood of a reversal to growth at the slightest provocation from the market prevails. They also previously provided strong technical signals for growth up to 300%+, which will be worked out in the medium term.
Secondly, I am considering CHESS UTK COS DATA QUICK FIO for scalping, which can give new growth waves of up to 40-50% at least, but I recommend using a smaller position size for them. CHESS has been assigned the monitoring tag, but there are strong technical signals for a 0.1 retest, which is why a large exit pump is likely. After that, I will no longer consider using the token.
ENSO has found the bottom and is ready for growthIn addition to NTRN, I've hired ENSO today. It differs from NTRN by a significantly lower percentage of tokens in circulation, which will put pressure on the price and the dynamics will probably be smoother. Until October next year, emissions will be slow, exerting little pressure. In the future, I will indicate the target purchase and profit-taking zones for safe scalping in the form of inclined ranges that take into account the issue. At each test of the upper limit of profit taking, there is also an opportunity to work out long-term technical goals, according to ENSO, this is a retest of the range 1.75-2.5. After working out this range, there is a high probability of returning to the purchase zone at the next market drawdown. The main resistance today is the 1.0 level, the opening of a new month above which can lead to active purchases. The second half of the quarter opened above 0.850, which gives a signal for a stable consolidation above 1.0.
I am also considering TURTLE MITO VIC HOOK CHESS BMT with previously high technical goals for a retest of up to 300%. Against the background of the detected manipulation of issue data by binance, I will double-check the target levels for all coins and indicate them in further reviews, including inclined target ranges for reliable scalping, corresponding to further issuance for the coming year at least. I have checked the data for TURTLE ENSO and NTRN, they are reliable for scalping from the current levels.

Up to 200% on NTRNI hired NTRN today. For this token, the second half of the quarter opened above the 0.035 support, which gives a clear signal for growth. The first large investments have been made in recent days, but a stable trend can be expected by the end of the year with an attempt to consolidate in the range of 0.0750-1000. The main resistance is the 0.050-55 range. So far, it has not been taken against the background of a bearish trend that has gained a foothold on the indicators. Starting next week, the indicators will allow stable growth. If a new monthly candle opens above 0.05, further purchases will not be long in coming. The token has fallen to an extremely oversold position due to binance's speculation with the issue data. The actual number of tokens in circulation is still significantly lower, which gives great growth potential.
I'm also considering TURTLE CHESS HOOK VIC BMT MITO for work.

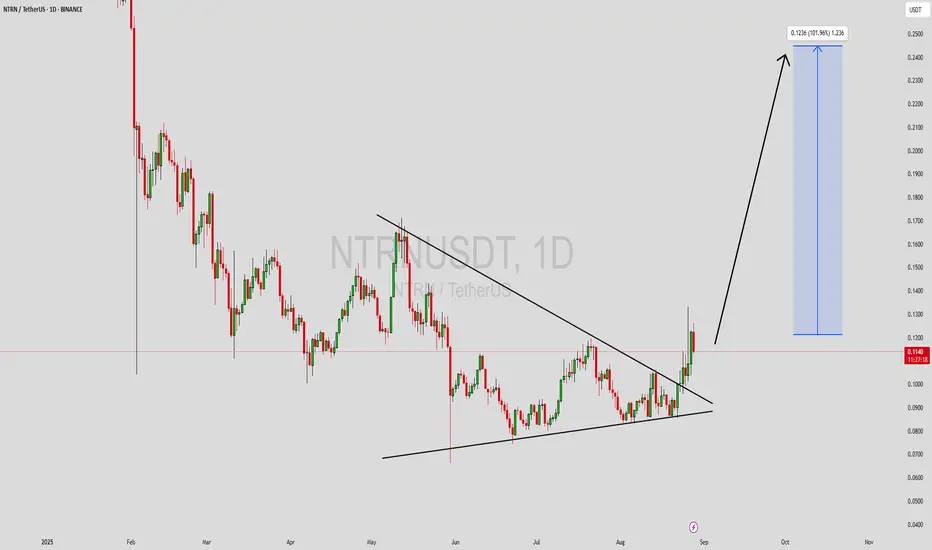
NTRNUSDT Forming Symmetrical TriangleNTRNUSDT is displaying a strong technical setup, recently breaking out of a consolidation phase that had been forming for weeks. The chart structure indicates a breakout from a symmetrical triangle pattern, which often signals the beginning of a new bullish trend. With good trading volume supporting the move, momentum is favoring buyers, and the market sentiment appears to be shifting toward accumulation.
Based on the current structure, this breakout has the potential to push NTRNUSDT toward significant upside targets. The projected move suggests possible gains in the range of 90% to 100%+, making this an attractive setup for traders looking for high-reward opportunities. The clear breakout level and continuation signal add further strength to the bullish case, particularly if volume continues to support the move.
Investors are beginning to take a stronger interest in this project, adding more confidence to the long-term outlook. As adoption grows and the technical picture aligns with investor demand, NTRNUSDT could continue to build momentum and challenge higher resistance levels. Keeping an eye on retests of the breakout zone may provide solid entry opportunities for those waiting on confirmation.
✅ Show your support by hitting the like button and
✅ Leaving a comment below! (What is You opinion about this Coin)
Your feedback and engagement keep me inspired to share more insightful market analysis with you!
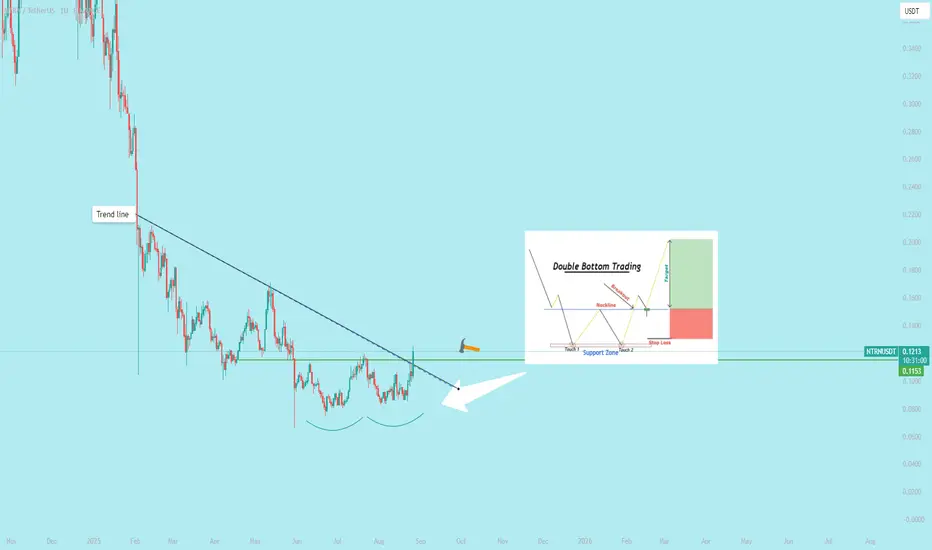
$NTRN shows a Double bottom pattern.Steps to Trade the Double Bottom PatternIdentify the Pattern
Look for a downtrend in the price chart.
Spot two lows (bottoms) at approximately the same price level, forming a support zone. These lows should be separated by a peak (the middle of the "W").
The pattern is more reliable on higher timeframes (e.g., daily or 4-hour charts).
Confirm the Pattern:Ensure the two bottoms are well-defined and not too far apart in time.
Check for increased volume on the second bottom or during the breakout, as it supports the pattern's validity.
Use additional indicators like RSI or MACD to confirm bullish momentum (e.g., RSI showing oversold conditions or a bullish divergence).
Define Key Levels:Support: The price level of the two bottoms.
Neckline: The horizontal line connecting the high point between the two bottoms (the peak of the "W").
Target: Measure the vertical distance from the bottoms to the neckline and project it upward from the breakout point for a potential price target.
Entry Point:Enter a long (buy) position when the price breaks above the neckline with strong momentum (e.g., a strong bullish candle or increased volume).
Alternatively, wait for a retest of the neckline (now acting as support) after the breakout to confirm the move.
Set Stop-Loss:Place a stop-loss just below the second bottom to protect against false breakouts.
A tighter stop-loss can be placed below the neckline if you're entering on a retest, but ensure it accounts for market volatility.
Set Profit Target:Use the height of the pattern (distance from bottoms to neckline) to estimate the target. For example, if the distance is $10, the target is $10 above the neckline.
Alternatively, trail your stop-loss or use resistance levels to lock in profits.
Manage the Trade:Monitor volume and momentum during the breakout. Weak volume may indicate a false breakout.
Adjust your stop-loss to breakeven once the price moves significantly in your favor.
Be cautious of news or events that could invalidate the pattern.
ExampleStock/Forex/Crypto: Price drops to $50 (first bottom), rises to $55 (neckline), drops back to $50 (second bottom), then breaks above $55.
Entry: Buy at $55.50 (breakout confirmation).
Stop-Loss: $49.50 (below the second bottom).
Target: $60 (neckline $55 + pattern height $5).
Risk-Reward Ratio: Calculate to ensure at least 1:2 (risk $1 to gain $2).
NTRNUSDT – Watch Out! Red Boxes Are Strong Resistance ZonesThe red boxes on NTRUSDT mark powerful resistance areas where significant selling pressure is likely to emerge. These levels are not to be taken lightly, as they have historically been strong barriers for price movement.
🔴 Key Takeaways:
Strong Resistance: The red boxes act as tough resistance zones where sellers are likely to step in.
Exercise Caution: Before making any decisions, ensure you wait for lower timeframe (LTF) breakouts and confirmation using CDV and volume analysis.
Don't Rush: Be patient and allow the market to show you the proper direction. Only engage when the signals are crystal clear.
💡 Plan Your Trade:
Watch the market carefully, be disciplined, and only enter when confirmations align. If you don’t get the right setup, don’t force the trade—let the market come to you.
📌I keep my charts clean and simple because I believe clarity leads to better decisions.
📌My approach is built on years of experience and a solid track record. I don’t claim to know it all but I’m confident in my ability to spot high-probability setups.
📌If you would like to learn how to use the heatmap, cumulative volume delta and volume footprint techniques that I use below to determine very accurate demand regions, you can send me a private message. I help anyone who wants it completely free of charge.
🔑I have a long list of my proven technique below, (I created this list in a couple of months here, most of the traders doesn't have these much runners in their lifes) :
🎯 ZENUSDT.P: Patience & Profitability | %230 Reaction from the Sniper Entry
🐶 DOGEUSDT.P: Next Move
🎨 RENDERUSDT.P: Opportunity of the Month
💎 ETHUSDT.P: Where to Retrace
🟢 BNBUSDT.P: Potential Surge
📊 BTC Dominance: Reaction Zone
🌊 WAVESUSDT.P: Demand Zone Potential
🟣 UNIUSDT.P: Long-Term Trade
🔵 XRPUSDT.P: Entry Zones
🔗 LINKUSDT.P: Follow The River
📈 BTCUSDT.P: Two Key Demand Zones
🟩 POLUSDT: Bullish Momentum
🌟 PENDLEUSDT.P: Where Opportunity Meets Precision
🔥 BTCUSDT.P: Liquidation of Highly Leveraged Longs
🌊 SOLUSDT.P: SOL's Dip - Your Opportunity
🐸 1000PEPEUSDT.P: Prime Bounce Zone Unlocked
🚀 ETHUSDT.P: Set to Explode - Don't Miss This Game Changer
🤖 IQUSDT: Smart Plan
⚡️ PONDUSDT: A Trade Not Taken Is Better Than a Losing One
💼 STMXUSDT: 2 Buying Areas
🐢 TURBOUSDT: Buy Zones and Buyer Presence
🌍 ICPUSDT.P: Massive Upside Potential | Check the Trade Update For Seeing Results
🟠 IDEXUSDT: Spot Buy Area | %26 Profit if You Trade with MSB
📌 USUALUSDT: Buyers Are Active + %70 Profit in Total
🌟 FORTHUSDT: Sniper Entry +%26 Reaction
🐳 QKCUSDT: Sniper Entry +%57 Reaction
📊 BTC.D: Retest of Key Area Highly Likely
📊 XNOUSDT %80 Reaction with a Simple Blue Box!
📊 BELUSDT Amazing %120 Reaction!
I stopped adding to the list because it's kinda tiring to add 5-10 charts in every move but you can check my profile and see that it goes on..

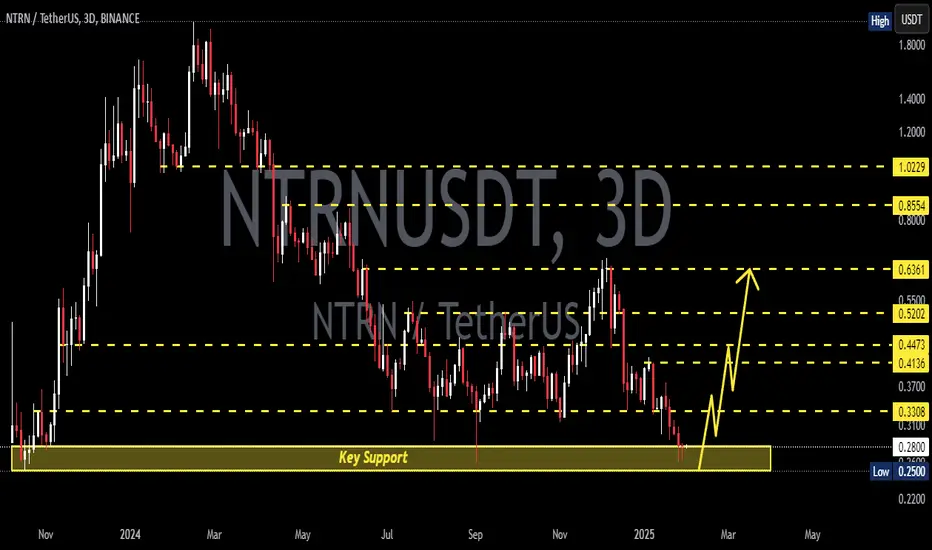
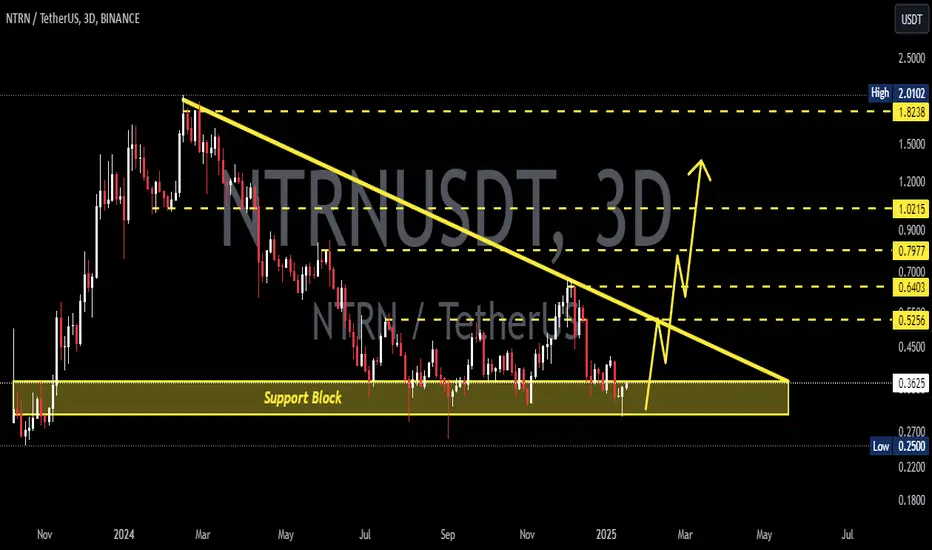
NTRNUSDT 3DNTRN ~ 3D
#NTRN This is the last support for this coin. If you still have a Conviction on this coin,. Buy from here with a minimum target of 20%+
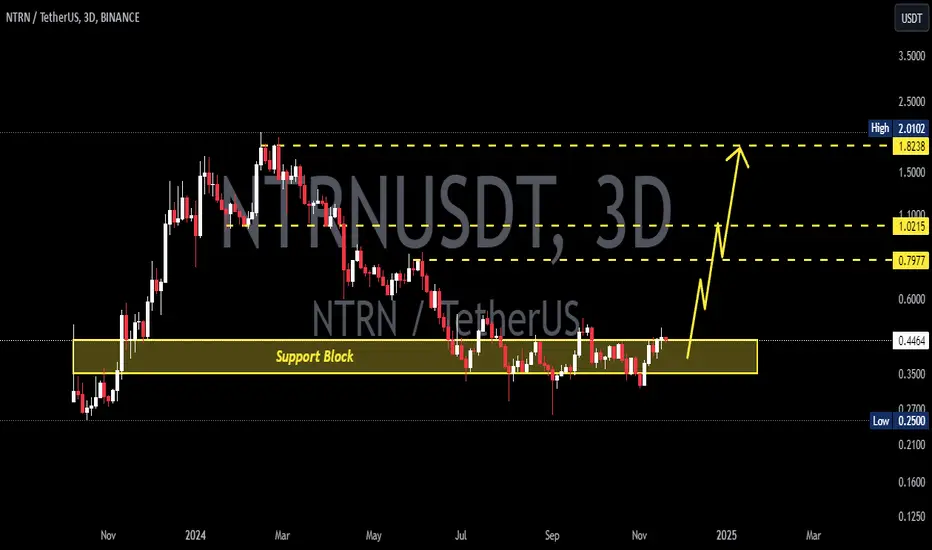
NTRNUSDT 3DNTRN ~ 3D
#NTRN Continue to maintain this support ,. If you still have Conviction on this coin,. Buy in stages from here, with a minimum target of 20%++
NTRNUSDT 3DNTRN ~ 3D
#NTRN Seller pressure is over. And now the price is moving sideways on this support block,. looks like an accumulation area. if you are interested in this coin,. Maybe this support block will be a very good buying place for now,. Minimum target 20%+
#NTRN/USDT#NTRN
The price is moving in a descending channel on the 12-hour frame and it was broken upwards
We have a bounce from a major support area in green at 0.3300
We have a downtrend RSI that was broken upwards which supports the upside
We have a trend to stabilize above the 100 moving average which supports the upside
Entry price 0.3570
First target 0.4445
Second target 0.5056
Third target 0.5762

#NTRN (SPOT) entry range( 0.33- 0.39)T.(0.7630) SL(0.3140)BINANCE:NTRNUSDT
entry range( 0.33- 0.39)
Target (0.7630)
1 Extra Targets(optional) in chart, if you like to continue in the trade with making stoploss very high.
SL .1D close below (0.3140)
*** collect the coin slowly in the entry range ***
*** No FOMO - No Rush , it is a long journey ***
**** #Manta ,#OMNI, #DYM, #AI, #IO, #XAI , #ACE #NFP #RAD #WLD #ORDI #BLUR #SUI #Voxel #AEVO #VITE #APE #RDNT #FLUX #NMR #VANRY #TRB #HBAR #DGB #XEC #ERN #ALT #IO #ACA #HIVE #ASTR #ARDR #PIXEL #LTO #AERGO #SCRT #ATA #HOOK #FLOW #KSM #HFT #MINA #DATA #SC #JOE #RDNT #IQ #CFX #BICO #CTSI #KMD #FXS #DEGO #FORTH # AST #PORTAL #CYBER #CLV #RIF #ENJ #ZIL #APT #GALA #STEEM #ONE #LINK #NTRN ****

NTRNUSDTNTRN ~ 3D ✅
#NTRN Successfully broke through this descending pattern.
Bulls will push the price even higher as long as the price stays above this descending pattern.

NTRN analysis (1D)From where we placed the red arrow on the chart, it seems that the correction of NTRN has started.
It appears to be in a triangular or diametric pattern.
The price can go up to the red range.
Price now appears to be completing wave D.
The red area is a supply, where you can look for sell/short scalp positions.
Closing a daily candle above the invalidation level will violate the analysis.
For risk management, please don't forget stop loss and capital management
Comment if you have any questions
Thank You

#NTRN/USDT#NTRN
The price is moving within a bearish channel pattern on the 12-hour frame, which is a strong retracement pattern
We have a bounce from a major support area in the color EUR at 0.3800
We have a tendency to stabilize above the Moving Average 100
We have a downtrend on the RSI indicator that supports the rise and gives greater momentum and the price is based on it
Entry price is 0.4475
The first target is 0.5474
The second target is 0.6230
The third goal is 0.7680

NTRNUSDT(Neutron) Daily tf Range Updated till 30-06-24NTRNUSDT(Neutron) Daily timeframe range. another PA is trying here,
it needs to stay above 0.4017 to be in safer side. close to local resistance at 0.5620. if it can clear it will open a more bigger area. for now all it needs volume.

NTRNUSD 12HNTRN ~ 12H
#NTRN Confluence Of Support.
Make purchases gradually. with a short term target of at least 15%+

NTRN looks bullishNTRN seems to be forming a bullish contraction triangle.
We seem to be in wave D now. Wave D of this triangle appears to be a diametric.
After the completion of wave D and wave E, we expect a pump towards the specified targets.
The targets are clear on the chart.
Closing a daily candle below the invalidation level will violate the analysis
For risk management, please don't forget stop loss and capital management
When we reach the first target, save some profit and then change the stop to entry
Comment if you have any questions
Thank You

NEUTRON $NTRN local Double bottomAfter a healthy correction of around -70%
(totally normal for a S coin)
we have technical basis for a recovery rally
A double bottom with bullish RSI divergence
A down trendline break
With a general altcoin rally I expect this to be trading back in the 1 dollar plus area soon enough.

ntrnIf it enters the green area, it should be checked to enter and continue the target up to the upper areas

NTRN NEW LONG TREND PROCESSINGNTRN is looking interesting over the next time frames and may show increased volume. That's why we're keeping an eye on this coin.
$0.88 is a key confirmation zone. If the coin breaks this level, there's a high chance it could reach $1,28 - long term and hype times can make the coin target $2
Remember, there are no guarantees in the market. Always follow a consistent system based on your own strategies and analysis.
Good times, everyone.
This update is not trading or financial advice.

NTRN/USDT Gaining Momentum to Breakout of a Falling Wedge👀🚀💎Attention Paradisers! #NTRN is at a crucial point within a Falling Wedge, priming for a potential breakout. With the current market support at $0.593, there’s a vibrant chance it could power through this pattern due to the accumulated momentum.
💎If #Neutron cannot sustain this energy and slips beneath the $0.593 support, it might signal an extension of the bearish trend, propelling toward the next essential demand zone at $0.534. This particular level is known for its vigorous liquidity and has historically catalyzed significant bullish movements.
💎If SEED_DONKEYDAN_MARKET_CAP:NTRN tests this demand zone once more, it’s imperative that it secures a strong rebound to uphold support. However, failure to achieve this could intensify bearish pressures, worsen market sentiment, and potentially prompt further price declines.
💎Stay alert and adaptable, Paradisers. Your ParadiseTeam is diligently tracking and ready to guide you through the complex dynamics of the #NTRN market.
MyCryptoParadise
iFeel the success🌴

NTRNUSD 12HNTRN ~ 12H
#NTRN Make purchases gradually after successfully breaking through the resistance line of this pattern. with a minimum target of 15%+.
