Nvidia - The -25% correction starts now!✂️Nvidia ( NASDAQ:NVDA ) is about to create a correction:
🔎Analysis summary:
After Nvidia retested major support in mid 2025, we saw another rally of about +125%. But now, Nvidia is rejecting a major resistance trendline and is about to create bearish confirmation. Quite likely that Nvidia will create a major -25% correction in the future.
📝Levels to watch:
$140
SwingTraderPhil
SwingTrading.Simplified. | Investing.Simplified. | #LONGTERMVISION
Nvda_analysis

Rebound from support on Nvidia?Despite the recent narrow range for the NVDA Stock, there is a lot going on from a technical standpoint. Starting with the basics, you will acknowledge that price rebounded from a 1M support area between US$170.01 and US$174.65 in December last year and subsequently engulfed nearby 1M resistance at US$185.23, which is now being retested as support. In terms of overhead resistance, there is limited stopping the Stock from respecting the current support and targeting the 1M resistance seen at US$207.98. Note that this level is set just south of the all-time high of US$212.19.
Adding to this bullish focus, chart pattern enthusiasts may recognise the double-bottom pattern that formed in November/December from the noted support zone. The neckline has been taken out, and the pattern’s profit objective resides around the 1M resistance pencilled in above at US$207.98.
Written by the FP Markets Research Team

Nvidia - This is all still expected!🥊Nvidia ( NASDAQ:NVDA ) is heading for another -20%:
🔎Analysis summary:
Just last month, Nvidia created a massive bearish engulfing candle. This clearly shows that buyers are not willing to accept higher prices. Together with the retest of the major resistance trendline, Nvidia is heading lower. The next support will come at about -20%.
📝Levels to watch:
$150
SwingTraderPhil
SwingTrading.Simplified. | Investing.Simplified. | #LONGTERMVISION

NVDA which direction?Im saying the area 195-203 is critical what happen when tested could be clear the next direction, if breakthrough to the ascending channel then bullish, if rejected could be bearish to test lower levels than 170 to possible 140 for solid support.
lets see next 2 weeks

NVDA — Structure, Timing, and the 223.10% TheoryI want to expand on my NVDA thesis by adding one more layer that’s been on my mind — the 223.10% measurement — and how I’m viewing it strictly as a structural possibility, not a prediction.
Everything below is still rooted in market structure and timing.
Quick Recap: Where We Are
Price ran from the $164 region into the $212 highs, then pulled back into the $169–$174 demand zone. That pullback reset momentum and held structure across higher timeframes (2D, 4M, 6M).
From my perspective:
The downside move completed the reset
The market is now compressing
This is pre-breakout behavior, not a failure
The W formation is forming, but not confirmed.
Key Confirmation Still Hasn’t Changed
This remains true regardless of any upside theory:
➡️ Daily close + acceptance above ~$188
Until that happens, price is coiling.
Above that level, the path back to $212 opens structurally.
The 223.10% Theory (How I’m Looking at It)
This part is pure structure math, not expectation.
The previous large expansion candle on the higher timeframe measured approximately 223.10% from its base to its high.
Instead of projecting randomly, I asked a simple question:
What happens if the market repeats the same magnitude of expansion from the current structural base?
So I:
Took the 223.10% expansion
Anchored it to the current price zone (~$189 area)
Projected it upward mechanically
That projection lands in the ~$600–$610 region.
Important clarification:
This is not a forecast
This is not a target
This is a measured possibility, based on prior behavior
Markets don’t repeat perfectly — but they do rhyme, especially on higher timeframes.
Why Timing Makes This Interesting (But Still Uncertain)
The 12-month candle closes in ~7 days.
That matters.
If the market wanted to:
Reclaim $212
Print strength into the yearly close
Signal continuation into the next cycle
This is when it would begin positioning — not after the candle closes.
That said:
Expansion of that magnitude would require momentum confirmation
No confirmation yet = no assumption
Structure comes first. Always.
How I’m Framing This Mentally
I’m not expecting a miracle candle.
I’m not forcing an outcome.
My framework is:
Hold support
Break and accept key levels
Let expansion earn its way higher
If price can’t reclaim $212, the 223.10% theory stays just that — a theory.
But if it does?
Then the market itself opens the conversation.
Final Thought
This thesis isn’t about being right — it’s about being positioned correctly when structure aligns with time.
The homework was done earlier.
Now it’s about watching execution into the close.
Let the market decide.
-MoNi

Nvidia (NVDA) Shares Rise On Potential Chip Shipments to ChinaNvidia (NVDA) Shares Rise On Potential Chip Shipments to China
According to Reuters sources, Nvidia has informed Chinese clients of plans to begin shipments of its H200 chips by mid-February 2026. This has been made possible by a recent change in US export policy, which allows the sale of advanced technologies provided a special 25% duty is paid.
NVDA shares reacted positively to the news, as the ability to legally sell high-performance chips — which are roughly six times more powerful than the previously approved, cut-down H20 versions — to major players such as Alibaba and ByteDance could significantly boost Nvidia’s revenues.
Technical Analysis of Nvidia (NVDA)
In November, we identified an ascending price channel, which remains intact.
Today, the NVDA chart shows clear signs of demand dominance:
→ the price reversed higher (as indicated by the arrow) before reaching the lower boundary of the channel, with the $170 level acting as support;
→ bullish gaps were formed at the open of the last two sessions.
Particular attention should be paid to the candle of 19 December:
→ trading volumes were exceptionally high;
→ the candle body was wide, with the session opening at the low and closing at the high.
If the decline from the all-time high is viewed as a corrective “bull flag” pattern (marked in red), it is notable that the price is now testing the upper boundary of that flag. In this context, it is reasonable to assume that if buying pressure remains strong, the price could break out of the correction and move towards the median of the long-term uptrend that has been in place throughout 2025.
This article represents the opinion of the Companies operating under the FXOpen brand only. It is not to be construed as an offer, solicitation, or recommendation with respect to products and services provided by the Companies operating under the FXOpen brand, nor is it to be considered financial advice.

NVDA – How I’m Reading the StructureFirst off, I want to thank everyone for all the support on my last NVDA markup. You all showed so much love and support. Something that may seem small to some was actually a big highlight for me in my journey, and having my community behind me really meant a lot.
So again—thank you. 🙏
This is how I see NVDA right now, stripping out the noise and focusing purely on structure.
The Impulse That Matters
We put in a clean low at 164.07 and ran all the way up to 212.xx.
That move wasn’t random. It was strong, decisive, and directional — the kind of move that sets the tone for everything that comes after it.
For me, that leg defines the range I care about. Everything since then is just price working off that expansion.
The Pullback (Not a Breakdown)
After topping near 212, price pulled back into 169.56.
I don’t see that as weakness — I see it as digestion.
That pullback:
Stayed within higher-timeframe structure
Respected prior acceptance
Never turned into a clean bearish impulse
So structurally, the trend didn’t break. It just paused.
The Neckline / Balance Area
The zone from 169.56 to 188 is the key area for me.
This range has:
Multiple reactions
Overlapping candles
Clear acceptance from both sides
That tells me this isn’t trend failure — it’s balance.
This is where the market is deciding whether it’s ready to continue or needs more time.
That’s why I call it the neckline.
Where We Are Now (Second Retest) MOST IMPORTANT
Price pushed back toward 188, couldn’t hold it, and rotated back down into the 170+ area.
To me, this looks like a second retest, not a breakdown.
Markets rarely resolve on the first touch.
They test, rotate, absorb — then decide.
As long as we’re holding above 169.56, I see this as price revisiting the base before making its next move.
The Big Picture (Why I’m Still Calm)
So in my head, the structure is simple:
164.07 → 212.xx: Expansion
212.xx → 169.56: Pullback
169.56 → 188: Balance / neckline
188 → 170+: Second retest
Nothing about that sequence screams “trend failure” to me.
This is the market doing what markets do after a big move — slowing down, shaking out impatience, and testing conviction.
I’m not trying to predict the next candle that is not my focus
I’m watching whether structure holds and so far , it has.
If 169.56 holds, the higher-timeframe story stays intact ( 6 Month Time frame/ Candle just looks healthy to me) If it doesn’t, then I reassess — not emotionally, just structurally.
That’s it. No hype. No fear. Just price doing its thing and that why im staying call during this time.

$NVDA IS GOING DOWN TO $150 - Bearish Pattern and weakness NASDAQ:NVDA IS GOING DOWN TO $150 - Bearish Pattern and weakness Continues
The supports/demand are $170 THEN $164 and lastly $150 .
Khalaf,

Nvidia - The correction just started!💉Nvidia ( NASDAQ:NVDA ) is now heading lower:
🔎Analysis summary:
Just recently, Nvidia once again retested the major rising channel resistance trendline. Together with November's bearish engulfing candle, Nvidia is slowly shifting bearish. And before Nvidia will retest the next major support area, we can see a drop of another -15%.
📝Levels to watch:
$150
SwingTraderPhil
SwingTrading.Simplified. | Investing.Simplified. | #LONGTERMVISION

NVIDIA Strengthens AI Stack With SchedMD AcquisitionNVIDIA (NASDAQ: NVDA) has expanded its software and infrastructure footprint with the acquisition of SchedMD, the developer of Slurm — the world’s most widely used open-source workload manager for high-performance computing (HPC) and AI. The move reinforces NVIDIA’s strategy of controlling not just compute hardware, but also the software layers that orchestrate large-scale AI workloads.
Slurm plays a critical role in scheduling, queuing, and allocating resources across massive compute clusters, and is currently used in more than half of the world’s top supercomputers. As AI model training and inference grow more complex and resource-intensive, efficient workload management has become essential. By acquiring SchedMD, NVIDIA gains deeper integration between its accelerated hardware and the software infrastructure that powers AI and HPC environments.
Importantly, NVIDIA confirmed that Slurm will remain open-source and vendor-neutral. This signals a clear effort to strengthen the broader AI ecosystem rather than lock customers into proprietary software. NVIDIA plans to continue investing in Slurm’s development while expanding its compatibility across heterogeneous clusters, cloud providers, and enterprise systems. This positions NVIDIA as a central enabler of next-generation AI infrastructure across industries such as healthcare, autonomous driving, finance, manufacturing, and government research.
From a technical perspective, NVDA is currently consolidating after a strong multi-month rally. Price has pulled back from recent highs near the $210 area and is trading below short-term resistance around $180–$185. The chart highlights a key demand zone near the $150 region, which previously acted as a breakout level and aligns with strong historical support. A deeper retracement toward this zone could offer a technical reset before the next leg higher.
If buyers successfully defend support and reclaim $185, NVDA could resume its broader uptrend toward prior highs. Overall, the fundamentals remain firmly bullish, with the SchedMD acquisition strengthening NVIDIA’s long-term AI dominance as the stock navigates a short-term technical consolidation.

Nvidia - Now is the time to go short!💣Nvidia ( NASDAQ:NVDA ) is now creating a top:
🔎Analysis summary:
Just a couple of days ago, Nvidia perfectly retested a major resistance trendline. Always in the past, such a retest was followed by a major move towards the downside. Therefore, Nvidia is preparing for a major drop, which could lead to another -25% drop in the future.
📝Levels to watch:
$180 and $140 and $100
SwingTraderPhil
SwingTrading.Simplified. | Investing.Simplified. | #LONGTERMVISION

NVDA – Inventory Panic or Blackwell Positioning?Nvidia just became the center of another “AI bubble” debate after headlines highlighted a 32% Q/Q inventory increase. The surface-level take was bearish, but the clarification from management changed the context. According to today’s memo, the buildup is preemptive staging for the Blackwell platform, not a sign of weakening demand. These units are tied to presold systems, meaning this is logistics positioning, not channel stuffing.
On the tape, the story is more technical than fundamental. Heavy insider selling (CEO/CFO), hedge fund trimming, and SoftBank pressure all created the sell-side imbalance we’ve been seeing for weeks. But despite those headwinds, the chart continues to defend major support zones.
Key Observations:
• 177–178 acted as the first demand pocket, aligning with trend support and prior volume nodes.
• Price continues trading within a controlled downtrend, but each flush is producing diminishing downside extension—a sign of seller exhaustion.
• The real liquidity magnets remain below:
– 172.93
– 170.69
– 164.01 (golden support if the market unwinds further)
The bearish narrative points to elevated inventories and institutional unloading. The bullish narrative focuses on Blackwell staging and enterprise AI demand still being early-cycle. Both can be true at once. That’s why the environment favors high-probability scalps, not oversized directional bets.
My Read: This is a volatility market. NVDA is still in discovery mode, and both sides will get opportunities. Until NVDA reclaims 182.55, sellers maintain short-term control. A break below 172.93 opens a path into the 170/169s where real buyers should step in.
This isn’t about predicting a hero reversal—it's about respecting levels and trading the reaction.
📌 PROFIT TARGETS & STOP ZONES (Required by TV)
Upside Targets:
• 182.55 (first resistance)
• 186.20 (gap fill supply zone)
• 190.17–191.05 (major distribution shelf)
Downside Targets:
• 172.93
• 170.69
• 164.01 (golden support)
Invalidation / Stop Zone:
• Close above 186.50 invalidates the short-term bearish drift.
• Close below 170 invalidates the shallow bounce thesis and opens deeper liquidity.

Analysis of the Nvidia (NVDA) Share ChartAnalysis of the Nvidia (NVDA) Share Chart
Last week, we published a post titled “Ahead of Nvidia’s (NVDA) Earnings: How the Price Could Move”, in which we:
→ Drew an ascending channel (shown in blue);
→ Suggested that market participants’ overly high expectations would likely not be met when earnings were released, leading to a decline in NVDA’s price towards the lower boundary of the ascending channel, where support lies at $165.
In reality, the earnings report turned out to be very strong:
→ Gross revenue: actual = $57bn, forecast = ~$54.9bn.
→ Earnings per share (EPS): actual = $1.30, forecast = $1.26 (previous quarter = $1.05).
The surge in price with a bullish gap towards point A reflected the initial reaction to the strong figures, but the share price then began to fall (reaching a two-month low), thereby confirming our expectations.
Technical Analysis of the Nvidia (NVDA) Chart
An analysis of NVDA’s price action suggests that the current situation can be viewed as a correction (shown with red lines), forming within an expanded ascending channel.
If NVDA’s share price declines towards the $165 level, where the lower boundary of the channel lies, this could encourage the bulls to attempt to resume the 2025 uptrend and mount a new push towards the psychological $200 mark.
This article represents the opinion of the Companies operating under the FXOpen brand only. It is not to be construed as an offer, solicitation, or recommendation with respect to products and services provided by the Companies operating under the FXOpen brand, nor is it to be considered financial advice.

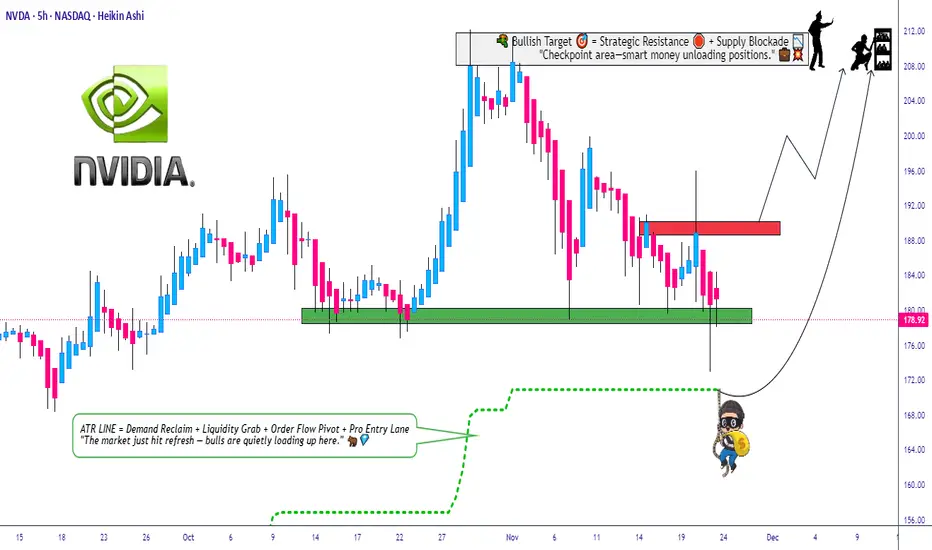
Can NVDA Hold the Pullback Zone and Extend the Uptrend?🔥 NVDA Bullish Pullback Playbook – Thief-Style Swing Setup 🚀🕵️♂️
Hey traders & my fellow Thief OG’s 😎🕶️ — here’s a clean, polished, TradingView-friendly version of my NVDA Swing Trade Playbook with a professional + funny touch. Let’s get to the setup 👇🔥
📌 Asset
NVDA – NVIDIA Corporation (NASDAQ)
Swing Trade | Momentum | Trend-Following Setup
📈 Plan: Bullish Pullback Strategy (Pending Orders Active)
The trend is strong, the buyers are steady, and NVDA is still delivering clean higher-lows. We're waiting for either a breakout continuation or a discounted pullback entry. 📊⚡
🎯 Entry Zones
1️⃣ Breakout Entry – Momentum Thief Mode 🥷⚡
Enter after clearing the nearest resistance at $191.00
• Clean breakout
• Volume confirmation
• Trend continuation strength
2️⃣ Pullback Entry – SuperTrend ATR Sniper Entry 🎯📉
Watch for a discounted pullback near $170.00 around the SuperTrend ATR zone.
• Trend support retest
• Lower-risk entry
• Ideal for swing traders who wait for “patience-pays entries” 😎
🛡️ Stop-Loss (Thief Style – Risk First)
Breakout Entry SL → $180.00
SuperTrend Pullback SL → $160.00
Note: Dear Ladies & Gentlemen (Thief OG’s) ❤️
I’m NOT recommending you use only my SL. Choose your own levels — you make the money, you protect the money. Trade at your own risk 🔐⚠️
🎯 Target (Take-Profit Zone)
Our target → $210.00
Why?
• Strong resistance zone
• Overbought region historically
• Buyer trap zone where police force 🚔👮♂️ usually waits — so escape with profits early 😂💨
Note: Dear Ladies & Gentlemen (Thief OG’s) 🙌
I’m NOT recommending you set my TP only. Choose your own TP — your money, your exit. Trade with responsibility 💼💰
🔍 Related Pairs to Watch (Correlation Insights + Key Notes)
NASDAQ:AMD
• High positive correlation with NVDA
• When AMD shows volume expansion, NVDA often follows
• Good for momentum confirmation 🔥
NASDAQ:SOXX (iShares Semiconductor ETF)
• NVDA is a major weighted component
• ETF direction confirms big-money flow 🧠💸
• Great for spotting sector-wide risk-on / risk-off shifts
NASDAQ:QQQ (NASDAQ 100 ETF)
• NVDA is one of the heaviest weights
• If QQQ trends strongly → NVDA often mirrors
• Macro sentiment index for tech strength 📊⚡
NASDAQ:SMH (VanEck Semiconductor ETF)
• Clean supply/demand signals
• NVDA mirrors SMH breakouts frequently
• Helps confirm breakout validity before taking the trade
All these help you avoid fakeouts and align with overall semiconductor market strength.
✨ “If you find value in my analysis, a 👍 and 🚀 boost is much appreciated — it helps me share more setups with the community!”
⚠️ This is a thief-style trading strategy created just for fun. Trade responsibly.
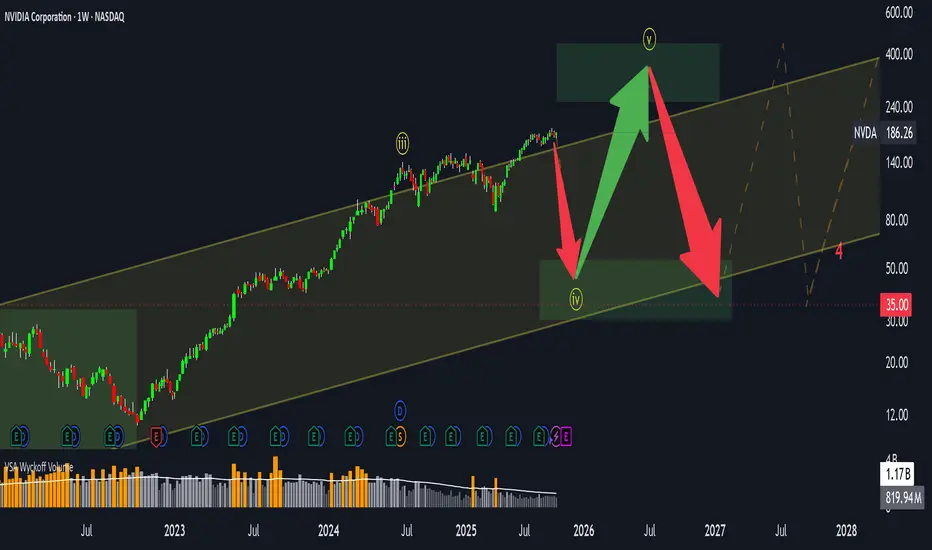
NVIDIA (NVDA): Where Are We in the Cycle?Ticker: NVDA
Category: Market Structure / Elliott Wave Analysis
Author’s note: Educational analysis — not financial advice.
🧠 Market Context
NVIDIA has been one of the strongest growth stories in the last market cycle. However, after such a powerful move, many traders are now asking: Where are we in the broader structure — and what could come next?
From a structural perspective, NVDA appears to have completed its third Elliott Wave, with the fourth wave currently in progress. This phase often reflects a period of consolidation, where the market digests previous gains before potentially starting the fifth wave.
📊 Elliott Wave Structure
Through the lens of Elliott Wave theory:
Wave 3 — likely completed after the parabolic advance that marked NVIDIA’s latest all-time highs.
Wave 4 — a corrective phase, potentially forming a sideways or slightly downward structure.
Wave 5 (ahead?) — may still occur, possibly extending above the upper boundary of the current price channel.
However, once the fifth wave completes, markets typically enter a longer consolidation or corrective phase — often retracing 50–60% of the total move from the highs.
⚙️ Volatility and Price Range
Currently, NVDA is trading within a broad channel, roughly between $100 and $400+.
Volatility remains elevated — which suggests that the sideways phase could persist for several months, or even longer.
Such behavior is common in late-cycle stages when large market participants distribute part of their holdings while retail interest remains high.
📈 Key Takeaways
The main impulsive move seems to have already played out.
The market may enter a range-bound or sideways phase, with local rallies still possible.
Correction risks are gradually increasing, especially if the fifth wave develops and fails to sustain new highs.
In short, this might not be the best time to chase — but rather to observe how price behaves within the current channel.
💬 Final Thoughts
This analysis is purely educational and reflects one possible scenario based on market structure.
No one can predict the exact timing or depth of the next move — the market always decides.
👉 What do you think?
Are we already in the correction phase, or is there still one more leg up left for NVDA?
Share your view in the comments below 👇
NVDA Head and Shoulders- Dec Rate Cuts has changed setupNvidia’s setup has shifted. With the Fed signaling a likely rate cut on December 10th, the market will start baking that optimism into asset prices ahead of time. When monetary conditions ease, high-valuation tech often gets an extra tailwind, which means the expected head-and-shoulders pattern on NVDA may fail to play out cleanly. The chart might still roll over, but the macro backdrop now works against a decisive breakdown. Short positions here demand caution.
Original post
Nvidia’s bear case rests on one core idea: the stock price assumes a flawless, world-eating AI future, and markets almost never deliver on “perfection narratives.” NVDA trades at extreme valuation multiples for a hardware-driven, highly cyclical business. Those multiples only hold if AI infrastructure spending keeps compounding at its current breathtaking pace for years. But that demand is dangerously concentrated in a handful of hyperscalers who are spending now and rationalizing later. Michael Burry’s recent argument sharpens this point: he claims true end-demand for AI horsepower is vastly overstated, and that much of the current GPU frenzy is a self-reinforcing loop of capital, hype, and accounting gimmicks rather than broad, organic need. If boards pause to question real ROI, or if the circular funding loop breaks Nvidia’s revenue curve can flatten quickly, dragging the valuation down with it.
Competition, long dismissed by NVIDIA bulls, is another structural headwind. AMD is now shipping accelerators that hyperscalers are actually integrating, and every major cloud provider is building in-house silicon to reduce dependence on NVDA’s margins. Even if Nvidia maintains leadership, it doesn’t need to lose the crown to lose the multiple, slight shifts in workload allocation or a handful of missed design wins are enough to pressure margins. And Burry’s critique deepens this point: he argues Nvidia’s reported profitability is flattered by depreciation assumptions and massive stock-based compensation that buybacks have failed to offset, meaning the “true” economic profit is less bulletproof than headlines suggest. Add to that the fact that U.S. export controls have effectively erased the China data-center market, once 20–25% of revenues and expectations of a seamless global TAM look increasingly unrealistic.
Technically, NVDA is doing exactly what a euphoric, overowned stock does when gravity starts tugging: momentum is fading, the price is slipping under short-term moving averages, and reactions to spectacular earnings have been strangely sluggish. That’s often the early signature of distribution rather than accumulation. And this lines up directly with Burry’s broader thesis: when a narrative becomes crowded and reflexive, the slightest wobble triggers violent air pockets. NVDA has become the ultimate proxy for the AI boom, the most crowded long in the market, meaning it’s the first thing funds sell when risk appetite cools, and the last thing buyers chase during corrections.
Put simply, Nvidia is a phenomenal company priced as if nothing can ever go wrong, while Burry is arguing that much of what looks “perfect” is not what it seems. The bear case isn’t that Nvidia collapses. It’s that the AI boom normalizes, competition accelerates, accounting realities catch up, margins slip toward something earthbound, and investors recalibrate how much they’re willing to pay. In that world, NVDA doesn’t need bad news to fall. It only needs the news to arrive slightly less euphoric than the fantasies currently baked into the price.
#NVDA #Bearish #HeadandShoulders #MichaelBurry

Nvidia: Downside Pressure Nvidia has recently faced notable downward pressure, but so far has managed to hold above the support level at $176.21. As a result, we continue to anticipate an imminent rally as part of the beige wave V, which should lift the stock into the now-red Target Zone between $227.38 and $260.60. However, if the stock immediately drops below the $176.21 mark, we would expect a new low for the beige wave alt.IV, with the lower $145.50 level still likely to hold.

Ahead of Nvidia’s (NVDA) Earnings: How the Price Could MoveAhead of Nvidia’s (NVDA) Earnings: How the Price Could Move
On Wednesday, after the close of the main US trading session, Nvidia will release its quarterly results — a report seen not merely as another batch of corporate data but as a crucial test for the entire AI-driven bull run.
NVDA shares are up more than 40% since the start of the year, and the company must now prove that this surge is justified and that the AI revolution is still accelerating. According to media reports, Wall Street analysts remain optimistic:
→ Revenue: forecast around $54.9bn, implying roughly 56% year-on-year growth.
→ Earnings per share (EPS): about $1.25 (previous quarter: $1.05).
What should investors focus on?
Of particular importance will be:
→ data on Data Centre revenue, a key indicator of whether the AI boom remains intact;
→ forward guidance, as the market is looking for reassurance that Big Tech will continue to spend heavily on AI.
Technical Analysis of the Nvidia (NVDA) Chart
Recent price action in NVDA points to a sequence that can be interpreted as bearish:
→ 28 October: a strong rally above the psychological $200 level;
→ a failure to hold above that barrier;
→ a pullback on rising volumes (Nasdaq data) with expanding candles in early November.
In the broader market context, it is notable that early November has seen NVDA underperforming major equity indices, signalling firm resistance from sellers around $200.
From a bullish perspective, the decline from the all-time high resembles a correction pattern (shown in red) within a larger uptrend.
However, there is a risk that the market’s high expectations will not be met when the earnings report is published. If that happens, NVDA could extend its decline towards the lower boundary of the rising channel, where support lies near $165.
This article represents the opinion of the Companies operating under the FXOpen brand only. It is not to be construed as an offer, solicitation, or recommendation with respect to products and services provided by the Companies operating under the FXOpen brand, nor is it to be considered financial advice.

NVDA chart AnalysisI am sharing my NVDA chart analysis with other traders on how it can react or what potential prices it can go

Nvidia - Squeezing every single bear!🧯NVidia ( NASDAQ:NVDA ) is finally breaking out:
🔎Analysis summary:
Over the course of the past couple of months, Nvidia has been rallying +125%. Considering the market cap of Nvidia, this is already an insane move but clearly not the end. We can still see another +25% from here, before Nvidia will then retest the next resistance.
📝Levels to watch:
$250
SwingTraderPhil
SwingTrading.Simplified. | Investing.Simplified. | #LONGTERMVISION

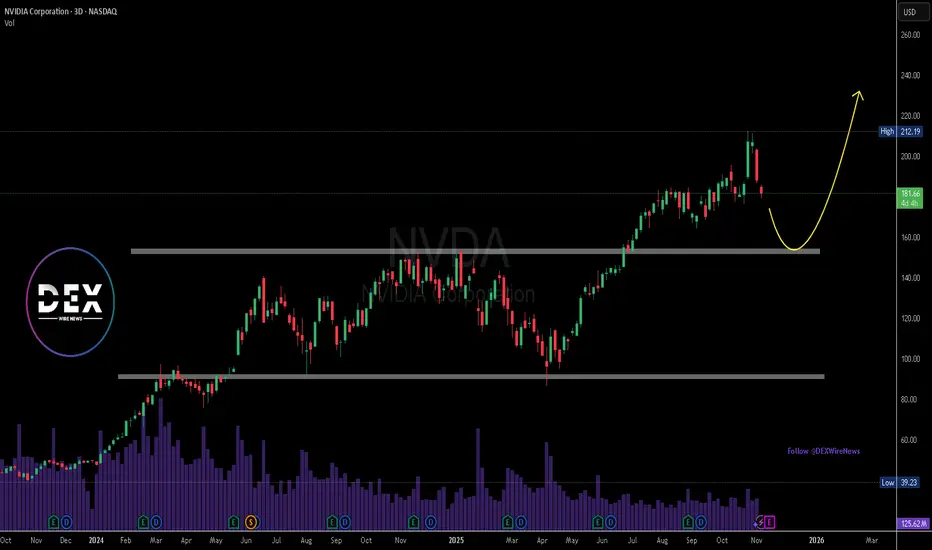
Nvidia Corp.($NVDA) Drops as U.S. Blocks AI Chip Sales to China Nvidia Corp. (Nasdaq: NASDAQ:NVDA ) shares dropped 4.18% to $180.22 on Friday after reports that Washington will block the company’s sales of scaled-down AI chips to China. The decision marks another escalation in U.S. restrictions on advanced semiconductor exports.
According to The Information, the White House informed several federal agencies that Nvidia will not be allowed to sell its new B30A AI chip to Chinese firms. Nvidia had already provided samples to some customers in China before the ban was confirmed.
The B30A was designed to meet U.S. export thresholds while retaining enough computing power for AI training when used in large clusters. However, U.S. officials reportedly concluded that the chip still poses national security risks.
Compounding Nvidia’s challenges, Beijing has issued new guidelines restricting foreign chips in state-backed data centers. Reuters reported that China will require all new projects using government funding to rely solely on domestically developed processors. Data centers less than 30% complete must remove foreign chips, while advanced projects will face case-by-case reviews.
Technical View
The NVDA chart shows a recent rejection from the $212 level, with price sliding toward $180. A further decline toward $160 support is possible before a rebound, as indicated by the yellow curve. Long-term structure remains bullish, but near-term weakness persists under regulatory pressure
Nvidia Daily Outlook!NVDA is in an uptrend! Those who are already holding the stock can use $200 as a stop loss for short-term traders. Long-term traders can use $176 as a stop loss if the price falls below $176, it breaks below the short-term channel, which could push the price down first to the 200-day EMA(156.50$) and then to the horizontal support around $150.
For those looking to make additional or new entries, they should wait for $183 and place a stop loss just below that level.
I can’t predict whether it will go up or down I’m not a fortune teller :)) but this is what the technical analysis suggests.
Good luck and profitable trades! This is not financial advice.

NVDA Bullish Breakout: Retest or Close Above 212.19 Toward 225NVDA’s daily chart remains firmly bullish after a clean breakout from a multi-month rectangle. Price is riding a MA20 > MA60 > MA120 stack, Bollinger Bands are expanding, and MACD momentum has flipped higher. The last close near $207.04 came on strong breadth, keeping buyers in control while price consolidates just under the recent high.
Primary path: look for a controlled pullback into the former ceiling at $198.00–$202.00 to act as demand. A constructive reaction there keeps the breakout intact and favors a grind into $210–$215 first, with the measured move pointing toward $225 as momentum persists. Alternatively, strength can skip the retest— a decisive daily close above $212.19 would confirm continuation and unlock the same upside roadmap.
Invalidation sits below the range top: a daily close back under $195.00 would negate the breakout and re-open downside toward the prior consolidation zone, with risk of a slide toward the $188 area if sellers press. Until then, the bias stays bullish with $198.00–$202.00 as the key line in the sand and $212.19 the trigger for fresh highs.
This is a study, not financial advice. Manage risk and invalidations
