Nvidia Corp.($NVDA) Drops as U.S. Blocks AI Chip Sales to China Nvidia Corp. (Nasdaq: NASDAQ:NVDA ) shares dropped 4.18% to $180.22 on Friday after reports that Washington will block the company’s sales of scaled-down AI chips to China. The decision marks another escalation in U.S. restrictions on advanced semiconductor exports.
According to The Information, the White House informed several federal agencies that Nvidia will not be allowed to sell its new B30A AI chip to Chinese firms. Nvidia had already provided samples to some customers in China before the ban was confirmed.
The B30A was designed to meet U.S. export thresholds while retaining enough computing power for AI training when used in large clusters. However, U.S. officials reportedly concluded that the chip still poses national security risks.
Compounding Nvidia’s challenges, Beijing has issued new guidelines restricting foreign chips in state-backed data centers. Reuters reported that China will require all new projects using government funding to rely solely on domestically developed processors. Data centers less than 30% complete must remove foreign chips, while advanced projects will face case-by-case reviews.
Technical View
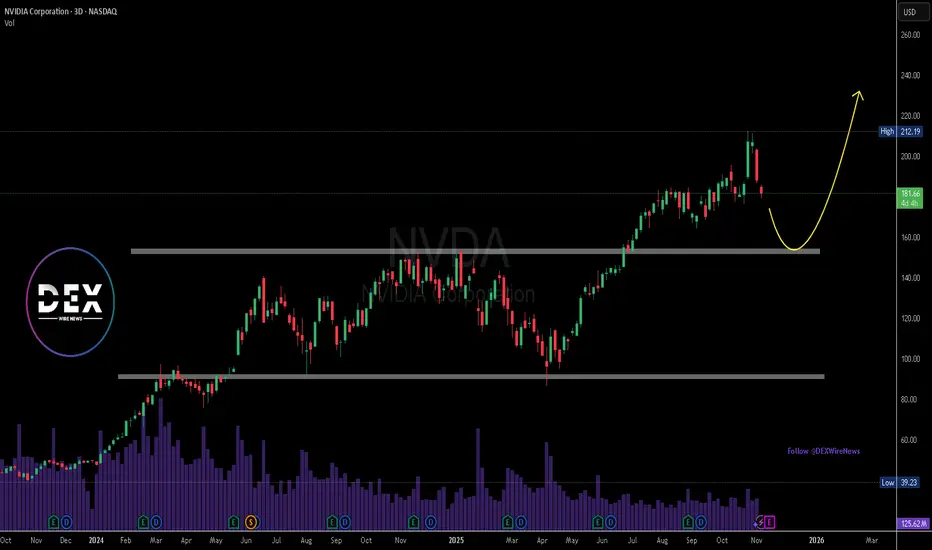
The NVDA chart shows a recent rejection from the $212 level, with price sliding toward $180. A further decline toward $160 support is possible before a rebound, as indicated by the yellow curve. Long-term structure remains bullish, but near-term weakness persists under regulatory pressure
Nvda_analysis
Nvidia Daily Outlook!NVDA is in an uptrend! Those who are already holding the stock can use $200 as a stop loss for short-term traders. Long-term traders can use $176 as a stop loss if the price falls below $176, it breaks below the short-term channel, which could push the price down first to the 200-day EMA(156.50$) and then to the horizontal support around $150.
For those looking to make additional or new entries, they should wait for $183 and place a stop loss just below that level.
I can’t predict whether it will go up or down I’m not a fortune teller :)) but this is what the technical analysis suggests.
Good luck and profitable trades! This is not financial advice.

NVDA Bullish Breakout: Retest or Close Above 212.19 Toward 225NVDA’s daily chart remains firmly bullish after a clean breakout from a multi-month rectangle. Price is riding a MA20 > MA60 > MA120 stack, Bollinger Bands are expanding, and MACD momentum has flipped higher. The last close near $207.04 came on strong breadth, keeping buyers in control while price consolidates just under the recent high.
Primary path: look for a controlled pullback into the former ceiling at $198.00–$202.00 to act as demand. A constructive reaction there keeps the breakout intact and favors a grind into $210–$215 first, with the measured move pointing toward $225 as momentum persists. Alternatively, strength can skip the retest— a decisive daily close above $212.19 would confirm continuation and unlock the same upside roadmap.
Invalidation sits below the range top: a daily close back under $195.00 would negate the breakout and re-open downside toward the prior consolidation zone, with risk of a slide toward the $188 area if sellers press. Until then, the bias stays bullish with $198.00–$202.00 as the key line in the sand and $212.19 the trigger for fresh highs.
This is a study, not financial advice. Manage risk and invalidations

Nvidia (NVDA) Shares Surpass $200 for the First TimeNvidia (NVDA) Shares Surpass $200 for the First Time
Yesterday, Nvidia’s (NVDA) share price climbed above the psychological threshold of $200 for the first time, pushing the company’s market capitalisation close to $5 trillion.
Why Are NVDA Shares Rising Today?
Several bullish factors are driving Nvidia’s share price higher:
→ Massive order backlog: The company reported pre-orders for its AI processors totalling an astonishing $500 billion.
→ Strategic partnership with the US government: CEO Jensen Huang announced plans to build seven AI supercomputers for the US Department of Energy.
→ Expansion into telecoms: Nvidia has invested $1 billion in Nokia, acquiring a 2.9% stake in the Finnish company to jointly develop AI-RAN and 6G technologies.
Technical Analysis of Nvidia (NVDA)
Back on 23 September, our analysis of the NVDA chart identified:
→ an upward channel outlining the stock’s price movements this autumn;
→ a breakout from a Bullish Flag pattern (shown in red);
→ a projection that strong fundamentals, the rapid advance of AI technology, and expectations of a Fed rate cut could enable bulls to overcome the $183 resistance level and target the psychological $200 mark.
That projection has materialised since:
→ the Bullish Flag breakout level has acted as support (marked with a bold blue line);
→ NVDA price swings have provided anchor points to refine the current channel.
What’s Next for Nvidia Shares?
Note the bullish gaps (highlighted by arrows) that indicate a demand imbalance. The rapidly strengthening upward momentum could drive NVDA’s share price towards the upper boundary of the channel, particularly as several major events approach today:
→ the Federal Reserve’s interest rate decision and subsequent press conference;
→ quarterly earnings releases from Microsoft (MSFT), Alphabet (GOOGL), and Meta Platforms (META), all of which are expected to reaffirm their commitment to AI development.
This article represents the opinion of the Companies operating under the FXOpen brand only. It is not to be construed as an offer, solicitation, or recommendation with respect to products and services provided by the Companies operating under the FXOpen brand, nor is it to be considered financial advice.

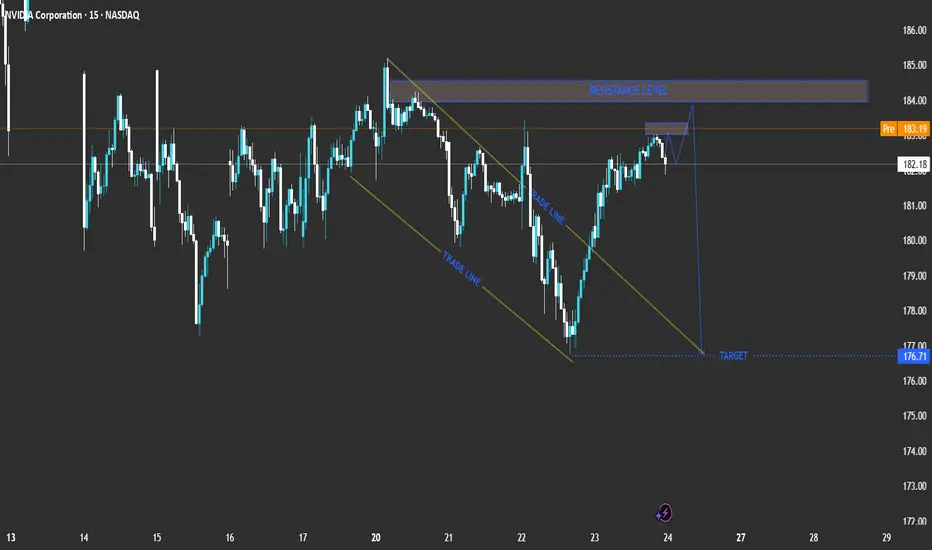
r NVIDIA Corporation (NVDA) based on your chart:Current Price: 182.18
Pre-Market Price: 183.21
Trend: Short-term bullish recovery inside a broader corrective phase.
Technical Breakdown
Descending Channel (Trade Line)
NVDA recently traded inside a downward-sloping channel, showing controlled selling pressure.
The breakout above the upper trade line suggests a short-term bullish correction phase.
Resistance Zone
A strong resistance level lies between 183.00 and 184.00.
This zone aligns with previous highs and may act as a reversal area if the price fails to break above it.
Expected Move
The chart projection shows a potential rejection near the resistance level, followed by a pullback towards the 176.71 target area.
This indicates that the current upward move might be corrective before another bearish swing.
Trade Scenarios
📉 Bearish Reversal Scenario (Primary Setup)
Entry Zone: 183.00 – 184.00 (resistance area)
Confirmation: Bearish rejection candlestick pattern or a failed breakout.
Target: 176.71
Stop Loss: Above 184.50
Comment: Ideal short setup if price rejects resistance.
📈 Bullish Breakout Scenario (Alternative)
Entry: Above 184.50 with strong bullish momentum.
Target: 186.50 – 187.00
Comment: A breakout and hold above resistance would invalidate the short setup and indicate further upside.
Summary Table
Bias Key Level Confirmation Target Notes
Bearish (Primary) 183 – 184 Rejection candle 176.71 Short setup
Bullish (Alternative) Above 184.50 Breakout candle 186.5 – 187 Upside continuation
Conclusion
NVIDIA (NVDA) is approaching a crucial resistance level. The most probable scenario is a bearish reversal from the 183–184 zone, targeting 176.71. However, a confirmed breakout above 184.50 would signal bullish continuation toward 187.00. NASDAQ:PLTR NASDAQ:AMD NASDAQ:AMZN NASDAQ:AAPL NASDAQ:TSLA OMXCOP:BAVA OMXCOP:GN OMXCOP:DNORD OMXCOP:TRMD_A OMXCOP:MAERSK_B OMXCOP:NKT OMXCOP:PNDORA OMXCOP:NSIS_B OMXCOP:DSV OMXCOP:ORSTED OMXCOP:GMAB
Nvidia - The next rally of +33% started!🚀Nvidia ( NASDAQ:NVDA ) just broke out:
🔎Analysis summary:
Over the past couple of months, Nvidia has been rallying an expected +100%. However, just objectively looking at the chart, this rally is not over yet. After the confirmed all time high breakout, Nvidia can rally another +33% until it will retest a substantial resistance level.
📝Levels to watch:
$250
SwingTraderPhil
SwingTrading.Simplified. | Investing.Simplified. | #LONGTERMVISION

Bullish Pullback Attack – NVIDIA Heist Plan for Escape Loot!🚨💻 NVIDIA (NVDA) Stock Heist Plan 🎭 | Swing & Day Trade Robbery 💰⚡
🌟 Hey Money Makers & Market Robbers! 🌟
Welcome back to the Thief Trading Den where we don’t trade… we steal from the market vaults! 🏦💸
🔥 Asset: NVIDIA (NVDA)
🎭 Heist Type: Swing / Day Trade
🔑 Plan: Bullish Pullback Robbery
🗝️ Entry (Breaking into the Vault)
First lockpick entry above 167.00+ 🔓
Retest & pullback = perfect robbery spot
Thief layering strategy: stack multiple buy limit orders (layered entry like robbers tunneling from multiple sides 🛠️).
Any price level? Yes, thieves adapt—grab loot wherever the window cracks open! 🏃♂️💨
🛑 Stop Loss (Escape Route 🚪)
Official Thief SL: @ 161.00 ⚠️
But dear Thief OG’s, adjust based on your risk appetite, loot bag size & startergy 🎭
Remember, no thief survives without an escape route! 🚁
🎯 Target (The Electric Fence Escape ⚡)
The High Voltage Electric Shock Fence is guarding the treasure @ 196.00 ⚡⚡
Snatch your profits before the fence fries the loot 🔥
Escape fast, spend faster, rob smarter 💸🍾
⚠️ Thief Alert 🚨
The market guards (short sellers) are patrolling heavy—don’t get caught in their traps 🕵️♂️
Use layered limit orders, scale out profits, and keep your SL tight!
A true thief never overstays at the crime scene 👀
💥 Boost this Robbery Plan 💥
Every like & comment powers the Thief Trading Family 🏆
Stay sharp, stay sneaky & let’s rob NVIDIA together! 🤑🎭

NVDA: Riding the AI Hype Wave to $250!NASDAQ:NVDA just hit its all-time high last friday, reaching my swing trade target. While I took profits as part of my routine discipline, I still believe there's plenty of upside left, with $250 in sight.
Here's why:
Strong Fundamentals: Nvidia consistently beats earnings expectations, with EPS climbing from $0.11 to $0.68 over recent six quarters. This growth trajectory shows no signs of slowing down, reinforcing the stock's upward momentum.
Analyst Confidence: Out of 65 analysts, 51 rate Nvidia as a "Strong Buy," with none suggesting a sell. While the average price target is $149.81, the highest target of $202.79 shows strong backing from the financial community.
Bullish Technicals: Weekly and daily moving averages, from the 10-day to the 200-day, are flashing "Buy" across the board. Add to that a myriad of other indicators in different time frames (basically, you name it), and it’s signaling "Buy." In short, everything is pointing towards continued bullish momentum and potential for further gains.
Market Leadership: Nvidia's dominance in AI and high-performance computing continues to grow. Its cutting-edge AI chips, as well as its strong presence in data centers and gaming, put the company in a prime position to capitalize on key growth sectors.
And finally, why am I more bullish than even the highest analyst target? Well, it’s simple: the hype. Nvidia is at the forefront of the most exciting and disruptive technologies today—AI, data centers, gaming—you name it. The market's enthusiasm surrounding these sectors is growing exponentially, and Nvidia is perfectly positioned to ride that wave. Sometimes, fundamentals and technicals align with pure market excitement, and that’s where I see Nvidia pushing past those conservative estimates toward $250.
Disclaimer: This content is for informational and educational purposes only. It should not be considered as financial or investment advice. Trading stocks involves risk, and you should perform your own research or consult with a professional before making any investment decisions. Past performance is not indicative of future results.

Nvidia - Starting a clear +20% rally!🧲Nvidia ( NASDAQ:NVDA ) rallies higher now:
🔎Analysis summary:
About one decade ago, Nvidia broke out of a major bullish triangle pattern. Following this remarkable breakout, Nvidia continued with a rally of about +35.000%. But looking at all these previous cycles, Nvidia remains bullish with another potential +20% move towards the upside.
📝Levels to watch:
$200, $250
SwingTraderPhil
SwingTrading.Simplified. | Investing.Simplified. | #LONGTERMVISION

$NVDA : The Rally’s Writing Its Own Headline! 10/9/2025NASDAQ:NVDA is making steady strides toward its wave C target of $235, following a challenging 13-month correction that found its bottom at $95 in April.
The bullish momentum could push prices even higher, eyeing a potential $321.
Sit tight and enjoy the ride! 🚀👌

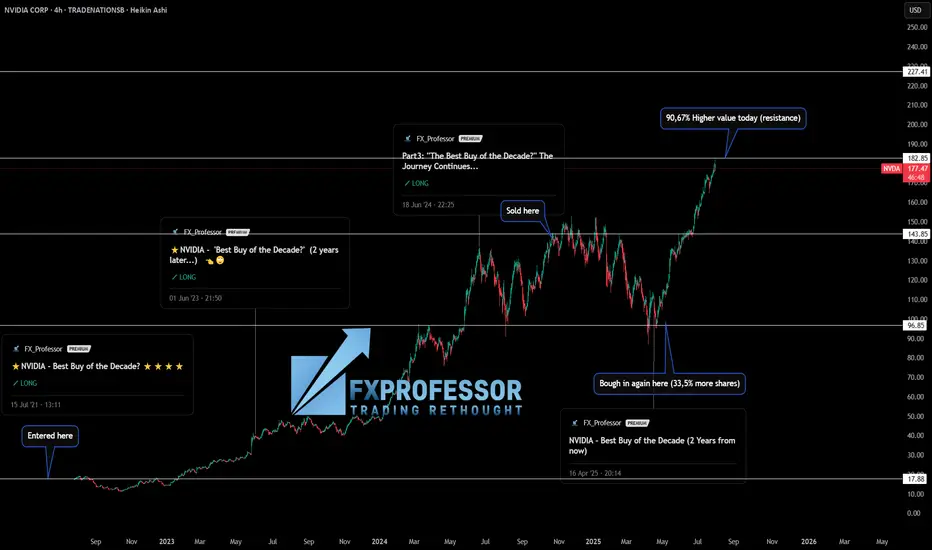
NVIDIA – From Thesis to Profits: How Fundamentals & Technicals 📚💡 NVIDIA – From Thesis to Profits: How Fundamentals & Technicals Aligned 🚀🧠
This isn’t just a trade —it’s a lesson in how conviction, timing, and structure come together when you truly understand what you're investing in.
I’ve been publicly calling NASDAQ:NVDA the “Best Buy of the Decade” since July 2021 when the price was around $18. Why? Because I’m a gamer, I understand chips, and I knew exactly what NVIDIA was building long before AI became a buzzword. From graphics cards to data centers and AI compute, the fundamentals were solid.
But let me be clear: I’m not a holder forever. I use technical analysis to manage entries and exits. And that’s where the real edge comes in. 🎯
Here’s how the trade evolved:
✅ Initial entry: $17.88 (2021)
✅ First target hit: $143.85 → Took profits
✅ Re-entry: $96.85 → Got 33.5% more shares for the same money
✅ Today’s value (July 31st): Up +90.67% in just 100 days
📅 That’s from April 23rd to today.
(and it was ALL publicly posted here, for You!)
This is what happens when macro conviction meets micro execution.
🧠 The key takeaways:
Fundamentals gave me the why.
Technicals gave me the when.
And risk management gave me more shares for free.
That’s not luck —it’s structure, patience, and doing the work. If you’re just “HODLing” and hoping, consider learning how to work the chart instead of letting the chart work you.
Let me know in the comments—did you catch this move? Are you in, or waiting for the next entry?
One Love,
The FX PROFESSOR 💙
ps. in this case i did not sell many shares today i hedged with a short on SP500. Nvidia might correct a bit
Disclosure: I am happy to be part of the Trade Nation's Influencer program and receive a monthly fee for using their TradingView charts in my analysis. Awesome broker, where the trader really comes first! 🌟🤝📈
Nvidia - The rally is still not over!🔌Nvidia ( NASDAQ:NVDA ) still heads much higher:
🔎Analysis summary:
For the past decade, Nvidia has perfectly been respecting a major bullish rising channel formation. Currently, Nvidia is still far away from the upper red resistance trendline, which indicates another potential move higher. Just understand that the trend is your closest friend.
📝Levels to watch:
$200
SwingTraderPhil
SwingTrading.Simplified. | Investing.Simplified. | #LONGTERMVISION

Nvidia plummets ~3% afterhours! Buy the dip or sell the rally?Nvidia delivered another strong quarter, beating expectations on both revenue and EPS. However, shares dropped after hours to around $175, as data centre revenue narrowly missed forecasts and China sales remained absent due to regulatory uncertainty.
Technically, if NVDA breaks below $175, bears may target the $170 double bottom support in a dead-cat-bounce fashion, with a risk of further downside if that level fails. However, if the stock holds above $179 and reclaims $185, bulls could see a rally toward $193 and potentially $220 in the medium term, which could still materialise after a short-term decline toward $170.
This content is not directed to residents of the EU or UK. Any opinions, news, research, analyses, prices or other information contained on this website is provided as general market commentary and does not constitute investment advice. ThinkMarkets will not accept liability for any loss or damage including, without limitation, to any loss of profit which may arise directly or indirectly from use of or reliance on such information.

NVDA gravity is strong....$140NVDA is heading towards the death cross (SMA200) and doesn't seem like much will change that at this point. The economy is doing horribly, despite a few small wins. Even the lower interest rate (25/50 basis points) is too little too late, when most of the S&P is already trading below 200SMA. There is a massive overheating of AI Tech stocks that are highly concentrated, and a massive correction is coming. Follow CAPE and PE ratios historically, this time won't be different! Best of luck....

Clear downtrend $NVDA! It's only the largest company in the world and holds about 8% of the entire US stock market! Nothing to worry about that it's break key technical indicators and showing a clear downtrend. Again, it's probably nothing that it's overvalued and has a very concentration of 2-3 customers that make-up most of their revenue. The UltraShort signal supports this. Remember that September it typically a bad month for the market and really bad things happen! When in doubt, sell and stay cash friendly! You don't want to be holding a bag and praying that things go up. Hope is NOT a strategy!

NVIDIA About to face some distressNVDA stock which has been on a long promising trend for a while in gthe past years seems to be on that plummet verge, would it really tap or the market is just fertching more buyers?
NVDA $182 Weekly CALL Setup – Cheap Premium, Big Upside?
# 🚀 NVDA Weekly Options Trade Idea (2025-09-03)
### 📊 Multi-Model Recap
* **Daily RSI**: 📉 34.3 (weak)
* **Weekly RSI**: 🔻 73.2 (falling)
* **Volume**: +1.3x → institutional distribution signs
* **Options Flow**: 🔥 C/P = 1.96 (bullish skew)
* **Gamma/Theta**: ⚡ High risk (2 DTE)
👉 Models Split:
* 🐻 Bearish: Claude, Gemini → favor \$165 PUT
* 🐂 Bullish: Llama, Grok → favor \$175 CALL
* 😶 Neutral/No Trade: Claude (low confidence)
---
### 🧭 Consensus Read
* Price & volume = bearish ⚠️
* Options flow & VIX = bullish 📈
* Net: **Mixed bias → tactical bullish bounce possible**
---
### ✅ Trade Setup (Viral Play)
```json
{
"instrument": "NVDA",
"direction": "CALL",
"strike": 175,
"expiry": "2025-09-05",
"entry_price": 0.68,
"profit_target": 1.36,
"stop_loss": 0.34,
"size": 1,
"confidence": 0.65,
"entry_timing": "market open"
}
```
---
### 🎯 Trade Details
* 📌 **Strike**: \$182 CALL
* 💵 **Entry**: 0.68 (ask, open)
* 🎯 **Target**: 1.36 (+100%)
* 🛑 **Stop**: 0.34 (-50%)
* 📅 **Expiry**: Sep 5 (2 DTE)
* 📈 **Confidence**: 65%
* ⏰ **Hold Policy**: Close by Thu EOD (don’t ride Friday gamma bomb)
---
⚠️ **Risks**:
* 2 DTE = 🔥 high gamma / fast theta decay
* Divergent signals → whipsaws possible
* Tight stop discipline required 🚨

Nvidia (NVDA) Shows Bearish Signs After Earnings ReleaseNvidia (NVDA) Shows Bearish Signs After Earnings Release
On Wednesday, Nvidia published a fairly strong quarterly report:
→ Revenue for the second quarter came in at $46.74 billion (record), up 56% compared with the same period last year;
→ Adjusted earnings per share (EPS) were $1.05, a 54% year-on-year increase and above analysts’ expectations of $1.01–$1.02.
However, in the Data Centre segment (closely watched by the market), results fell slightly short of Wall Street forecasts, which may suggest a slowdown in capital flows into AI infrastructure. This factor could explain why Nvidia (NVDA) underperformed the index later in the week: for instance, the S&P 500 hit a record high on Thursday, while NVDA closed lower.
Technical analysis of Nvidia (NVDA) chart
Six days ago, we:
→ Drew an upward channel (shown in blue), capturing NVDA’s price swings after the bullish surge at the end of June;
→ Highlighted the importance of support at $170 and resistance at $183.
Indeed, $183 looks like a solid barrier:
→ The numbers (1, 2, 3) mark failed attempts by the bulls to break through this resistance, giving grounds to view the chart in the context of a triple top pattern.
→ The third peak only slightly exceeds the previous highs, which resembles a bull trap and the Upthrust After Distribution (UTAD) pattern in Richard Wyckoff’s methodology, signalling the prospect of lower prices. A bearish gap the following day (shown by the red arrow) and a weak Friday close underline the bears’ aggression.
Given the above, we could assume that the bulls may try to keep the price within the channel, relying on support at its lower boundary. Yet the mentioned signals suggest that the bears are intensifying pressure. If we see only a weak rebound from the lower boundary at the start of September, the current channel could be at risk. In the event of a bearish breakout, a move down to test the $170 support could happen.
This article represents the opinion of the Companies operating under the FXOpen brand only. It is not to be construed as an offer, solicitation, or recommendation with respect to products and services provided by the Companies operating under the FXOpen brand, nor is it to be considered financial advice.

NVDA Earnings Play | \$190C– Don’t Miss Out
# 🚀 NVDA Earnings Play | \$190C @ 2.49 | 200–400% Target 🎯
### 📝 Quick Take (TL;DR)
* **Bias:** Moderate-Bullish (78% confidence).
* **Rationale:** Fundamentals 🔥 + Options flow skewed bullish 📈 + Technicals constructive.
* **Main Risk:** China export \~\$8B headwind in guidance.
---
### 🎯 Trade Idea
* **Buy** NVDA **2025-08-29 \$190 Call**
* 📌 Entry: \$2.49 (ask) — enter **pre-earnings close** (Aug 26 AMC).
* 🛑 Stop: \$1.25 (−50%).
* 🎯 Targets:
* +200% → \$7.47
* +300% → \$9.96
* ⏳ Exit Rule: If neither stop/target hit, **close within 2h post-earnings open**.
* ⚖️ Risk: \$249 per contract (max loss).
---
### 📊 Why This Setup?
**Fundamentals (9/10)**
* Revenue growth: +69% TTM 🚀
* Margins elite (gross 70%, net 52%) 💰
* Beat history: 8/8 last quarters ✅
* Balance sheet strong (cash \~\$54B).
**Options Flow (8/10)**
* Implied move ~~5.9% (~~\$10.5).
* Call OI heavy @ \$185–\$200 (gamma cluster).
* Liquidity excellent at \$190 strike (OI >64k).
**Technicals (8/10)**
* Price \$179.83, holding above 20/50/200 MAs.
* RSI neutral (53).
* Resistance: \$184.5 / \$190 / \$200.
* Coiling under highs 🔄.
**Macro (6/10)**
* AI/data center demand = secular tailwind.
* China ban risk headline.
* VIX \~15 → complacency = bigger gap risk.
---
### ⚠️ Risks
* Guidance may highlight China hit (\$8B) → bearish gap.
* IV crush 30–50% post-print.
* Gap risk may bypass stop.
* Single-leg naked = high variance → **size small (≤2% portfolio).**
---
### 📌 Execution Checklist
✅ Confirm ask = 2.49 @ close.
✅ Expiry = 2025-08-29 (weekly).
✅ Size ≤ 2% acct.
✅ Close within 2h post-earnings if no trigger.
---
### 📊 TRADE JSON
```json
{
"instrument": "NVDA",
"direction": "call",
"strike": 190.0,
"expiry": "2025-08-29",
"confidence": 78,
"entry_price": 2.49,
"stop_loss": 1.245,
"profit_target": 7.47,
"size": 1,
"entry_timing": "pre_earnings_close",
"earnings_date": "2025-08-26",
"earnings_time": "AMC",
"expected_move": 5.9,
"iv_rank": 0.75,
"signal_publish_time": "2025-08-26 14:00:37 UTC-04:00"
}
```
---
### 🔖 Hashtags
\#NVDA #EarningsPlay #OptionsTrading #CallOptions #StockMarket #AIStocks #Futures #SwingTrade #TradingSignals #RiskReward #OptionsFlow #SP500 #TechStocks

NVDA \$200C→ Big Move Loading?
# 🚀 NVDA Weekly Options Setup | \$200 Call 🎯 (High Risk / High Reward)
📊 **TRADE SNAPSHOT**
* **Ticker**: NVDA
* **Direction**: 📈 CALL (LONG)
* **Strike**: \$200
* **Entry Price**: \$1.44
* **Profit Target**: \$2.16 (50% gain)
* **Stop Loss**: \$0.58 (40% risk)
* **Expiry**: 2025-08-29
* **Confidence**: 65%
* **Timing**: Enter at Open
* **Signal Time**: 2025-08-23 11:11 EDT
---
### 🔎 Market Analysis
✅ **Weekly RSI**: 87.2 (RISING → Strong Bullish)
⚠️ **Daily RSI**: 63.3 (FALLING → Short-term caution)
📉 **Volume**: 0.9x last week (Weak confirmation)
🔥 **Options Flow**: Calls 617k vs. Puts 383k → **1.61 ratio (Bullish Bias)**
---
### 📈 Bias & Strategy
* **Overall Sentiment**: **Moderate Bullish** 🚀
* Bullish institutions loading Calls → supports upside.
* Weak daily momentum + low volume = ⚠️ caution.
* High gamma risk → manage tight with stop loss.
🏷 **Tags**:
\#NVDA #OptionsTrading #SwingTrade #WeeklyOptions #TradingView #StockMarket #EarningsPlay #MomentumTrading #OptionsFlow #GammaRisk
Nvidia (NVDA) Upcoming Earnings ReportNvidia (NVDA) Upcoming Earnings Report
Tomorrow after hours, Nvidia will release its quarterly report, attracting heightened attention given its position as:
→ the world’s largest company (market capitalisation of around $4.39 trillion);
→ a leader in the development of AI-related industries;
→ strong stock price performance — approximately +33% year-to-date, +108% from the yearly low.
Bullish Expectations
Analysts anticipate Nvidia will report revenue of around $46 billion, more than 50% higher than the same period last year.
Investors are counting on confirmation of robust demand for Nvidia’s chips from tech giants such as Microsoft, Google, Amazon, and Meta, all of which continue to expand capital expenditure on data centres to power AI workloads.
Further support for NVDA’s share price could come from positive news about demand for the new Blackwell chips and the resumption of sales in China following a recent agreement with the US government.
Bearish Concerns
Even strong results may fall short of “sky-high” optimistic expectations, potentially triggering profit-taking and a decline in Nvidia’s (NVDA) stock price. The stock trades at a high P/E multiple (price-to-earnings ratio), making it vulnerable to any negative news or even a minor miss against forecasts.
The primary concern is that Nvidia’s forward guidance might point to a slowdown in AI infrastructure spending growth by its key clients. Any hint of this could negatively affect not only Nvidia’s shares but also the broader technology sector.
Technical Analysis of Nvidia (NVDA) Chart
NVDA’s share price remains within an upward channel (shown in blue), with the following configuration:
→ until mid-August, the price remained within the upper half of the channel;
→ in August, the price declined towards the lower boundary (point A).
The $170 level appears to be a key support:
→ it is a round psychological level;
→ the low at point A looks like an aggressive test of this level, after which the price reversed upward.
From a bullish perspective:
→ support is provided by the lower boundary of the channel;
→ a long bullish candlestick (2) signals persistent demand.
From a bearish perspective, the $183 level looks like key resistance: NVDA’s share price slowed its advance here in early August, with repeated unsuccessful attempts to break higher.
Given the above, we could assume that the bulls may attempt to push through the $183 resistance on the back of the earnings release, but to do so, Nvidia’s results and guidance must at least meet the market’s extremely optimistic expectations.
This article represents the opinion of the Companies operating under the FXOpen brand only. It is not to be construed as an offer, solicitation, or recommendation with respect to products and services provided by the Companies operating under the FXOpen brand, nor is it to be considered financial advice.

Nvidia Shares Maintain Bearish Bias Near $170Over the past three trading sessions, Nvidia’s shares have posted a sharp decline, accumulating losses of more than 3% in the short term. For now, the emerging selling bias around the stock remains in place, as the market fears a potential overheating of the artificial intelligence industry. Added to this is the anticipation of the company’s results on August 27, which may show difficulties in revenue, mainly due to concerns that sales in China have weakened in recent months amid the intensifying trade war. Earnings per share are expected to come in around $0.94, but uncertainty remains as to whether this figure can hold given possible performance challenges. As long as this uncertainty persists, selling pressure on the stock could remain in the short term.
Uptrend Channel at Risk
Recent sessions have shown a clear shift in the bullish outlook that Nvidia had been sustaining in prior weeks. A significant bearish correction has emerged, halting the advance of the short-term uptrend channel and leading to a breakdown of its lower boundary. As long as selling pressure continues, this previous channel may lose relevance and give way to a broader bearish scenario, provided the bearish bias remains dominant.
Technical Indicators
RSI: the RSI line has begun to show a downward slope, now approaching the neutral 50 level. If it breaks below this threshold, selling momentum could become dominant in the short term, paving the way for stronger bearish pressure on the chart in the upcoming sessions.
MACD: the MACD histogram is currently moving below the 0 line, reflecting that short-term moving averages have entered a sustained bearish territory. If the histogram continues to decline, selling pressure is likely to strengthen further in the short term.
Key Levels to Watch:
$184 – Main Resistance: corresponds to the area of recent highs. A sustained recovery above this level could reactivate a bullish bias and bring back strength to the uptrend channel.
$173 – Near-Term Support: current congestion zone of recent weeks and the most immediate barrier. A sustained move below this level could trigger a stronger bearish bias in the short term.
$162 – Crucial Support: aligned with the 23.6% Fibonacci retracement. A decisive break below this level would confirm a bearish structural shift, opening the door to a new selling trend in the short term.
Written by Julian Pineda, CFA – Market Analyst

Nvidia - This is clearly not the end!📐Nvidia ( NASDAQ:NVDA ) will simply rally more:
🔎Analysis summary:
Yes, over the past couple of months, Nvidia has been rallying another +100%. But looking at the higher timeframe, this is still not the end of the unbelievable bullrun. Following the rising channel pattern, Nvidia can rally another +20% before we might see a potential retracement.
📝Levels to watch:
$250
SwingTraderPhil
SwingTrading.Simplified. | Investing.Simplified. | #LONGTERMVISION
