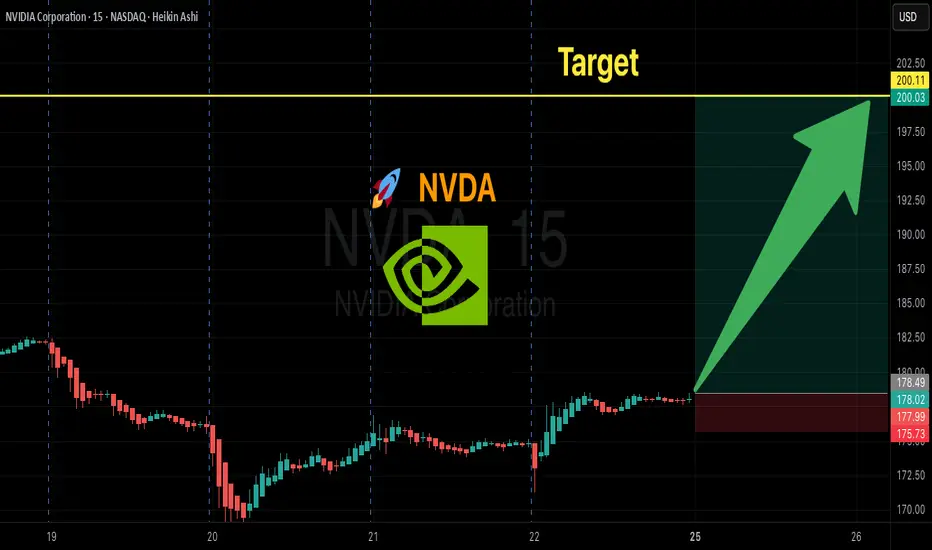
NVDA Bullish Setup | Structure, Momentum & Risk Defined🔥 NVDA Bullish Layered Accumulation Playbook (Swing Trade)
Asset:
NVDA – NVIDIA Corporation
NASDAQ Exchange | US Equities
🧭 Trade Thesis (Bullish Bias)
NVDA remains structurally strong within the broader AI, data-center, and semiconductor leadership cycle. Price action shows healthy pullback behavior within a dominant bullish trend, offering swing traders an opportunity to accumulate via layered entries instead of chasing breakouts.
This plan is designed using a layered limit-order approach (“thief-style accumulation”), allowing flexibility and improved average pricing during volatility.
🟢 Entry Strategy – Layered Accumulation (Thief Style)
Instead of a single entry, this plan uses multiple buy-limit layers to manage volatility and avoid emotional entries.
📌 Layered Buy Zones (example):
Buy Limit 1: $190.00
Buy Limit 2: $185.00
Buy Limit 3: $180.00
👉 Traders may add or adjust layers based on their own risk tolerance, timeframe, and volatility expectations.
👉 This structure allows participation from any price level, while improving cost basis if price dips.
🔴 Risk Management – Stop-Loss Zone
🛑 Protective Stop-Loss: $175.00
⚠️ Important Note (Risk Awareness):
Dear Ladies & Gentlemen (Thief OGs), this stop-loss level is not mandatory. Risk management is a personal decision — manage size responsibly and secure profits according to your own trading plan.
🎯 Target Zone – Profit Protection Area
🚧 Target: $205.00
This level aligns with:
Prior strong resistance (police barricade zone)
Signs of potential overbought conditions
Possible liquidity traps near highs
📌 The plan is to escape with profits, not to predict tops. Partial profit-taking is encouraged as price approaches resistance.
⚠️ TP Reminder:
This take-profit level is guidance only. Traders are free to secure gains based on their own strategy and market conditions.
📊 Technical Context (Clean & TradingView-Friendly)
Bullish higher-timeframe structure intact
Pullback within trend = accumulation opportunity
Layered entries reduce timing risk
Resistance overhead justifies disciplined exits
🌍 Fundamental & Economic Factors Supporting NVDA
Fundamental Drivers:
NVIDIA remains a core leader in AI chips, data centers, and accelerated computing
Strong demand from cloud providers, AI infrastructure, and enterprise compute
Ongoing investment in next-gen GPUs and AI platforms
Macro & Economic Considerations:
US tech sector strength tied to AI capex cycles
Market sensitivity to interest-rate expectations and inflation data
Risk-on sentiment generally benefits high-growth semiconductor leaders
📌 Watch upcoming:
US CPI / PPI inflation data
Federal Reserve rate guidance
Earnings or forward-looking statements impacting AI demand expectations
🔗 Related Symbols to Watch (Correlation Check)
NASDAQ:SOXX / NASDAQ:SMH – Semiconductor ETFs (sector health confirmation)
NASDAQ:QQQ / NASDAQ:NDX – Nasdaq strength supports NVDA momentum
NASDAQ:AMD – Peer comparison and sentiment gauge
NASDAQ:MSFT / NASDAQ:GOOGL – AI infrastructure demand correlation
📈 Strength in these symbols often confirms bullish continuation in NVDA.
🧠 Master Trader Note (Correction & Guidance)
You’re not “wrong” in asking for layered entries at any price level — this is a valid accumulation methodology. The key improvement is clarity, structure, and risk framing, which ensures the idea remains educational, compliant, and professional rather than promotional or misleading.
✨ “If you find value in my analysis, a 👍 and 🚀 boost is much appreciated — it helps me share more setups with the community!”
⚠️ Disclaimer: This is a thief-style trading strategy just for fun. This analysis is for educational purposes only and does not constitute financial advice. Trade responsibly.
Nvdaearnings

Nvidia plummets ~3% afterhours! Buy the dip or sell the rally?Nvidia delivered another strong quarter, beating expectations on both revenue and EPS. However, shares dropped after hours to around $175, as data centre revenue narrowly missed forecasts and China sales remained absent due to regulatory uncertainty.
Technically, if NVDA breaks below $175, bears may target the $170 double bottom support in a dead-cat-bounce fashion, with a risk of further downside if that level fails. However, if the stock holds above $179 and reclaims $185, bulls could see a rally toward $193 and potentially $220 in the medium term, which could still materialise after a short-term decline toward $170.
This content is not directed to residents of the EU or UK. Any opinions, news, research, analyses, prices or other information contained on this website is provided as general market commentary and does not constitute investment advice. ThinkMarkets will not accept liability for any loss or damage including, without limitation, to any loss of profit which may arise directly or indirectly from use of or reliance on such information.

NVDA Earnings Play | \$190C– Don’t Miss Out
# 🚀 NVDA Earnings Play | \$190C @ 2.49 | 200–400% Target 🎯
### 📝 Quick Take (TL;DR)
* **Bias:** Moderate-Bullish (78% confidence).
* **Rationale:** Fundamentals 🔥 + Options flow skewed bullish 📈 + Technicals constructive.
* **Main Risk:** China export \~\$8B headwind in guidance.
---
### 🎯 Trade Idea
* **Buy** NVDA **2025-08-29 \$190 Call**
* 📌 Entry: \$2.49 (ask) — enter **pre-earnings close** (Aug 26 AMC).
* 🛑 Stop: \$1.25 (−50%).
* 🎯 Targets:
* +200% → \$7.47
* +300% → \$9.96
* ⏳ Exit Rule: If neither stop/target hit, **close within 2h post-earnings open**.
* ⚖️ Risk: \$249 per contract (max loss).
---
### 📊 Why This Setup?
**Fundamentals (9/10)**
* Revenue growth: +69% TTM 🚀
* Margins elite (gross 70%, net 52%) 💰
* Beat history: 8/8 last quarters ✅
* Balance sheet strong (cash \~\$54B).
**Options Flow (8/10)**
* Implied move ~~5.9% (~~\$10.5).
* Call OI heavy @ \$185–\$200 (gamma cluster).
* Liquidity excellent at \$190 strike (OI >64k).
**Technicals (8/10)**
* Price \$179.83, holding above 20/50/200 MAs.
* RSI neutral (53).
* Resistance: \$184.5 / \$190 / \$200.
* Coiling under highs 🔄.
**Macro (6/10)**
* AI/data center demand = secular tailwind.
* China ban risk headline.
* VIX \~15 → complacency = bigger gap risk.
---
### ⚠️ Risks
* Guidance may highlight China hit (\$8B) → bearish gap.
* IV crush 30–50% post-print.
* Gap risk may bypass stop.
* Single-leg naked = high variance → **size small (≤2% portfolio).**
---
### 📌 Execution Checklist
✅ Confirm ask = 2.49 @ close.
✅ Expiry = 2025-08-29 (weekly).
✅ Size ≤ 2% acct.
✅ Close within 2h post-earnings if no trigger.
---
### 📊 TRADE JSON
```json
{
"instrument": "NVDA",
"direction": "call",
"strike": 190.0,
"expiry": "2025-08-29",
"confidence": 78,
"entry_price": 2.49,
"stop_loss": 1.245,
"profit_target": 7.47,
"size": 1,
"entry_timing": "pre_earnings_close",
"earnings_date": "2025-08-26",
"earnings_time": "AMC",
"expected_move": 5.9,
"iv_rank": 0.75,
"signal_publish_time": "2025-08-26 14:00:37 UTC-04:00"
}
```
---
### 🔖 Hashtags
\#NVDA #EarningsPlay #OptionsTrading #CallOptions #StockMarket #AIStocks #Futures #SwingTrade #TradingSignals #RiskReward #OptionsFlow #SP500 #TechStocks

NVDA \$200C→ Big Move Loading?
# 🚀 NVDA Weekly Options Setup | \$200 Call 🎯 (High Risk / High Reward)
📊 **TRADE SNAPSHOT**
* **Ticker**: NVDA
* **Direction**: 📈 CALL (LONG)
* **Strike**: \$200
* **Entry Price**: \$1.44
* **Profit Target**: \$2.16 (50% gain)
* **Stop Loss**: \$0.58 (40% risk)
* **Expiry**: 2025-08-29
* **Confidence**: 65%
* **Timing**: Enter at Open
* **Signal Time**: 2025-08-23 11:11 EDT
---
### 🔎 Market Analysis
✅ **Weekly RSI**: 87.2 (RISING → Strong Bullish)
⚠️ **Daily RSI**: 63.3 (FALLING → Short-term caution)
📉 **Volume**: 0.9x last week (Weak confirmation)
🔥 **Options Flow**: Calls 617k vs. Puts 383k → **1.61 ratio (Bullish Bias)**
---
### 📈 Bias & Strategy
* **Overall Sentiment**: **Moderate Bullish** 🚀
* Bullish institutions loading Calls → supports upside.
* Weak daily momentum + low volume = ⚠️ caution.
* High gamma risk → manage tight with stop loss.
🏷 **Tags**:
\#NVDA #OptionsTrading #SwingTrade #WeeklyOptions #TradingView #StockMarket #EarningsPlay #MomentumTrading #OptionsFlow #GammaRisk
NVDA Weekly Trade Setup (2025-08-02)
### 🟢 NVDA Weekly Trade Setup (2025-08-02)
🚀 **BULLISH CONSENSUS** across 5 top-tier models
📉 Daily RSI: Weak — but weekly trend is STRONG
💼 Institutional Volume: Confirmed accumulation
📊 Options Flow: Call/Put leaning bullish
---
### 🎯 TRADE SETUP
**💥 Direction:** CALL (LONG)
**📍 Strike:** \$182.50
**📅 Expiry:** 2025-08-08
**💵 Entry:** \$0.73
**🎯 Target:** \$1.46 (100% gain)
**🛑 Stop:** \$0.36 (50% risk cap)
**✅ Confidence:** 75%
**🕒 Entry Timing:** At market open
---
### 🧠 Model Breakdown:
✅ **Grok/xAI:** Weekly bullish, 4/5 signals green
✅ **DeepSeek:** Volume confirms; cautious on daily RSI
✅ **Google/Gemini:** Bullish weekly > bearish daily
✅ **Claude:** Weekly momentum + rising options flow
✅ **Meta/Llama:** All signals aligned for \$182.50 call
---
### ⚠️ Risk Watch:
* Falling Daily RSI = short-term drag risk
* Key Support: Watch for \$178 breakdown
* Earnings/events could spike volatility
---
### 📦 TRADE JSON (for tracking):
```json
{
"instrument": "NVDA",
"direction": "call",
"strike": 182.50,
"expiry": "2025-08-08",
"confidence": 0.75,
"profit_target": 1.46,
"stop_loss": 0.36,
"size": 1,
"entry_price": 0.73,
"entry_timing": "open",
"signal_publish_time": "2025-08-03 00:54:05 UTC-04:00"
}
```
---
🔥 *“Smart money is circling. Ride the wave, not the noise.”*
💬 Drop your thoughts below. Will NVDA break \$185 next week?

$NVDA bull flag potentialNASDAQ:NVDA setting up with a bull flag formation on the daily. A strong ER with good guidance can get us to 140-145. A less than stellar guidance can break the bull flag thesis and send it back to the 120-125 range, with some gaps below.

NVIDIA $NVDA | NVIDIA EARNINGS REPORT Nov. 20th, 2024NVIDIA NASDAQ:NVDA | NVIDIA EARNINGS REPORT Nov. 20th, 2024
BUY/LONG ZONE (GREEN): $148.75 - $165.00
DO NOT TRADE/DNT ZONE (WHITE): $138.00 - $148.75
SELL/SHORT ZONE (RED): $118.25 - $138.00
Weekly: Bullish
Daily: Bullish
4H: Bullish
NASDAQ:NVDA reports earnings today, these are the areas that I will look for significant price movement at. The market is anticipating around an 8.5% move, roughly an $11.50 move in either direction, based on ATM option prices, or an 11%-12% move, roughly $16.50 move in either direction, based on volatility calculations.
This is what I would personally look at before entering trades, everything is subject to change on a daily basis and as I analyze different timeframes and ideas.
ENTERTAINMENT PURPOSES ONLY, NOT FINANCIAL ADVICE!
trendanalysis, trendtrading, priceaction, priceactiontrading, technicalindicators, supportandresistance, rangebreakout, rangebreakdown, rangetrading, chartpatterntrading, chartpatterns, spy, sp500, s&p, fed, federalreserve, fedrate, fedratecut, interestrate, jeromepowell, fedchair, 50bps, volatile, volatility, nvidia, nvidiapricetarget, nvdatrend, nvidiatrend, nvdasetup, nvidialongs, nvidiashorts,

Long $NVDA @ 144.50- SL $ 137.0Long NASDAQ:NVDA @ 144.50- SL $ 137.0
Tgt $ 151
Tgt-2 - $ 155
Tgt-3 - $ 165
If its follow the great earning trend then ultimate tgt $ 190-$200
Please like and follow for more ideas
Thank you

#NVDA: Is price going to hit 200-210? Let's wait and seeDear Traders,
First of all, we are mainly looking at the technical and we make decision on what we see on the chart. That is why in our view, behaviour of the price has shown us that there is possibility of swing buy coming and it can be one of the big buying opportunity/investing opportunity. Please this is no guarantee and do your own research before taking any entries.

NVIDIA I expect an up move to the short zone NVIDIA I expect an up move to the short zone and then a down move to take profit 1 and then to the target

NVDA Earnings Outlook:High Premium, Potential Post-Earnings DropNASDAQ:NVDA trades at a premium, with a P/E ratio of 277, towering over the sector median P/E of 25.56 and the S&P 500's P/E of 24.50. Its EV/EBIT is also remarkably high at 207.38 against the sector median of 19.45, signaling significant market sentiment.
The options market's pricing in a potential $50 move,trading well above recommended levels 50-day EMA, suggesting that it might be overbought. While there may be a continued run-up leading to earnings, a post-earnings drop is anticipated. Target levels post-earnings could be $433, $419, and $400. Play the run-up but be cautious to sell the news.

NVDA, Elliot Wave Theory: Analysis and StrategiesNvidia, is expected to present earning results today after market.
As undefined signs in the last days, I decided to make an Elliot wave analysis to check where we are at this point as this stock is long one for me.
I was surprised, scanning Fibonacchi’s on Elliot, that 3rd wave is exended.
No doubt as per fundamentals and innovation that this is a long term growth one. The thing now are its technicals to me, meanwhile we enter in a 4th wave, cost of opportunity is going to take an starring place.
Always taking in a dollars positions. Other countrys where money is not that robust one and or devaluated, shall be the same if your money is in an Elliot 4th wave for a long time or not. Also remember 4th could be not that 0.618 worse point but a 0.382 wich is not bad if your money devaluates less at that point. Then, 5th wave and your devaluation will be double key reasons to stay long.
Back in US dollars, think if you are in and the fourth wave takes place, two strategies come to mind: one is to stay into the 4th wave based on the fundamentals and innovation drivers of this stock, and also accumulate to catch the 5th wave, that well prepared. The the other strategie of these two is just stay out until the 5th takes place if you have a better one to invest, repurchasing when the 5th wave starts, only if you feel good at time management without losing the opportunity cost.
Conclusions> if fundamentals and innovation remain strong, there seems to be no room to lose for this growth investing.
If you are not there and the fourth wave takes place, you will have enough time to buy it.
I hope you like this analysis and it is useful for you.
Invest at your own risk.

NVDA channel.We see a long-term channel (purple lines). It started in 2016. In October 2018, it was broken. Then the "Diamond" model was formed. And the growth began until March 2020. Then the price of April 2020 pushed off from the support of the "diamond" and took a course sharply up to rejoin the old purple trend.
Today we are near the trend resistance, the peak growth is limited to $620-630 and the stabilization in the range of $605-615 at best. In the worst case, close to the day of the report, the price will draw something similar to the "Double Top" model and, breaking through the "neck" level, will go down to the support of the channel - to $525.

$NVDA Option Play | Earnings Continuation?$NVDA Technical Analysis & This Week's Option Play
Will NVDA hit $430?
NVDA Headlines:
Chip stocks in focus, as NVDA surpasses INTC
Nvidia gets Street-high price target on console catalyst
The Play:
- If we can hold this channel support expect to see $430-$435 within the next 2 weeks. We're looking to play the continuation into earnings.
NVDA $435 7/17 @ $300-350 per contract
or
NVDA $435 Call 7/24 @ $750-$800 per contract
If you can afford it, I personally prefer the 7/24 contract.
Do not trade this
DotcomJack
