Nvidia - The -25% correction starts now!✂️Nvidia ( NASDAQ:NVDA ) is about to create a correction:
🔎Analysis summary:
After Nvidia retested major support in mid 2025, we saw another rally of about +125%. But now, Nvidia is rejecting a major resistance trendline and is about to create bearish confirmation. Quite likely that Nvidia will create a major -25% correction in the future.
📝Levels to watch:
$140
SwingTraderPhil
SwingTrading.Simplified. | Investing.Simplified. | #LONGTERMVISION
Nvdashort

Nvidia - This stock remains quite weak!🔮Nvidia ( NASDAQ:NVDA ) could still drop about -20%:
🔎Analysis summary:
While the entire stock market is heading for new all time highs, Nvidia is still consolidating. Considering the recent retest of the major resistance trendline, Nvidia remains quite weak. Maybe we will even see a short term -20% drop in the near future.
📝Levels to watch:
$150
SwingTraderPhil
SwingTrading.Simplified. | Investing.Simplified. | #LONGTERMVISION

Unfilled Gap = Final Trap? NVIDIA Trade Idea📊 NVIDIA — TRADE IDEA
Hey traders! 👋🔥
I’ve been closely watching NVIDIA, and honestly… the chart is giving me strong Bitcoin-in-October vibes 👀
Back then, BTC looked strong — right before it started a proper corrective move down.
From current levels, I believe NVIDIA can still squeeze higher 🚀
Why? Because we have an unfilled gap in the $200–206 area, and as we all know:
👉 Gaps don’t stay open forever. They get filled.
My base scenario is simple:
📈 NVIDIA pushes into $200–206,
💧 grabs liquidity,
🐻 adds shorts,
➡️ and only then we see a real reversal and a healthy correction.
🎯 DOWNSIDE TARGETS
📉 Target 1: $160
📉 Target 2: $150
📉 Target 3: $140
And honestly… I wouldn’t be surprised to see even lower levels, because on a macro scale I’m expecting a major correction in the S&P 500, and most equities should follow.
⚠️ For now, I’m watching how price behaves near the gap zone.
Let’s see how the chart unfolds 👀📊

Nvidia - This is all still expected!🥊Nvidia ( NASDAQ:NVDA ) is heading for another -20%:
🔎Analysis summary:
Just last month, Nvidia created a massive bearish engulfing candle. This clearly shows that buyers are not willing to accept higher prices. Together with the retest of the major resistance trendline, Nvidia is heading lower. The next support will come at about -20%.
📝Levels to watch:
$150
SwingTraderPhil
SwingTrading.Simplified. | Investing.Simplified. | #LONGTERMVISION

NVDA which direction?Im saying the area 195-203 is critical what happen when tested could be clear the next direction, if breakthrough to the ascending channel then bullish, if rejected could be bearish to test lower levels than 170 to possible 140 for solid support.
lets see next 2 weeks

Nvidia - The correction just started!💉Nvidia ( NASDAQ:NVDA ) is now heading lower:
🔎Analysis summary:
Just recently, Nvidia once again retested the major rising channel resistance trendline. Together with November's bearish engulfing candle, Nvidia is slowly shifting bearish. And before Nvidia will retest the next major support area, we can see a drop of another -15%.
📝Levels to watch:
$150
SwingTraderPhil
SwingTrading.Simplified. | Investing.Simplified. | #LONGTERMVISION

Nvidia - Now is the time to go short!💣Nvidia ( NASDAQ:NVDA ) is now creating a top:
🔎Analysis summary:
Just a couple of days ago, Nvidia perfectly retested a major resistance trendline. Always in the past, such a retest was followed by a major move towards the downside. Therefore, Nvidia is preparing for a major drop, which could lead to another -25% drop in the future.
📝Levels to watch:
$180 and $140 and $100
SwingTraderPhil
SwingTrading.Simplified. | Investing.Simplified. | #LONGTERMVISION

NVDA – Inventory Panic or Blackwell Positioning?Nvidia just became the center of another “AI bubble” debate after headlines highlighted a 32% Q/Q inventory increase. The surface-level take was bearish, but the clarification from management changed the context. According to today’s memo, the buildup is preemptive staging for the Blackwell platform, not a sign of weakening demand. These units are tied to presold systems, meaning this is logistics positioning, not channel stuffing.
On the tape, the story is more technical than fundamental. Heavy insider selling (CEO/CFO), hedge fund trimming, and SoftBank pressure all created the sell-side imbalance we’ve been seeing for weeks. But despite those headwinds, the chart continues to defend major support zones.
Key Observations:
• 177–178 acted as the first demand pocket, aligning with trend support and prior volume nodes.
• Price continues trading within a controlled downtrend, but each flush is producing diminishing downside extension—a sign of seller exhaustion.
• The real liquidity magnets remain below:
– 172.93
– 170.69
– 164.01 (golden support if the market unwinds further)
The bearish narrative points to elevated inventories and institutional unloading. The bullish narrative focuses on Blackwell staging and enterprise AI demand still being early-cycle. Both can be true at once. That’s why the environment favors high-probability scalps, not oversized directional bets.
My Read: This is a volatility market. NVDA is still in discovery mode, and both sides will get opportunities. Until NVDA reclaims 182.55, sellers maintain short-term control. A break below 172.93 opens a path into the 170/169s where real buyers should step in.
This isn’t about predicting a hero reversal—it's about respecting levels and trading the reaction.
📌 PROFIT TARGETS & STOP ZONES (Required by TV)
Upside Targets:
• 182.55 (first resistance)
• 186.20 (gap fill supply zone)
• 190.17–191.05 (major distribution shelf)
Downside Targets:
• 172.93
• 170.69
• 164.01 (golden support)
Invalidation / Stop Zone:
• Close above 186.50 invalidates the short-term bearish drift.
• Close below 170 invalidates the shallow bounce thesis and opens deeper liquidity.

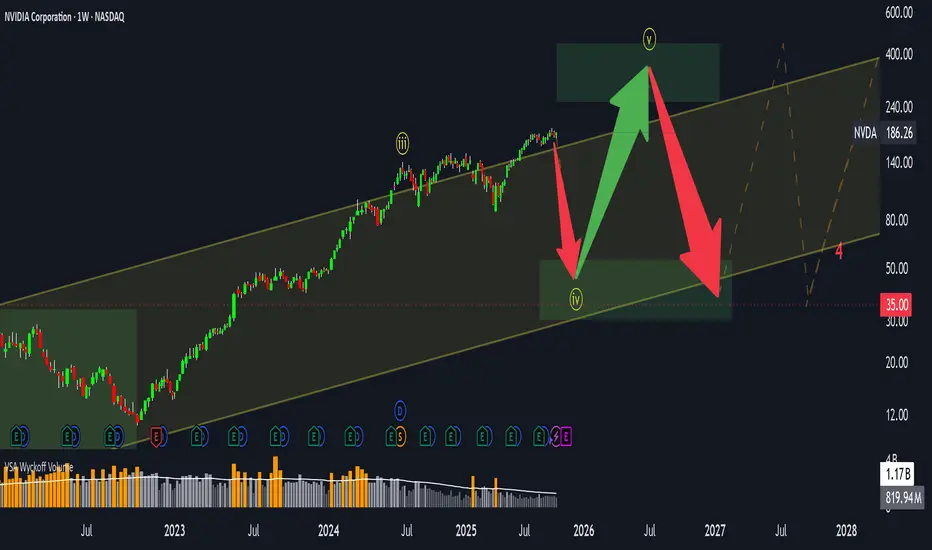
NVIDIA (NVDA): Where Are We in the Cycle?Ticker: NVDA
Category: Market Structure / Elliott Wave Analysis
Author’s note: Educational analysis — not financial advice.
🧠 Market Context
NVIDIA has been one of the strongest growth stories in the last market cycle. However, after such a powerful move, many traders are now asking: Where are we in the broader structure — and what could come next?
From a structural perspective, NVDA appears to have completed its third Elliott Wave, with the fourth wave currently in progress. This phase often reflects a period of consolidation, where the market digests previous gains before potentially starting the fifth wave.
📊 Elliott Wave Structure
Through the lens of Elliott Wave theory:
Wave 3 — likely completed after the parabolic advance that marked NVIDIA’s latest all-time highs.
Wave 4 — a corrective phase, potentially forming a sideways or slightly downward structure.
Wave 5 (ahead?) — may still occur, possibly extending above the upper boundary of the current price channel.
However, once the fifth wave completes, markets typically enter a longer consolidation or corrective phase — often retracing 50–60% of the total move from the highs.
⚙️ Volatility and Price Range
Currently, NVDA is trading within a broad channel, roughly between $100 and $400+.
Volatility remains elevated — which suggests that the sideways phase could persist for several months, or even longer.
Such behavior is common in late-cycle stages when large market participants distribute part of their holdings while retail interest remains high.
📈 Key Takeaways
The main impulsive move seems to have already played out.
The market may enter a range-bound or sideways phase, with local rallies still possible.
Correction risks are gradually increasing, especially if the fifth wave develops and fails to sustain new highs.
In short, this might not be the best time to chase — but rather to observe how price behaves within the current channel.
💬 Final Thoughts
This analysis is purely educational and reflects one possible scenario based on market structure.
No one can predict the exact timing or depth of the next move — the market always decides.
👉 What do you think?
Are we already in the correction phase, or is there still one more leg up left for NVDA?
Share your view in the comments below 👇
SPY MAJOR CORRECTION INCOMINGWhat up, fam? I'm back on my market Nostradamus grind, and I got a feeling y'all gotta hear about. Time to drop some knowledge! 🧠
Listen, rewind to February 14, 2025 🗓️. That day, my trading system was ringing the alarm bells like crazy. It gave me a super early heads-up that a major U-turn, a reversal, was about to hit the market.
Where did that heat check come from? Nvidia (NVDA) stock.
I saw it sitting high, maybe around $140, and I dropped a bomb: I said Nvidia was taking a trip down to $90. 💣
Y'all remember that? I got roasted! People called me all types of crazy names—clown, dummy, you know, the usual investor insults when you try to call the market's shot. But guess what? My system came through. The proof is in the pudding. 🧾
📉 Time for the Next Big Drop: SPY
Now, I'm dropping another prophecy, and it's for the big dog: SPY (that's the S&P 500 ETF, for those sleeping).
I'm calling for a major correction—a big ol' dip—just like the one we saw back in March and April 2025.
I'm predicting this correction is gonna take us all the way back down to the $480 level we saw in 2025. If it gets real ugly, we might even erase all the gains of 2025 and re-test those earlier 2025 lows. Don't say I didn't warn you! ⚠️
💡 The Secret Sauce: It Ain't Luck
Why am I posting this now? For two reasons:
For the Records: This post is my time stamp. I can send people back here when it happens and say, "I told you so!" 😉
To Show You This: The market is predictable. You can get early warnings and see the signs before a big move hits. 🔔
But here’s the real talk: you gotta put in the work. You can't just wish upon a star. To get to this level, you have to master:
Reading the Charts
: Being a boss at understanding the flow. 📊
Math
: Understanding the numbers game. ➕
Self-Worth
: Believing in your own study and research skill. 💪
That's all for today. Don't be mad when it happens.
See you at $485 in the SPY! Before summer 2026 target. Peace out. ✌️

NVIDIA - Stalking NVDA with a short trade in mind🔱 Second approach to crack the U-MLH 🔱
No matter how irrational markets get, sooner or later the Black Bird strikes them down.
We’re back at the U-MLH where price is stretched.
Could it trade through it?
Absolutely.
Even better would be if price trades above the U-MLH and then falls back into the fork — that would be a strong confirming short signal.
But a turn right at the U-MLH would also be a heads-up for me.
👉 Stalking NVDA with a short trade in mind.
NVIDIA – Enormous Pressure After Reaching the Stretch LevelBetween July 31 and August 13, price kept nagging at the white U-MLH,
but there wasn’t enough strength to break through.
From there, price began to drift lower, pressing against the red U-MLH.
The close last Friday failed to break below the red U-MLH –
a clear sign of weakness!
If the green mini-trendline gives way and the white ¼-Line moves above price as well,
NVDA could be ripe for a short setup.
Let’s stalk the trade.
NVDA $182 Weekly CALL Setup – Cheap Premium, Big Upside?
# 🚀 NVDA Weekly Options Trade Idea (2025-09-03)
### 📊 Multi-Model Recap
* **Daily RSI**: 📉 34.3 (weak)
* **Weekly RSI**: 🔻 73.2 (falling)
* **Volume**: +1.3x → institutional distribution signs
* **Options Flow**: 🔥 C/P = 1.96 (bullish skew)
* **Gamma/Theta**: ⚡ High risk (2 DTE)
👉 Models Split:
* 🐻 Bearish: Claude, Gemini → favor \$165 PUT
* 🐂 Bullish: Llama, Grok → favor \$175 CALL
* 😶 Neutral/No Trade: Claude (low confidence)
---
### 🧭 Consensus Read
* Price & volume = bearish ⚠️
* Options flow & VIX = bullish 📈
* Net: **Mixed bias → tactical bullish bounce possible**
---
### ✅ Trade Setup (Viral Play)
```json
{
"instrument": "NVDA",
"direction": "CALL",
"strike": 175,
"expiry": "2025-09-05",
"entry_price": 0.68,
"profit_target": 1.36,
"stop_loss": 0.34,
"size": 1,
"confidence": 0.65,
"entry_timing": "market open"
}
```
---
### 🎯 Trade Details
* 📌 **Strike**: \$182 CALL
* 💵 **Entry**: 0.68 (ask, open)
* 🎯 **Target**: 1.36 (+100%)
* 🛑 **Stop**: 0.34 (-50%)
* 📅 **Expiry**: Sep 5 (2 DTE)
* 📈 **Confidence**: 65%
* ⏰ **Hold Policy**: Close by Thu EOD (don’t ride Friday gamma bomb)
---
⚠️ **Risks**:
* 2 DTE = 🔥 high gamma / fast theta decay
* Divergent signals → whipsaws possible
* Tight stop discipline required 🚨

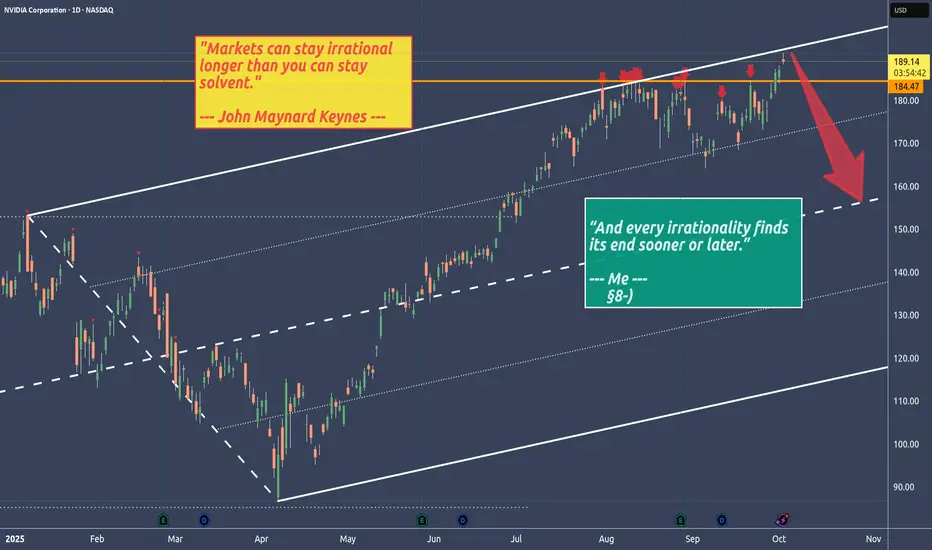
NVDA - Watch the show, until the Sh** hits the FanThe expected “end of hype” around Nvidia stems from its current inability to forecast H20 chip sales to China, forced production halts, and growing political friction—despite its strong financial performance elsewhere.
The tension between U.S. export policy and China’s technological self-reliance is creating real operational and strategic obstacles for Nvidia.
In this weekly chart we still have an upward projection.
Nonetheless do we all know what a Game NVDA is playing by selling to its one companies.
The air is thin, very thin up there.
And after the Earnings Report we all know how the books are pimped.
A breach of the CIB line would make me go "hmmm....", and starting to look for a short.
Until then, just relax and watch the show.
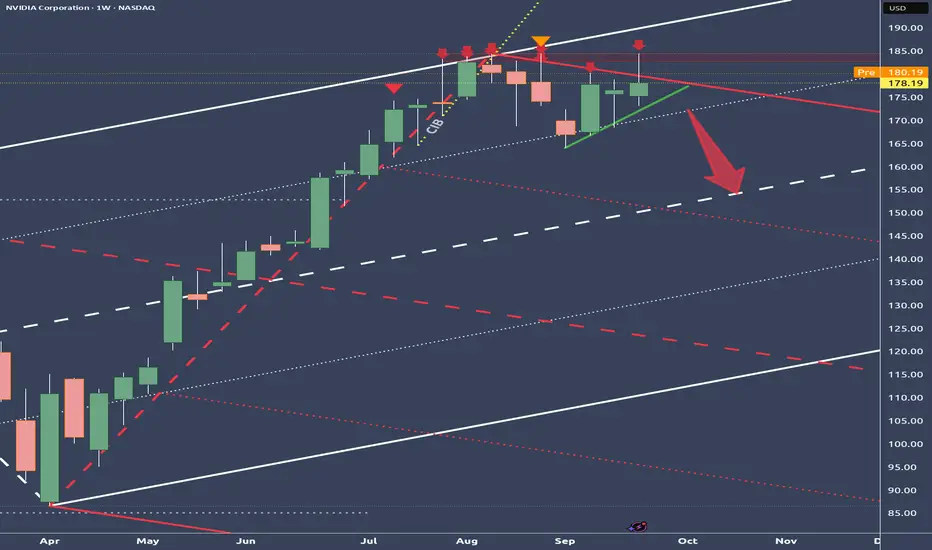
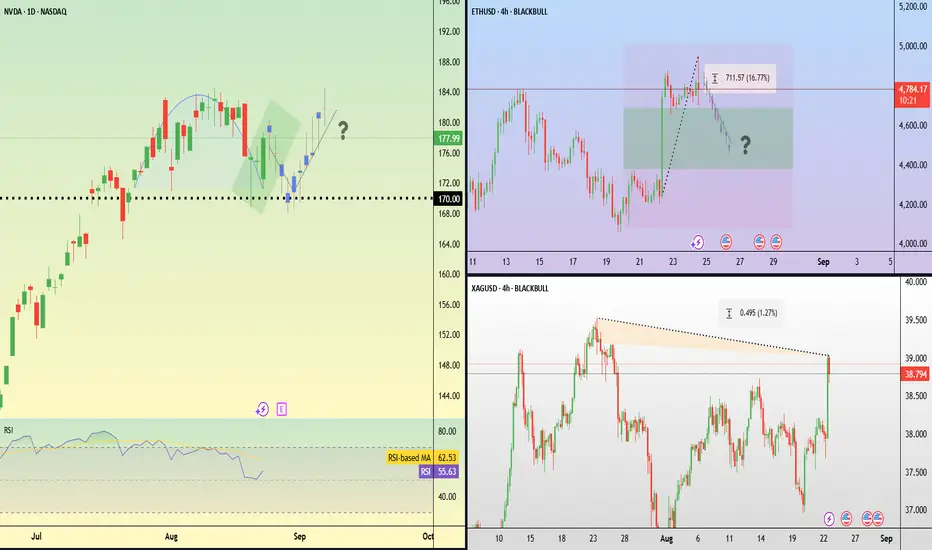
Traders caught off guard --- Now NVDA's Reverse Cup and HandleTraders were caught off guard by Federal Reserve Chairman Jerome Powell’s unexpectedly dovish tone at the Jackson Hole symposium.
In his keynote, Powell highlighted softening inflation risks and growing concerns over the labour market, boosting market expectations of a 25-basis point rate cut in September.
The speech ignited a strong cross-asset rally. Equities surged, with the S&P 500 up 1.5% and the Nasdaq advancing 1.9%. Ethereum led digital assets higher, soaring 15%, climbing as high as $4,950 and surpassing its previous November 2021 high of $4,866. Silver also rallied, touching $39 per ounce and moving closer to its 14-year peak of $39.5 reached at the end of July.
Looking ahead, U.S. markets will turn their focus to Nvidia’s upcoming earnings results. Price action shows a series of higher highs and higher lows, but the stock has recently faced resistance near $190. Price potentially remains supported around $170, which aligns with the breakout zone from early August.
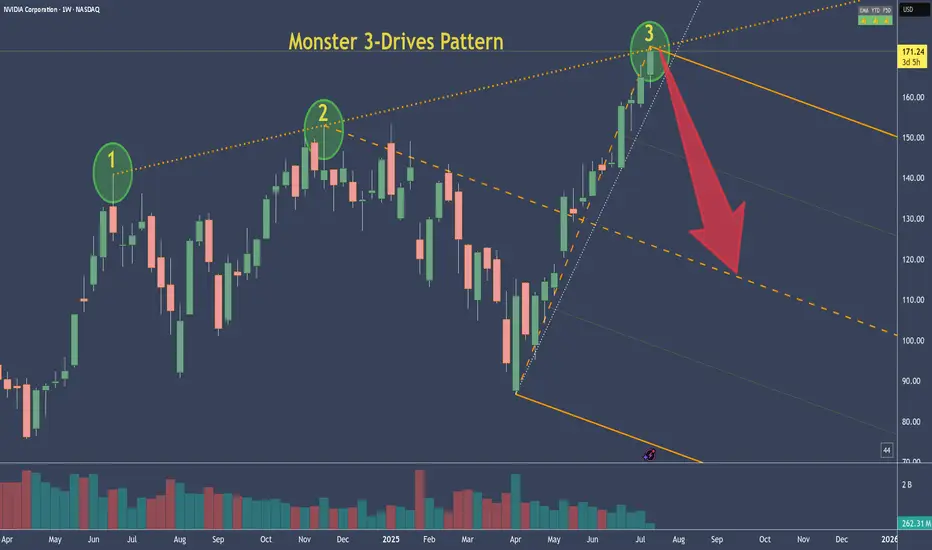
NVDA - NVIDIA's 3-Drive Pattern target if it plays outThis is the weekly chart of NVDA.
We can clearly see a 3-Drives pattern forming.
If this pattern plays out, the centerline would be my target. Of course, it's still too early to short.
But I’ve got my hunting hat on and I'm watching for signals on the daily chart.
One would be a break of the slanted trendline—but there are a couple of other conditions that need to align as well.
Always ask yourself: What if?
SHORT Nvidia, Bearish Chart Setup, Resistance ConfirmedThe resistance from 21-May has been confirmed 28-May.
The same level has been working as resistance since 14-May.
After two weeks, this resistance level continues to hold and it is now confirmed.
In November 2024 NVDA produced a high.
Later in January 2025 NVDA produced an all-time high.
18-February 2025 NVDA went to produced a lower high; a rejection that led to a major drop.
The major drop resulted in a recovery and the recovery found resistance earlier this month. This resistance, the same from 14-May, 21 and 28-May, is also a lower high compared to the previous levels just mentioned.
The signal here is double: (1) Resistance confirmed and (2) a lower high.
There is one more. 28-May produced a volume breakout day. The day ended up closing red. So, Nvidia is confirmed bearish now.
Thank you for reading.
Namaste.

$NVDA - head and shoulders + possible bull shark harmonicOn my chart, NVDA appears to be potentially forming a head and shoulders pattern.
At the same time, an almost perfect bullish shark harmonic woukd comple around the target for the head and shoulders pattern.
Could be something, could be nothing.
But I'll be careful and not spend my money on NVDA just yet.
Positive earnings might invalidate this idea and send NASDAQ:NVDA to the moon instead.
Let's see what happens.

NVDA Weekly Options Trade Plan 2025-05-25NVDA Weekly Analysis Summary (2025-05-25)
Model Summaries Grok/xAI: Mixed technical signals—bullish on daily, bearish on 5-minute; neutral overall; no trade recommended (55% confidence). Claude/Anthropic: Moderately bearish; recommends buying the $128 put at ~$3.60 for a 50–100% profit target; confidence 72%. Llama/Meta: Moderately bearish but views premium/risk as unfavorable for buying; instead suggests selling the $130 put; confidence 70%. Gemini/Google: Strong intraday bearish technicals and negative sentiment; recommends buying the $120 put at ~$1.24 as a day trade; confidence 65%. DeepSeek: Moderately bearish but sees premiums >$1 as too rich; no trade recommended (55% confidence). Areas of Agreement and Disagreement Agreement: • Overall moderately bearish bias for NVDA into weekly expiry. • Rising VIX, max-pain near $126, and negative news support downside. Disagreement: • Trade/no-trade: Grok and DeepSeek pass, Claude, Gemini and Llama propose trades. • Strike selection: Claude prefers $128 put; Gemini $120 put; Llama sells $130 put. • Strategy type: All bearish ideas are buy puts except Llama, which suggests naked put selling. Conclusion Overall Market Direction: Moderately Bearish for the week ending 2025-05-30. Recommended Trade: Buy a weekly put to capture the expected pull toward the $126 max-pain level. • Instrument: NVDA 2025-05-30 $128 Put • Entry Timing: At market open • Entry Price: $3.65 (ask) • Profit Target: $5.48 (≈50% gain ⇒ midpoint sell or scale) • Stop Loss: $2.56 (≈30% loss) • Size: 1 contract Confidence Level: 70% Key Risks and Considerations: • Intraday oversold conditions could trigger a short-term bounce. • Theta decay accelerates late in the week—need timely exit. • Holiday-shortened week may damp momentum. • Liquidity is good at the $128 strike but bid-ask spread and slippage can impact execution.
TRADE_DETAILS (JSON Format)
{ "instrument": "NVDA", "direction": "put", "strike": 128.0, "expiry": "2025-05-30", "confidence": 0.70, "profit_target": 5.48, "stop_loss": 2.56, "size": 1, "entry_price": 3.65, "entry_timing": "open", "signal_publish_time": "2025-05-25 10:57:51 UTC-04:00" } 📊 TRADE DETAILS 📊 🎯 Instrument: NVDA 🔀 Direction: PUT (SHORT) 🎯 Strike: 128.00 💵 Entry Price: 3.65 🎯 Profit Target: 5.48 🛑 Stop Loss: 2.56 📅 Expiry: 2025-05-30 📏 Size: 1 📈 Confidence: 70% ⏰ Entry Timing: open 🕒 Signal Time: 2025-05-25 10:58:05 EDT
Disclaimer: This newsletter is not trading or investment advice but for general informational purposes only. This newsletter represents my personal opinions based on proprietary research which I am sharing publicly as my personal blog. Futures, stocks, and options trading of any kind involves a lot of risk. No guarantee of any profit whatsoever is made. In fact, you may lose everything you have. So be very careful. I guarantee no profit whatsoever, You assume the entire cost and risk of any trading or investing activities you choose to undertake. You are solely responsible for making your own investment decisions. Owners/authors of this newsletter, its representatives, its principals, its moderators, and its members, are NOT registered as securities broker-dealers or investment advisors either with the U.S. Securities and Exchange Commission, CFTC, or with any other securities/regulatory authority. Consult with a registered investment advisor, broker-dealer, and/or financial advisor. By reading and using this newsletter or any of my publications, you are agreeing to these terms. Any screenshots used here are courtesy of TradingView. I am just an end user with no affiliations with them. Information and quotes shared in this blog can be 100% wrong. Markets are risky and can go to 0 at any time. Furthermore, you will not share or copy any content in this blog as it is the authors' IP. By reading this blog, you accept these terms of conditions and acknowledge I am sharing this blog as my personal trading journal, nothing more.

US President Says All Necessary Permits Will Be Given to NVDAIn shocking turn of events today, US President Donald Trump said "All necessary permits will be expedited delivered to Nvidia."
The asset however, fail to play according to the rhythm of the fundamental, up by 1.51% as of the time of writing with the RSI at 56.27. Nvidia has also been plaque by Trump's tariff rate increment that saw the shares lose about 29% in market value for the past 3 weeks.
For Nvidia Shares ( NASDAQ:NVDA ), a break above the $150 resistant could pave way for a bullish course. Similarly, failure to break pass the resistant point could resort to a bearish reversal bringing it back to the support point.
Analyst Forecast
According to 43 analysts, the average rating for NVDA stock is "Strong Buy." The 12-month stock price forecast is $172.76, which is an increase of 53.68% from the latest price.

FREE Day Trade Setup 15April: $NVDA🚨 FREE Day Trade Setup: NASDAQ:NVDA 🚨
🚀 Bullish Scenario:
Entry: Break above $111.88 (S/R Area)
🎯 Targets: 10% / $112.70, $114.05, PDH
📈 Instruments:
Options: April 18th $112 Calls
🚪 Exit: Close below H5 on chosen timeframe (2m / 5m / 15m)
📉 Bearish Scenario:
Entry: Break below PDL at $109.07
🎯 Targets: 10% / $108.01, $106.92, $105.77
📉 Instruments:
Options: April 18th $109 Puts
🚪 Exit: Close below H5 on chosen timeframe (2m / 5m / 15m)
Not Financial Advice

NVIDIA At The 1/4 Line - Secure Profits Now?
Currently at the 1/4 line, we can expect a potential pullback. So, if you want to secure some of your fat profits, just do it.
Why not 50% ?
If it goes up again, you have secured 50%.
If it goes down, you still have 50% for a runner.
However, I'm still follow the rule-set and the trading-framework of the Medianlines. Doing this, I know that prices PTG is the Center-Line.

NVDA - Do it again Sam - Insider only sold, not boughtI have posted enough about what's going on in NVDA. It's important in this Stock, to not going crazy, not matter what one thinks it "will" or "could" happen.
A great Hint by Unusual Whales is, that insiders had only sold in the last year, never bought their one Stock.
...what does that telly us?
May profits be with us §8-)
