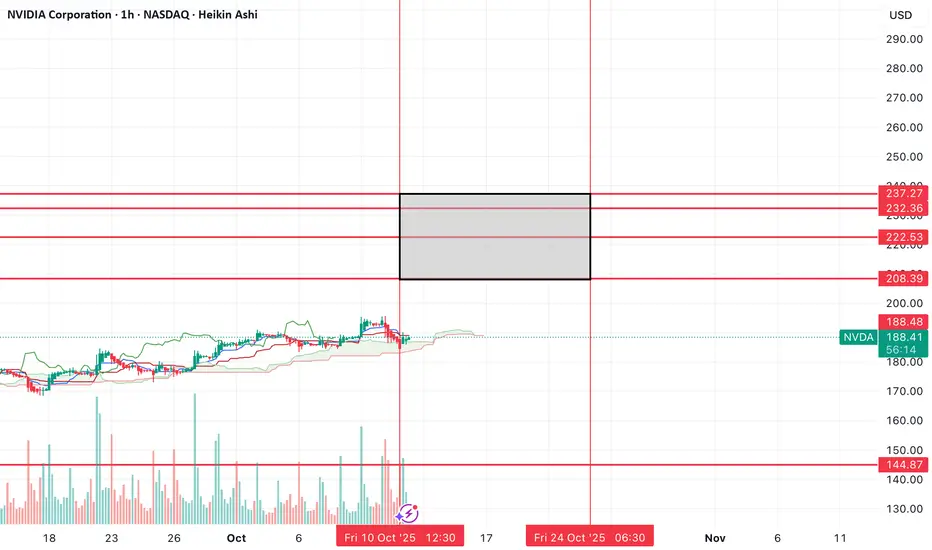
$NVDA final leg higher? Over $200?The move down on Friday looks like it marked a low to me and that we could see our final move higher from here.
It's been my idea that we see a blowoff top over the next couple of weeks, so I think these levels in the box will mark the top.
I think it's most likely that we get somewhere between the $222 level and $232 level, but I've marked off other levels just incase.
I've taken some calls, let's see how the move plays out from here.
Nvidia
Nvidia to Recover: Just A Bump In the Road?Trump’s remarks about China close to Friday’s weekly close sent markets into a brief panic. Nvidia had just made a new all-time high, breaking through the previous top and resistance near 184, and was attempting another leg higher despite the US government shutdown. His comments triggered a 7 percent selloff, causing NVDA to retest the previous resistance zone from above.
The 182–184 area is now the primary support. After Trump slightly eased tensions, the stock is up 3 percent in premarket trading today. The road ahead may be bumpier than bulls would like, but the upside remains the base case for now. If both the 182–184 zone and the 177 support fail, that would be the point where the bullish outlook should be reconsidered for the short to medium term.

NVDA Showdown:Will Bulls Charge to $204 or Bears Drag Us to $163If NVDA falls under $179, it might quickly drop to $176.70. If it keeps falling, the next stop could be $163. But if NVDA goes up and closes above $188, we could see it reach $199 or even $204.
Why do these levels matter? Because a big move could happen soon; either a big fall or a strong jump up. What would you do if NVDA hit these prices? Have you seen this happen before?
If you’re wondering what these moves could mean for you, or if you have questions, just send me a message. Sometimes one good question leads to your best trade ever. What would you ask if you could get a clear answer?
Mindbloome Exchange/ Trade What You See

Nvidia Stock Nears the $200 MarkNvidia’s stock has gained more than 4% over the last three trading sessions. The price currently hovers slightly above $190 per share, marking new record highs and moving closer to the psychological level of $200.
Buying pressure has intensified after the U.S. government authorized a series of agreements allowing the export of advanced artificial intelligence chips to the United Arab Emirates, opening a strategic trade channel with the Middle East. This development has strengthened investor confidence, fueled by higher long-term revenue expectations for the company. As a result, buying momentum may continue to dominate in the short term.
Relevant Uptrend
Since early April, the stock has maintained a steady upward trend, consistently posting new highs that confirm a dominant bullish bias on the broader chart. So far, there have been no significant corrections threatening this structure, leaving the uptrend line as the key reference for short-term movements.
However, as the price approaches the $200 level, a phase of indecision could emerge due to signs of buyer exhaustion, reflected in the formation of weakening candles. This behavior could lead to technical pullbacks within the broader bullish trend.
RSI
The RSI line remains above the 50 level, indicating that buying momentum remains dominant over the past 14 trading sessions. However, the indicator is gradually approaching the overbought zone (70). If it reaches this level, it could signal an imbalance in market forces, opening the door to short-term downward corrections.
MACD
The MACD histogram remains close to the neutral line (0), suggesting a lack of clear directional strength in the short-term moving averages.
Both indicators point to a potential phase of indecision in short-term movements, allowing for a possible period of consolidation within the current bullish bias, especially if no new major catalysts emerge to drive aggressive buying pressure in the coming sessions.
Key Levels to Watch:
$200 – Psychological Resistance: In the absence of historical references, this level stands out as the most relevant short-term price point. It could act as a technical barrier, triggering temporary pullbacks.
$184 – Near-Term Support: Corresponds to the recent retracement area. A drop below this level could neutralize bullish momentum and lead to a sideways consolidation phase.
$170 – Key Support: Associated with recent lows, located below the 100-period moving average. A sustained move under this level could shift the market structure and pave the way for a dominant bearish bias.
Written by Julian Pineda, CFA – Market Analyst

Nvidia - Starting a clear +20% rally!🧲Nvidia ( NASDAQ:NVDA ) rallies higher now:
🔎Analysis summary:
About one decade ago, Nvidia broke out of a major bullish triangle pattern. Following this remarkable breakout, Nvidia continued with a rally of about +35.000%. But looking at all these previous cycles, Nvidia remains bullish with another potential +20% move towards the upside.
📝Levels to watch:
$200, $250
SwingTraderPhil
SwingTrading.Simplified. | Investing.Simplified. | #LONGTERMVISION

NVIDIA Next stop.. $200For a long time we've been calling for a $200 Target on NVIDIA Corporation (NVDA). That was our main Target for the Bull Cycle that started in November 2022. The stock is very close to this level and the short-term pattern that can get to it is this Channel Up.
Supported by the 1H MA100 (green trend-line), NVIDIA has been posting Bullish Legs of around +10% since the September 05 Low. The confirmation signal for those Legs has been a 1H MACD Bullish Cross.
Given that we formed one yesterday, we expect the price to be on such a Bullish Leg already. The 'weakest' of those sequences has been +9.58%, which if repeated, lands marginally above the $200 psychological level.
Time to hit it?
-------------------------------------------------------------------------------
** Please LIKE 👍, FOLLOW ✅, SHARE 🙌 and COMMENT ✍ if you enjoy this idea! Also share your ideas and charts in the comments section below! This is best way to keep it relevant, support us, keep the content here free and allow the idea to reach as many people as possible. **
-------------------------------------------------------------------------------
💸💸💸💸💸💸
👇 👇 👇 👇 👇 👇

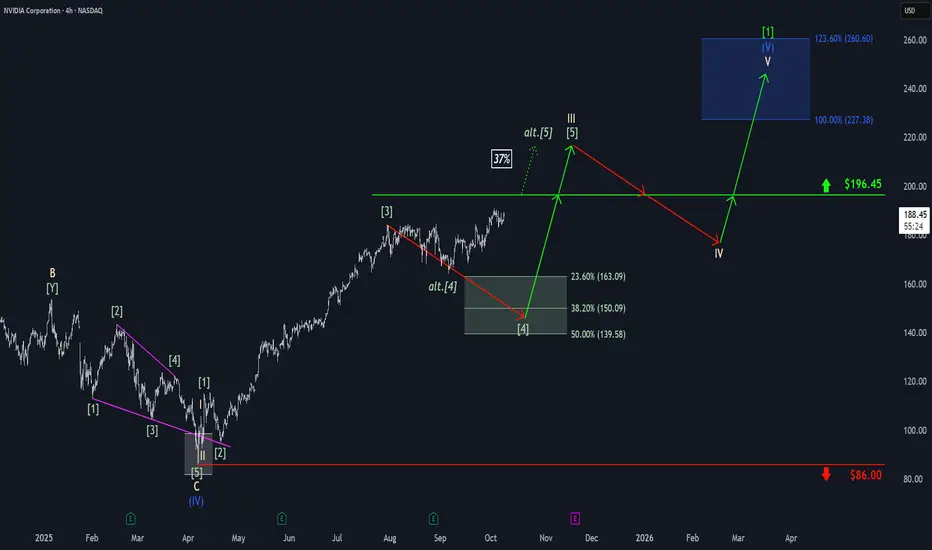
Nvidia: Bullish DistractionAmid bullish momentum, Nvidia edged closer to resistance at $196.45 before settling into sideways action late last week. As a result, there remains a 37% probability that the stock will bypass a new low and instead break directly above the $196.45 level. However, our primary expectation is for the stock to turn lower, targeting our green Target Zone between $163.09 and $139.58 to complete green wave . Only after this move do we anticipate a sustained advance above $196.45, which would mark the completion of beige wave III. Following a wave IV pullback below this threshold, we ultimately expect gains into the blue Target Zone between $227.38 and $260.60, where beige wave V should complete not only blue wave (V), but also the larger neon green wave .
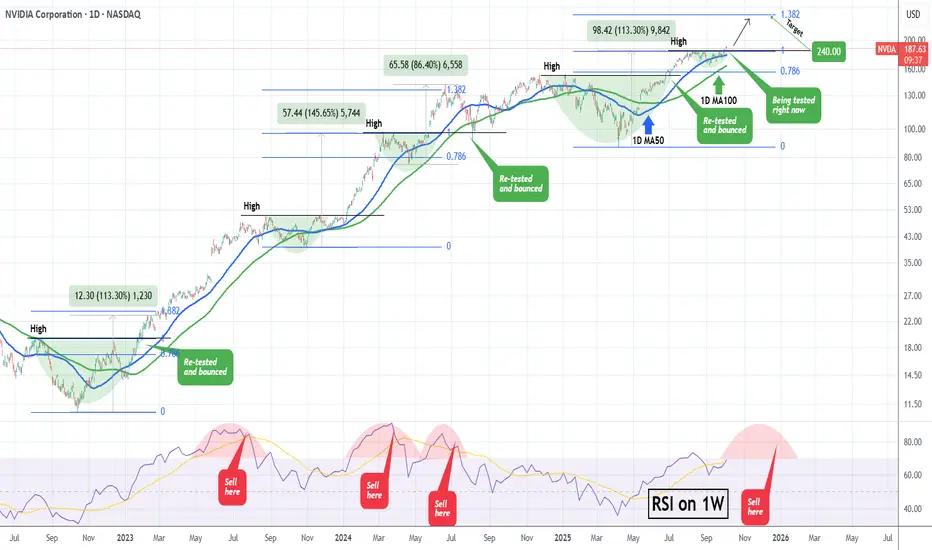
NVIDIA What happens when it retests a Resistance after a break?NVIDIA Corporation (NVDA) has been on a strong rise since the mid-term September 05 Low and this week finally broke above its previous $184 High. During the current Bull Cycle (since the October 2022 bottom), every time the price broke above a previous High and re-tested it as a Support, it started a secondary rally to new Highs.
Technically, as long as the 1D MA100 (green trend-line) holds, we should see at least a 1.382 Fibonacci extension test, similar to the February 2023 and June 2024 Highs. As a result, once the current former High / Resistance level finishes getting re-tested, we expect an end-of-the-year rally to $240.
Additionally, we will keep an eye on the 1W RSI. Typically, once it gets massively overbought above 85.00 and then starts to decline within an Arc peak formation, the time to Sell is after the middle of that Arc.
-------------------------------------------------------------------------------
** Please LIKE 👍, FOLLOW ✅, SHARE 🙌 and COMMENT ✍ if you enjoy this idea! Also share your ideas and charts in the comments section below! This is best way to keep it relevant, support us, keep the content here free and allow the idea to reach as many people as possible. **
-------------------------------------------------------------------------------
💸💸💸💸💸💸
👇 👇 👇 👇 👇 👇
Constellation Energy Back Up to $350CEG is on major support and *likely* to rise back up to $350 and above. That would be the next major support if it gets above.
Good luck!

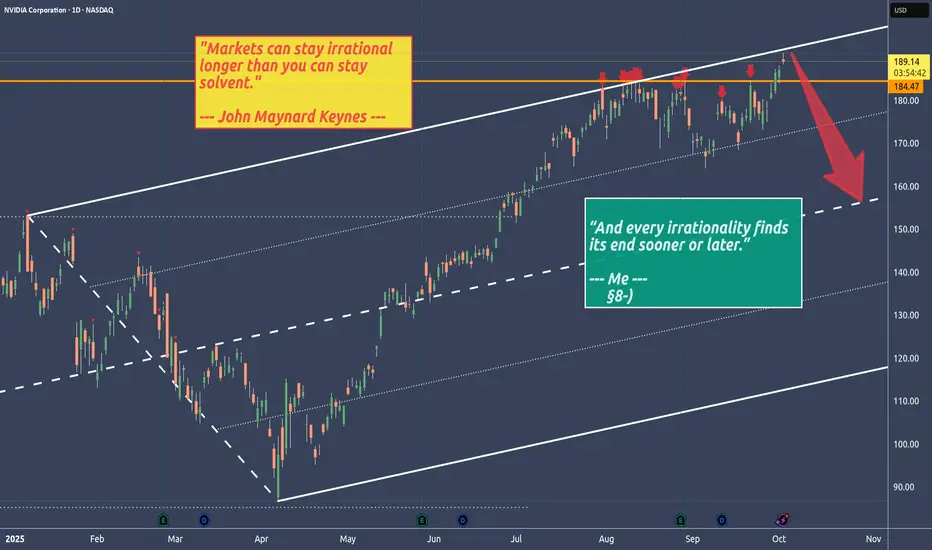
NVIDIA - Stalking NVDA with a short trade in mind🔱 Second approach to crack the U-MLH 🔱
No matter how irrational markets get, sooner or later the Black Bird strikes them down.
We’re back at the U-MLH where price is stretched.
Could it trade through it?
Absolutely.
Even better would be if price trades above the U-MLH and then falls back into the fork — that would be a strong confirming short signal.
But a turn right at the U-MLH would also be a heads-up for me.
👉 Stalking NVDA with a short trade in mind.
Why DraftKings (DKNG) Stock Could Reach $57 by End of 2025DraftKings Inc. (NASDAQ: DKNG), a leading U.S. online sports betting and iGaming operator, is positioned for potential upside to $57 per share by December 31, 2025, based on analyst consensus, robust growth projections, and market tailwinds. As of early October 2025, the stock trades around $42–$43, implying roughly 32–36% appreciation from current levels. This target aligns closely with the average analyst price target of $57.57 (from 30 reports), which reflects a "Strong Buy" consensus (1.25 ABR on a 1–5 scale, with 26 buys, 0 holds, 0 sells).
Below, I'll outline the key drivers, supported by recent data.1. Strong Revenue and Profitability Guidance for FY 2025 DraftKings has guided for FY 2025 revenue of $6.2–$6.6 billion (31% YoY growth at midpoint) and adjusted EBITDA of $900 million–$1.0 billion, reaffirming prior estimates after Q3 2024 results (revenue up 39% YoY to $1.095 billion).
2 sources
This trajectory is fueled by:User Growth and Engagement: 41% YoY increase in monthly unique payers in Q3 2024, with average revenue per user rising due to enhanced in-play betting and NBA/iGaming expansions.
Market Share Gains: DraftKings holds ~35% of U.S. online sports betting handle, benefiting from NFL/NBA seasons and new launches (e.g., Missouri pending approval).
Analysts like those at Goldman Sachs note the company's "resilience in online gambling during economic downturns" and positive momentum in customer acquisition, supporting EBITDA beats.
Metric
FY 2024 Guidance (Updated)
FY 2025 Guidance
YoY Growth (Midpoint)
Revenue
~$4.7B
$6.2–$6.6B
+31%
Adjusted EBITDA
$240–$280M
$900M–$1.0B
+250%+
This path to profitability (positive free cash flow expected in 2025) reduces valuation discounts, with forward P/S multiples at ~3.5x (below peers like Flutter at 4x).2. Analyst Optimism and Price Target Momentum Wall Street's consensus points to $57 as achievable, with recent upgrades reflecting confidence in 2025 holds (11–13% in Q1 2025) and parlay/in-play product strength.
Key updates:Zacks: $57.57 average (high $68, low $35), +49.77% upside from ~$38 close.
TipRanks: $54.25 average, 26.93% upside; 53 buys in the past month.
Recent Raises: Truist ($60), Oppenheimer ($65), Piper Sandler ($60), Stifel ($57), JMP ($60), Barclays ($60).
Citizens JMP ($60) cites "materially shifted investor sentiment" post-Q4 2024 beats.
JPMorgan (Overweight, $50 PT) highlights digital gaming's insulation from macro risks like tariffs, unlike land-based peers.
2 sources
High-end forecasts (e.g., $65–$70 from independent models) assume sustained 17–20% revenue CAGR through 2027, driven by iGaming expansion.
3. Strategic Tailwinds and Market ExpansionRegulatory Wins: Full U.S. rollout in 25+ states, plus Jackpocket lottery integration (adding $200M+ revenue potential). Missouri launch could add 2–3% to FY 2025 top line.
Partnerships: Multi-year NBCUniversal deal for sports sponsorships boosts visibility; Larry Fitzgerald Foundation tie-up enhances brand.
Product Innovation: Live betting features and NFT marketplace (DraftKings Marketplace) drive retention; Q3 2025 NFL metrics show 12–14% YoY handle growth in key states like New York.
Macro Resilience: Online gaming weathers consumer slowdowns better than physical casinos, with 37% Q2 2025 revenue growth despite headwinds.
Potential Risks to ConsiderWhile bullish, challenges include:Hold Volatility: Early 2025 NFL outcomes could pressure Q3/Q4 EBITDA (e.g., customer-friendly results trended low per analysts).
Competition: Prediction markets (Kalshi/Polymarket) pose niche threats, prompting a Northland downgrade to Underperform.
2 sources
However, Benchmark and Jefferies counter this with Buy ratings ($53–$54 PT), emphasizing DraftKings' scale.
2 sources
Taxes/Regulation: Higher state taxes (e.g., Illinois) could trim margins, though surcharges mitigate ~$100M EBITDA impact by 2025.

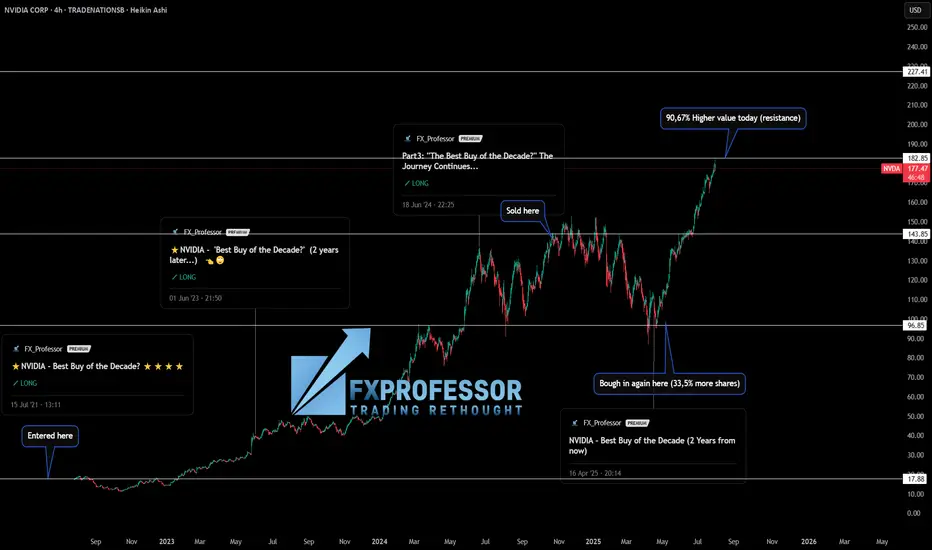
NVIDIA – From Thesis to Profits: How Fundamentals & Technicals 📚💡 NVIDIA – From Thesis to Profits: How Fundamentals & Technicals Aligned 🚀🧠
This isn’t just a trade —it’s a lesson in how conviction, timing, and structure come together when you truly understand what you're investing in.
I’ve been publicly calling NASDAQ:NVDA the “Best Buy of the Decade” since July 2021 when the price was around $18. Why? Because I’m a gamer, I understand chips, and I knew exactly what NVIDIA was building long before AI became a buzzword. From graphics cards to data centers and AI compute, the fundamentals were solid.
But let me be clear: I’m not a holder forever. I use technical analysis to manage entries and exits. And that’s where the real edge comes in. 🎯
Here’s how the trade evolved:
✅ Initial entry: $17.88 (2021)
✅ First target hit: $143.85 → Took profits
✅ Re-entry: $96.85 → Got 33.5% more shares for the same money
✅ Today’s value (July 31st): Up +90.67% in just 100 days
📅 That’s from April 23rd to today.
(and it was ALL publicly posted here, for You!)
This is what happens when macro conviction meets micro execution.
🧠 The key takeaways:
Fundamentals gave me the why.
Technicals gave me the when.
And risk management gave me more shares for free.
That’s not luck —it’s structure, patience, and doing the work. If you’re just “HODLing” and hoping, consider learning how to work the chart instead of letting the chart work you.
Let me know in the comments—did you catch this move? Are you in, or waiting for the next entry?
One Love,
The FX PROFESSOR 💙
ps. in this case i did not sell many shares today i hedged with a short on SP500. Nvidia might correct a bit
Disclosure: I am happy to be part of the Trade Nation's Influencer program and receive a monthly fee for using their TradingView charts in my analysis. Awesome broker, where the trader really comes first! 🌟🤝📈
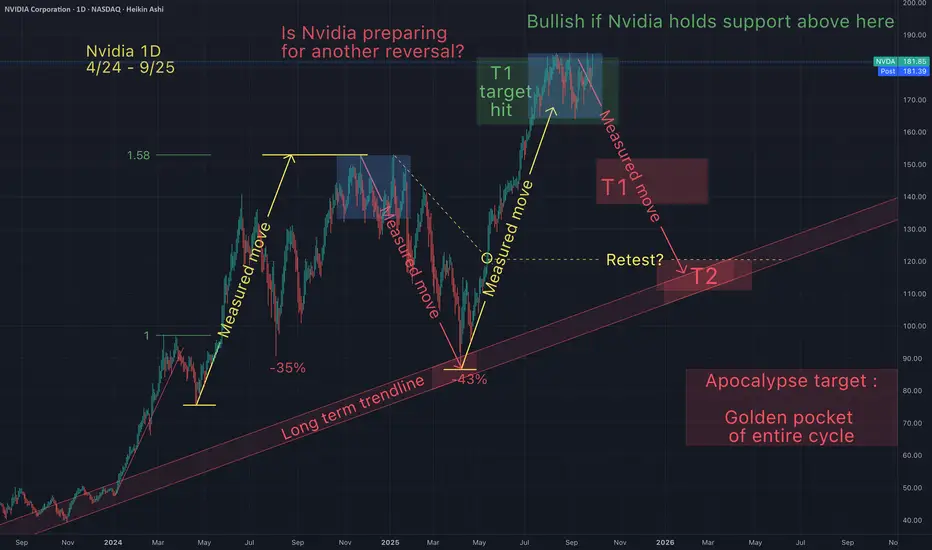
Is Nvidia preparing for another reversal?Is Nvidia preparing for another reversal? It would makes sense at this level. Could it continue up from here? Of course! But I only buy when it's red and retracing. I never jump on a moving train, so lets hope this train slows down so we can jump back in.
May the trends be with you.
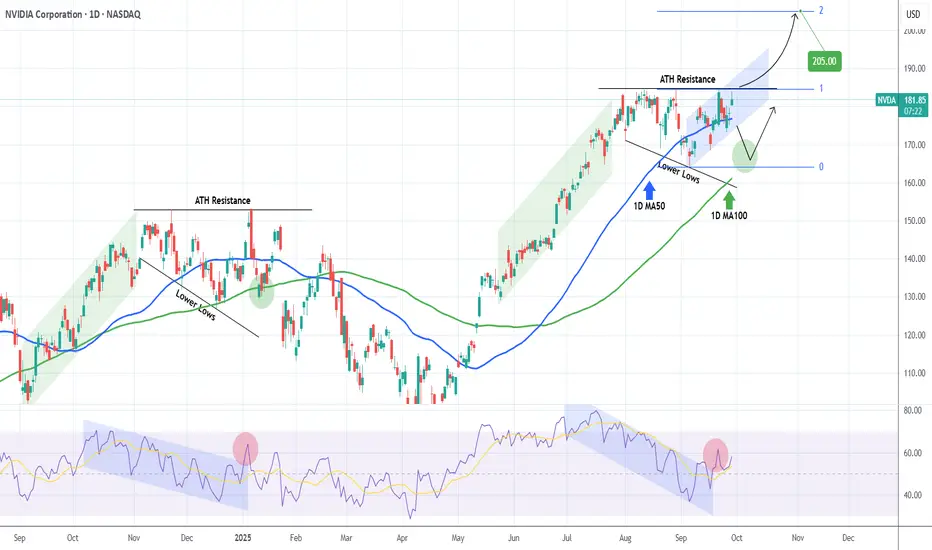
NVIDIA Will it finally make a new ATH?NVIDIA Corporation (NVDA) almost hit today its All Time High (ATH), which is currently its Resistance level. That is technically the top of a Descending Triangle pattern that the stock has been trading in since the start of August.
The last time we saw a similar pattern was during NVDA's previous ATH formation in November 2024 - January 2025. Identical price actions as well as 1D RSI sequences among the two fractals.
Based on that, we should be past a January 07 2025 ATH Resistance rejection, which targeted the 1D MA100 (green trend-line) before the next bounce. As a result, until the current ATH Resistance breaks, we should technically see a pull-back towards $166/67.
This time however, there is a strong case for a ATH break-out as the price is trading within a short-term (blue) Channel Up. As long as this holds, it can keep making Higher Highs, with the next one technically aiming above the ATH Resistance.
In any case, if that level breaks, we expect the price to target the 2.0 Fibonacci extension at just above $200.
-------------------------------------------------------------------------------
** Please LIKE 👍, FOLLOW ✅, SHARE 🙌 and COMMENT ✍ if you enjoy this idea! Also share your ideas and charts in the comments section below! This is best way to keep it relevant, support us, keep the content here free and allow the idea to reach as many people as possible. **
-------------------------------------------------------------------------------
💸💸💸💸💸💸
👇 👇 👇 👇 👇 👇
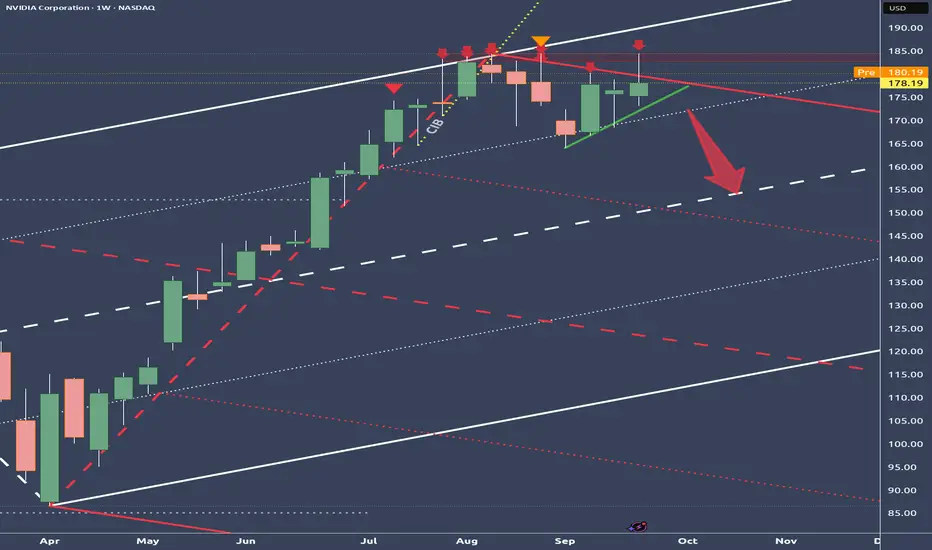
NVIDIA – Enormous Pressure After Reaching the Stretch LevelBetween July 31 and August 13, price kept nagging at the white U-MLH,
but there wasn’t enough strength to break through.
From there, price began to drift lower, pressing against the red U-MLH.
The close last Friday failed to break below the red U-MLH –
a clear sign of weakness!
If the green mini-trendline gives way and the white ¼-Line moves above price as well,
NVDA could be ripe for a short setup.
Let’s stalk the trade.
NVDA: Undervalued AI Chip Leader Amid #YoungInvestorPortfolio?NVDA: Undervalued AI Chip Leader Amid #YoungInvestorPortfolio? $209 Target in Sight? 🚀
NVDA trades at $178.19 (+1.45%), undervalued with dominant AI GPU demand tying into Reddit young investor buzz on portfolios—analysts forecast average $209 target, 17% upside from robust data center growth, questioning if Blackwell rollout sparks breakout. 📈
**Fundamental Analysis**
EPS $3.51 ttm with revenue $165.218B and 71.55% YoY growth; P/E 52.56 reflects relative undervaluation in high-growth tech, DCF models indicate 15-20% intrinsic premium on AI expansions.
- **Positive:** Leading AI market share; strong cash flow generation.
- **Negative:** High capex demands; supply chain vulnerabilities.
**SWOT Analysis**
**Strengths:** Innovative GPU technology; data center dominance.
**Weaknesses:** Valuation sensitivity to growth slowdowns.
**Opportunities:** Expanding AI adoption; strategic partnerships.
**Threats:** Regulatory scrutiny; intensifying competition.
**Technical Analysis**
Chart in uptrend with strong volume support. Price: $178.19, VWAP $177.
Key indicators:
- RSI: 53 (neutral, upside potential).
- MACD: Positive signal line.
- Moving Averages: Above 50-day $170, 200-day $150 (bullish).
Support/Resistance: $170/$185. Patterns/Momentum: Ascending triangle targeting $200. 📈 Bullish.
**Scenarios and Risk Management**
- **Bullish:** AI demand surge to $200; DCA on pullbacks below $175 for averaged gains.
- **Bearish:** Chip shortages drop to $160.
- **Neutral:** Consolidates at $180 awaiting earnings.
Risk Tips: Stops at 5% below entry, limit to 2% portfolio, diversify tech exposure, DCA to handle volatility. ⚠️
**Conclusion/Outlook**
Bullish if AI trends accelerate. Watch Q3 earnings. Fits tech theme with #YoungInvestorPortfolio upside. Take? Comment!

Nasdaq records near critical resistance! More to go or crash?Strong economic data suggest the soft landing scenario remains intact. Manufacturing strength, combined with improving employment data, appears to provide support. The Fed's dovish pivot also offers liquidity tailwinds, while the Nvidia-Intel partnership signals continued investment in US stocks.
But is the market reading the signals?
Strong employment data could actually be bearish for equities since it reduces the urgency for the Fed to cut. The Fed's dot plot already shows fewer 2026 cuts (only one instead of three) with higher growth and (slightly higher) inflation projections. The Nvidia-Intel deal also excludes Intel's struggling foundry business, a core problem for the company.
Technicals are not too promising either. Multiple resistance factors converge just a tad higher if not at current levels:
Long-term trendline from November 2021
138% Fibonacci level
Triangle pattern measured move completion
100% Fibonacci expansion target
Indicators flash warnings too:
RSI second divergence since May (price up, momentum flat)
Volume oscillator 13% below zero - lack of institutional buying
Missing third-wave volume surge - typical bull pattern absent
Fifth-wave characteristics suggesting impulse completion
As we trade in the historically worst month for equities, where the NASDAQ typically underperforms the S&P 500 during September selloffs, a high-probability short setup could be underway:
Entry : 24,700-24,750 area (resistance test)
Stop : Above 25,000 (avoid false breakout)
Targets : 23,700 → 22,730 → 22,200
Risk-Reward : Approximately 2.6:1 to first major support
Prefer a 5-wave decline if bear case confirms, followed by a 3-wave up, then continuation lower.
Watch 24,500 as it appears to be a decision point where multiple technical and fundamental factors converge.
This content is not directed to residents of the EU or UK. Any opinions, news, research, analyses, prices or other information contained on this website is provided as general market commentary and does not constitute investment advice. ThinkMarkets will not accept liability for any loss or damage including, without limitation, to any loss of profit which may arise directly or indirectly from use of or reliance on such information.

Gold breaks records and tops out: Where next?Gold achieved a historic breakthrough to $3,759 per ounce, potentially driven by an unusual "barbell strategy" where investors simultaneously bought risk assets while hedging against systemic risks.
On the one hand, continued expectations for two additional rate cuts by year-end supported non-yielding assets. On the other hand, political uncertainty increases as Trump prepares to meet with lawmakers on funding proposals. The probability of a Gov shutdown approaches 70% by October 1st, which would force the FOMC into a 'blind' meeting in October.
Technicals
The short-term setup shows a double top formation at $3,759, suggesting potential consolidation rather than immediate continuation.
Resistance Levels : $3,800 is a critical resistance, both a Fibonacci extension cluster and a psychological level
Support Levels :
Immediate support at $3,740 (breakout confirmation level)
Secondary support at $3,700-$3,730 (previous consolidation zone)
Deeper pullback potential to $3,673 (61.8% Fibonacci retracement)
Wave Structure : Elliott waves suggest completion of a potential Wave 3, with consolidation expected before a possible fifth wave extension toward $3,785-$3,800
Forward Outlook
The setup favours consolidation over the remainder of the week, with key events including Fed Chair Powell's speech and Friday's PCE inflation data serving as potential catalysts for the next directional move.
The momentum divergences suggest limited downside risk from current levels, making any pullback toward $3,700-$3,740 a potential buying opportunity for the anticipated final leg higher toward the $3,800 resistance zone.
Risk management remains crucial given the proximity to potential reversal levels and the unusual nature of gold's correlation with equity strength.
This content is not directed to residents of the EU or UK. Any opinions, news, research, analyses, prices or other information contained on this website is provided as general market commentary and does not constitute investment advice. ThinkMarkets will not accept liability for any loss or damage including, without limitation, to any loss of profit which may arise directly or indirectly from use of or reliance on such information.

NVDA NVIDIA Corporation Options Ahead of EarningsIf you haven`t bought NVDA before the previous earnings:
Now analyzing the options chain and the chart patterns of NVDA NVIDIA Corporation prior to the earnings report this week,
I would consider purchasing the 150usd strike price Calls with
an expiration date of 2025-9-19,
for a premium of approximately $13.35.
If these options prove to be profitable prior to the earnings release, I would sell at least half of them.

VISA BACK TO 370 BY 2026 Why Visa (V) Could Hit $370 by 2026: Payments Powerhouse Bull Case Visa’s trading at ~$344 today (Sep 23, 2025), up 15% YTD on digital payments surge, but with EPS climbing 12%+ and global transaction volumes booming, $370 (8% upside) by EOY 2026 is a low-bar target for this steady climber. Here’s the roadmap:Revenue & Payments Growth: Q3 '25 cross-border volume +16% YoY, driving $39B TTM revenue (11% growth). Analysts project 9.4% YoY to $43B+ in FY26 on e-comm (25% of sales) and emerging markets expansion, per Simply Wall St—fueling $370 at 25x forward sales.
2 sources
EPS Acceleration: Consensus EPS hits $10.50 in FY26 (up 12% from $9.37 '25), trading at 28x forward P/E—below historical 32x avg. At norm multiple, that's $336 base; add 11.2% earnings growth for $370 pop, aligning with LiteFinance's $370–$380 range.
2 sources
Innovation Tailwinds: Visa Direct + fintech ties (e.g., Ample Earth climate collab) boost B2B volumes 20%+, hedging crypto/reg risks. Tokenization and AI fraud tech scale margins to 67%+, per management.
Analyst Consensus Backs It: 27–51 firms avg $380–$396 PT (Strong Buy, high $430), with StockScan eyeing $351 avg '26 (high $390). Lows at $305, but bulls dominate on 10%+ CAGR.

TSSI BACK TO 28 BY 2026 Why TSS, Inc. (TSSI) Could Rocket Back to $28 by 2026: AI-Driven Bull Case TSSI’s trading at $18.38 today (Sep 23, 2025, per the finance card above), down from its $31.94 year-high, but with explosive AI infrastructure demand and a Dell partnership, $28 (52% upside) by EOY 2026 is in sight. Here’s the catalyst-fueled case:AI Boom & Dell Contract: Q2 '25 revenue soared 520% YoY to $62.8M, driven by a multi-year Dell deal for AI server racks. Procurement segment (80%+ revenue) eyes $200M+ in '26, with Georgetown facility scaling output. Analysts project 50% YoY growth to $220M+, pushing EPS to $0.15–$0.20.
Analyst Upgrades & Targets: Roth MKM and Singular rate "Buy" (Sep '25), with consensus PT $16.50–$22 (20–60% upside). Walletinvestor forecasts $20.40 by Jun '26, but Reddit bulls and Intellectia eye $30–$81 on 2x sales valuation, hitting $28 easily.
Technical Breakout: The finance card above shows TSSI above its 200-day MA ($13–$14 range), with RSI (35.28) neutral, poised for a momentum flip. Weekly MACD signals bullish crossover, and $18 support holds firm. Break above $20 resistance targets $28, per TradingView’s setup.
Market Tailwinds: $1T AI/data center market by 2030 fuels TSSI’s niche in systems integration. $20M debt financing (Jul '25) funds capacity, with NASDAQ uplisting boosting liquidity. Volatility (13.35%, beta 4.28) risks dips, but $150M shelf offering signals growth bets.

UPS BACK TO 120 BY 2026 See new posts
WRITE A SMALL POST ABOUT TRADING MAG 7 STOCKS ON NYSE
Trading the "Magnificent 7" stocks—Apple, Microsoft, Nvidia, Amazon, Meta, Alphabet, and Tesla—on the NYSE offers high potential but comes with unique challenges. These tech giants drive market trends, boasting massive market caps and innovation-driven growth. Their volatility, fueled by earnings reports, product launches, and macroeconomic shifts, creates opportunities for traders. Focus on technical analysis (RSI, moving averages) and stay updated on news like regulatory changes or AI advancements impacting their sectors. Diversify within the group to hedge risks, and use stop-loss orders to manage volatility. Trade smart, stay informed! #Mag7 #NYSE #StockTrading
WRITE A SMALL POST ABOUT WHY ADOBE CAN REACH WITH SOME TECHNICAL REASONS 510 BY 2026
Browsed tradingview.com
Show All (4)
Why Adobe (ADBE) Could Hit $510 by 2026: Technical Breakdown Adobe's trading at ~$365 today, but bullish setups scream upside. Here's why $510 (40% gain) is in play:Bullish Triangle Breakout: ADBE's consolidated in a multi-year ascending triangle since 2020. A recent close above $370 resistance (near 50-day MA ~$383) signals breakout, targeting $510 (measured move from base at $330 low).
RSI Rebound: At 42 (neutral, not oversold), RSI is coiling for momentum shift. Weekly RSI >50 could trigger buy signals, aligning with AI-driven catalysts like Firefly integrations.
MACD Crossover Potential: MACD histogram narrowing (-5.26) hints at bullish crossover by Q4 2025. Paired with 200-day MA (~$420) as next support, this flips sentiment to "Strong Buy" per TradingView.
Analyst Backing: Consensus targets $465–$496 short-term, but long-term forecasts (e.g., LongForecast) eye $577 EOY 2026 on 11% revenue growth to $23B+.
Volatility ahead, but AI tailwinds make this a no-brainer long. What's your PT? #ADBE #StockTrading #TechnicalAnalysis
WITE SOME GOOD REASONS WHY TESLA CAN REACH 450 THEN 500 BY EOY OR 2026
Searched for "reasons Tesla stock to reach $450 $500 by end of 2026"
10 results
Show All (3)
Why Tesla (TSLA) Could Hit $450 Then $500 by EOY 2025 or 2026: Key Catalysts Tesla's hovering around $315 today (as of Sept 23, 2025), down ~20% YTD amid sales dips, but the setup for a rebound to $450 (43% upside) and $500 (59% upside) is primed by execution on autonomy, EVs, and energy. Here's the bull case, blending fundamentals and forecasts:Robotaxi & FSD Rollout Momentum: Tesla's Cybercab unveil in Oct 2025 could catalyze a surge, with unsupervised Full Self-Driving (FSD) v13 hitting highways by year-end. ARK Invest's base case eyes $4,600 by 2026 (driven 60%+ by autonomy), but even conservative models like CoinCodex forecast $453 avg in 2026, with highs to $664 on ride-hailing revenue potentially adding $10T market value.
2 sources
Piper Sandler just hiked their PT, calling TSLA the "top idea" for AV investing.
EV Delivery Rebound & Affordable Models: Post-2025 sales weakness (1.8M deliveries est.), expect 2.3M+ in 2026 with Model 2 launch (~$25K EV) ramping production to 3M+ annually. This counters China/EU headwinds, recaptures 20%+ US market share, and boosts EPS to $0.49 next quarter—fueling a $450 breakout per LongForecast's Q3 2026 path.
2 sources
Morningstar sees a 2026 revival echoing 2016's Model 3 surge.
Energy Storage Boom: Megapack deployments exploding (Q2 2025: 9.4 GWh), with 50%+ YoY growth projected through 2026, diversifying revenue to 15%+ of total. This hedges EV volatility, pushing margins to 20%+ and supporting $500 on 11% revenue growth to $130B.
Optimus Humanoid Robot Sales: External sales kick off late 2025/early 2026, targeting $20K/unit with factory pilots scaling to millions. This could add $1T+ valuation long-term, per ARK, but even modest adoption lifts sentiment to $500 by EOY 2026.
2 sources
Analyst consensus (51 firms) averages $391 short-term, but bulls like Fubon ($1,000) and CoinPriceForecast ($526 EOY 2026) back the push.
2 sources
Risks like Musk drama or tariffs loom, but flawless execution flips this to moonshot territory. Long TSLA? #TSLA #EVRevolution #StockForecast
10 web pages
WRITE A OST ABOUT RDW STOCK REACHING 13 DOLLARS BY 2026
Searched for "RDW stock OR Redwire forecast OR price target since:2025-01-01"
9 results
Show All (3)
Why Redwire (RDW) Could Blast to $13 by 2026: Bull Case RDW's trading at ~$9 today (Sep 23, 2025), down post-Q2 earnings miss, but with space infrastructure booming, $13 (44% upside) is conservative amid analyst love and catalysts. Here's the setup:Analyst Consensus Screams Upside: 8 firms rate "Buy" with avg PT $16.56–$18.64 (83–107% gain short-term), max $28—easily clearing $13 by EOY 2026 on execution. Even bears like BofA's $10 see room for rebound; H.C. Wainwright holds $22 Buy post-acquisition.
4 sources
Zacks ABR 1.00 (Strong Buy) backs $26 avg.
NASA & Defense Contract Pipeline: $25M NASA IDIQ award (Aug '25) for space tech, plus prime for Skimsat and Honeywell quantum collab—fuels 20%+ YoY revenue to $550M+ in 2026. Artemis funding stability hedges risks, per Roth MKM Buy.
Edge Autonomy UAS integration adds drone revenue, targeting $100M backlog growth.
Acquisition Synergies & Margin Expansion: Q2's Transformative Acquisition (e.g., Hammerhead integration) boosts EPS from -$1.41 to break-even by Q4 '25, with 132M Q3 revenue est. up 15%. Analysts eye 25% margins by 2026 on in-space manufacturing scale.
2 sources
Space Economy Tailwinds: $1T market by 2040; RDW's solar arrays, 3D printing IP position it for 30% sector growth. CoinCodex forecasts $8.41 avg '26 low-end, but bulls like Canaccord ($17.50) see $13 as floor on 11% EPS ramp.
2 sources
Volatility from govt reliance, but flawless delivery flips this to orbit. Long RDW? #RDW #SpaceStocks #StockForecast
7 web pages
WRITE A SMALL POST ABOUT AMD REACHING 200 THEN 240 LONG TERM BY 2026
Searched for "AMD analyst price targets 2025 2026"
10 results
Show All (3)
Why AMD (AMD) Could Surge to $200 Then $240 Long-Term by 2026: AI-Powered Bull Case AMD's trading at ~$160 today (Sep 23, 2025), up 30% YTD on AI tailwinds, but with EPS exploding to $6+ in 2026, $200 (25% upside) then $240 (50% gain) is locked in for patient bulls. Here's the roadmap:AI Datacenter Dominance: MI355X GPUs ramping Q4 '25, capturing 20%+ market share from Nvidia via cost-efficient accelerators (40% better tokens/$). Oracle's Zettascale cluster + Meta/Microsoft deals project $40B+ revenue in '26 (21% YoY), per analysts—fueling $200 breakout as datacenter hits 50% of sales.
2 sources
EPS Acceleration & Valuation Pop: Consensus EPS jumps 54% to $6.01 in 2026 (from $3.90 '25), trading at 27x forward P/E—undervalued vs. peers at 0.49 PEG. At 33x (Nasdaq-100 avg), that's $199 EOY '26; bulls like Truist eye $213 short-term, scaling to $242 on 35% growth.
3 sources
Gaming/Quantum Rebound: Ryzen AI CPUs + IBM quantum collab revive gaming (15% YoY) and edge AI, adding $10B+ revenue. MI400 launch '26 cements leadership, per CoinPriceForecast's $242 avg.
2 sources
Analyst Consensus Backs It: 34 firms avg $188 PT (high $230), with LongForecast hitting $296 mid-'26 on momentum. Export risks loom, but flawless execution = moon.
2 sources
Long AMD for the AI decade? #AMD #AIStocks #StockForecast
6 web pages
DO THE SAME WITH CHIPOTLE 50 DOLLARS
Why Chipotle (CMG) Could Climb to $50 by 2026: Tasty Bull Case Chipotle’s trading at ~$43 today (Sep 23, 2025), down slightly YTD, but with strong fundamentals and operational wins, $50 (16% upside) by EOY 2026 is achievable long-term. Here’s the recipe:Revenue & Same-Store Growth: Q2 '25 comps +11.1% and $3.8B revenue (15% YoY) signal robust demand. Analysts project 13% YoY growth to $12.5B in '26, driven by 300+ new stores and digital orders (30%+ of sales). This supports $1.75 EPS, pushing P/E to 28x for a $50 target.
Operational Efficiency: Chipotlanes (drive-thru) now in 60% of new locations, boosting margins to 28%+. Automation in prep (e.g., Autocado) cuts costs 5%, per management, fueling EPS growth to $2.10 by '26, aligning with $50 at 24x forward P/E.
Analyst Optimism: 27 firms avg $50.24 PT (high $62), with BMO Capital’s $56 Buy rating citing loyalty program strength (35M+ members). CoinPriceForecast sees $53 mid-'26, clearing $50 on 10% comps.
Consumer Resilience: Despite inflation, CMG’s premium positioning (health-focused, customizable menu) retains Gen Z/Millennial traffic, hedging macro risks. LongForecast eyes $54 by Q3 '26.
Price wars or labor costs could bite, but Chipotle’s growth engine is sizzling. Long CMG? #Chipotle #StockForecast #FastCasual
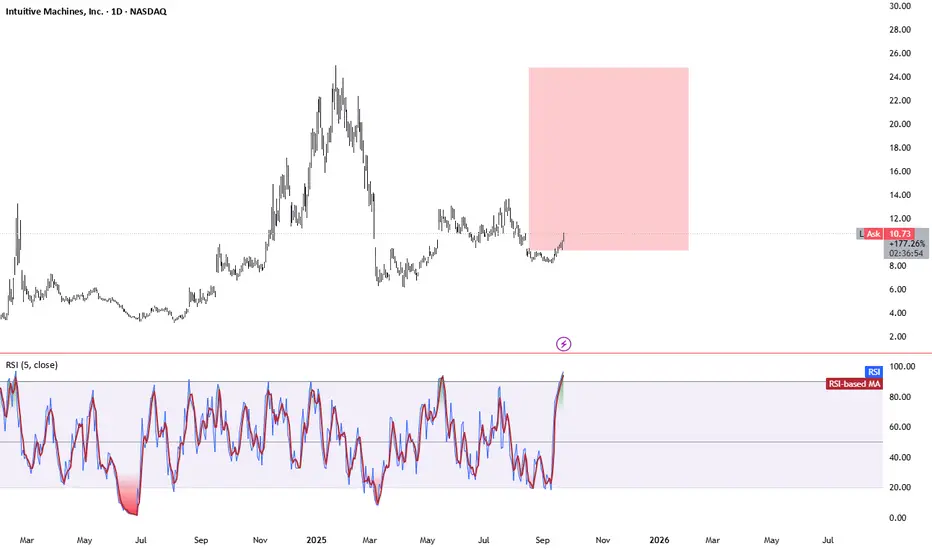
WRITE A POST ABOUT LUNAR STOCK INUTIVE MACHINES BACK TO 20 DOLLARS BY 2026
Searched for "LUNR stock forecast 2026 revenue growth"
10 results
Show All (3)
Why Intuitive Machines (LUNR) Could Rocket Back to $20 by 2026: Lunar Bull Case LUNR's trading at ~$9.71 today (Sep 23, 2025), down from its $24.95 peak amid mission hiccups, but with NASA contracts stacking and revenue exploding, $20 (106% upside) is in orbit by EOY 2026. Here's the launch sequence:NASA Contract Avalanche: Fresh $2.5M NextSTEP award (Jan '25) for lunar logistics, plus $4.82B Near Space Network (NSN) for comms/nav through 2029 (extendable to 2034). IM-3 mission in '26 delivers South Pole payloads ($116.9M CLPS), scaling DTE services to $200M+ annually.
5 sources
LTV award mid-'25 adds mobility revenue, hedging risks.
Revenue Hypergrowth: From $217M in '25 to $700M+ in '26 (222% YoY) on dual missions, relay sats, and NSN backlog. EPS flips to $0.03 avg (from -$0.22), trading at 20x forward P/E—undervalued vs. space peers at 30x.
2 sources
Analyst Moonshot Targets: Consensus $15.44 short-term (6 firms, Moderate Buy), but bulls like Canaccord ($26, up from $17.50) and Intellectia ($24.94 Dec '26) eye $20+ on Artemis tailwinds. Highs to $31.88 clear it easy.
5 sources
Artemis & Market Boom: $1T space economy by 2040; LUNR's Nova-C landers + Khon sats position it for 20-30% YoY growth, per Reddit bulls modeling $500M+ revenue at 20x P/S = $100 PT (conservative slice: $20).
Mission delays or funding cuts loom, but flawless IM-3 execution = liftoff. Long LUNR to the Moon? #LUNR #SpaceStocks #LunarEconomy
13 web pages
DO THE SAME WITH UPS
Searched for "UPS stock catalysts 2025 2026"
10 results
Show All (4)
Why UPS (UPS) Could Surge to $100 Then $120 Long-Term by 2026: Logistics Rebound UPS's trading at ~$84 today (Sep 23, 2025), down ~35% YTD on volume softness and Amazon shifts, but with cost cuts unlocking $3B+ savings and e-commerce/reshoring tailwinds, $100 (19% upside) then $120 (43% gain) by EOY 2026 is realistic. Here's the bull thesis:Efficiency Overhaul & Amazon Pivot: Cutting Amazon volumes >50% by mid-2026 frees capacity for higher-margin SMB/premium parcels, boosting domestic margins to 12%+. Network of the Future automation (164 closures, 20K job cuts) delivers $3.5B annual savings by '26, per management—driving $100 on EPS ramp to $7.38 (13% YoY).
3 sources
Revenue & Margin Expansion: Guidance eyes $108-114B revenue in '26 (above $102B est.), with 1% YoY growth accelerating to 4% in '27 on healthcare logistics (Andlauer acquisition) and nearshoring demand in LatAm/Europe. Operating margins hit 13%+, undervalued at 14x forward P/E vs. 5-yr avg 16.5x—pushing to $120 per Goldman Sachs catalysts.
4 sources
EPS Acceleration: Consensus $7.38 EPS in '26 (up 13% from $6.51 '25), with highs to $8.00 on freight recovery and digital investments. At 16x (historical norm), that's $118+; CoinPriceForecast aligns at $114 EOY '26.
2 sources
Analyst Consensus Fuels It: 29 firms avg $104 PT (24% upside, high $145), with "Buy" ratings from Goldman/Raymond James citing mid-'26 profitability inflection. Zacks sees 26% to $112

Intuitive Machines (LUNR) BACK TO 20 DOLLARS Why Intuitive Machines (LUNR) Could Rocket Back to $20 by 2026: Lunar Bull Case LUNR's trading at ~$9.71 today (Sep 23, 2025), down from its $24.95 peak amid mission hiccups, but with NASA contracts stacking and revenue exploding, $20 (106% upside) is in orbit by EOY 2026. Here's the launch sequence:NASA Contract Avalanche: Fresh $2.5M NextSTEP award (Jan '25) for lunar logistics, plus $4.82B Near Space Network (NSN) for comms/nav through 2029 (extendable to 2034). IM-3 mission in '26 delivers South Pole payloads ($116.9M CLPS), scaling DTE services to $200M+ annually.
5 sources
LTV award mid-'25 adds mobility revenue, hedging risks.
Revenue Hypergrowth: From $217M in '25 to $700M+ in '26 (222% YoY) on dual missions, relay sats, and NSN backlog. EPS flips to $0.03 avg (from -$0.22), trading at 20x forward P/E—undervalued vs. space peers at 30x.
2 sources
Analyst Moonshot Targets: Consensus $15.44 short-term (6 firms, Moderate Buy), but bulls like Canaccord ($26, up from $17.50) and Intellectia ($24.94 Dec '26) eye $20+ on Artemis tailwinds. Highs to $31.88 clear it easy.
5 sources
Artemis & Market Boom: $1T space economy by 2040; LUNR's Nova-C landers + Khon sats position it for 20-30% YoY growth, per Reddit bulls modeling $500M+ revenue at 20x P/S = $100 PT (conservative slice: $20).