Nvidia - The -25% correction starts now!✂️Nvidia ( NASDAQ:NVDA ) is about to create a correction:
🔎Analysis summary:
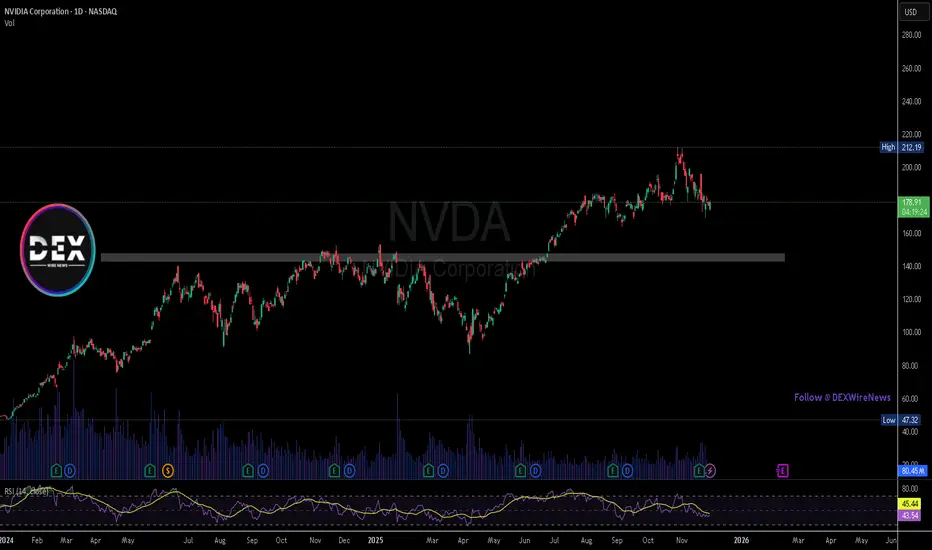
After Nvidia retested major support in mid 2025, we saw another rally of about +125%. But now, Nvidia is rejecting a major resistance trendline and is about to create bearish confirmation. Quite likely that Nvidia will create a major -25% correction in the future.
📝Levels to watch:
$140
SwingTraderPhil
SwingTrading.Simplified. | Investing.Simplified. | #LONGTERMVISION
Nvidiaanalysis

Nvidia - This is all still expected!🥊Nvidia ( NASDAQ:NVDA ) is heading for another -20%:
🔎Analysis summary:
Just last month, Nvidia created a massive bearish engulfing candle. This clearly shows that buyers are not willing to accept higher prices. Together with the retest of the major resistance trendline, Nvidia is heading lower. The next support will come at about -20%.
📝Levels to watch:
$150
SwingTraderPhil
SwingTrading.Simplified. | Investing.Simplified. | #LONGTERMVISION

Nvidia: New Low ExpectedNvidia should soon develop further downward momentum to carve out the low of the beige wave IV. Nevertheless, price should pivot upward before dropping below the support at $145.50 and rise into our red Target Zone between $227.38 and $260.60. This is where the waves V in beige, (V) in blue, and in lime green are expected to find their common peak, followed by a new, significant correction phase. Consequently, we consider the red zone a suitable range to enter on the short side, with a stop set 1% above the zone's upper edge to aid in risk management. We also consider a 33% probability that the lime green wave alt. already completed at $212.16. This alternative scenario would be confirmed by direct sell-offs below the $145.50 support.

Nvidia - The correction just started!💉Nvidia ( NASDAQ:NVDA ) is now heading lower:
🔎Analysis summary:
Just recently, Nvidia once again retested the major rising channel resistance trendline. Together with November's bearish engulfing candle, Nvidia is slowly shifting bearish. And before Nvidia will retest the next major support area, we can see a drop of another -15%.
📝Levels to watch:
$150
SwingTraderPhil
SwingTrading.Simplified. | Investing.Simplified. | #LONGTERMVISION

Nvidia - Now is the time to go short!💣Nvidia ( NASDAQ:NVDA ) is now creating a top:
🔎Analysis summary:
Just a couple of days ago, Nvidia perfectly retested a major resistance trendline. Always in the past, such a retest was followed by a major move towards the downside. Therefore, Nvidia is preparing for a major drop, which could lead to another -25% drop in the future.
📝Levels to watch:
$180 and $140 and $100
SwingTraderPhil
SwingTrading.Simplified. | Investing.Simplified. | #LONGTERMVISION

Nvidia ($NVDA) Stock: $2B Synopsys Deal Expands AI Design PowerNvidia has taken another major step to secure its dominance in AI infrastructure by investing $2 billion in Synopsys, one of the world’s leading chip design software companies. The investment instantly makes Nvidia one of the top shareholders and deepens the long-term collaboration between the two firms. The deal strengthens Nvidia’s control over key parts of the AI value chain, from hardware to software tools used in designing new chips across multiple industries.
This partnership gives Synopsys access to Nvidia’s advanced developer tools and GPU-accelerated libraries to boost its electronic design automation (EDA) processes. These improvements aim to speed up chip development cycles at a time when demand for advanced AI hardware continues to surge. For Nvidia, the move ensures it stays positioned at the center of AI innovation and benefits financially from the growth of the entire ecosystem—not just from selling GPUs.
The timing also matters. Synopsys recently reported weakness in its intellectual property segment due to export restrictions tied to China and slower activity from a major foundry customer. Nvidia’s investment restores confidence in Synopsys' long-term outlook while offering Nvidia a strategic foothold in the tools that design the chips running global AI infrastructure.
Technical Analysis
Nvidia’s overall trend remains bullish despite a slight pullback. Price currently trades around $178, holding above a key support zone at $145, which becomes the level to watch if broader tech stocks weaken. Upside momentum resumes if price pushes toward the $212 resistance area—its previous major high. A confirmed breakout above $212 would signal continuation of the broader bullish structure.
With a strong fundamental catalyst and firm long-term trend, Nvidia remains one of the leading names powering AI’s next wave.
Can NVDA Hold the Pullback Zone and Extend the Uptrend?🔥 NVDA Bullish Pullback Playbook – Thief-Style Swing Setup 🚀🕵️♂️
Hey traders & my fellow Thief OG’s 😎🕶️ — here’s a clean, polished, TradingView-friendly version of my NVDA Swing Trade Playbook with a professional + funny touch. Let’s get to the setup 👇🔥
📌 Asset
NVDA – NVIDIA Corporation (NASDAQ)
Swing Trade | Momentum | Trend-Following Setup
📈 Plan: Bullish Pullback Strategy (Pending Orders Active)
The trend is strong, the buyers are steady, and NVDA is still delivering clean higher-lows. We're waiting for either a breakout continuation or a discounted pullback entry. 📊⚡
🎯 Entry Zones
1️⃣ Breakout Entry – Momentum Thief Mode 🥷⚡
Enter after clearing the nearest resistance at $191.00
• Clean breakout
• Volume confirmation
• Trend continuation strength
2️⃣ Pullback Entry – SuperTrend ATR Sniper Entry 🎯📉
Watch for a discounted pullback near $170.00 around the SuperTrend ATR zone.
• Trend support retest
• Lower-risk entry
• Ideal for swing traders who wait for “patience-pays entries” 😎
🛡️ Stop-Loss (Thief Style – Risk First)
Breakout Entry SL → $180.00
SuperTrend Pullback SL → $160.00
Note: Dear Ladies & Gentlemen (Thief OG’s) ❤️
I’m NOT recommending you use only my SL. Choose your own levels — you make the money, you protect the money. Trade at your own risk 🔐⚠️
🎯 Target (Take-Profit Zone)
Our target → $210.00
Why?
• Strong resistance zone
• Overbought region historically
• Buyer trap zone where police force 🚔👮♂️ usually waits — so escape with profits early 😂💨
Note: Dear Ladies & Gentlemen (Thief OG’s) 🙌
I’m NOT recommending you set my TP only. Choose your own TP — your money, your exit. Trade with responsibility 💼💰
🔍 Related Pairs to Watch (Correlation Insights + Key Notes)
NASDAQ:AMD
• High positive correlation with NVDA
• When AMD shows volume expansion, NVDA often follows
• Good for momentum confirmation 🔥
NASDAQ:SOXX (iShares Semiconductor ETF)
• NVDA is a major weighted component
• ETF direction confirms big-money flow 🧠💸
• Great for spotting sector-wide risk-on / risk-off shifts
NASDAQ:QQQ (NASDAQ 100 ETF)
• NVDA is one of the heaviest weights
• If QQQ trends strongly → NVDA often mirrors
• Macro sentiment index for tech strength 📊⚡
NASDAQ:SMH (VanEck Semiconductor ETF)
• Clean supply/demand signals
• NVDA mirrors SMH breakouts frequently
• Helps confirm breakout validity before taking the trade
All these help you avoid fakeouts and align with overall semiconductor market strength.
✨ “If you find value in my analysis, a 👍 and 🚀 boost is much appreciated — it helps me share more setups with the community!”
⚠️ This is a thief-style trading strategy created just for fun. Trade responsibly.
Nvidia Erases Post-Earnings RallyShortly after publishing its earnings, shares of tech giant Nvidia jumped more than 5% at the start of the session; however, a new bearish sentiment quickly took hold of the market, and the stock fell over 7% in the final trading hours, wiping out the gains seen after the results. The company reported strong figures, with revenue of $57 billion, above the expected $54 billion, and projected fourth-quarter sales near $65 billion.
Despite the positive numbers, selling pressure began weighing on the price, mainly because the optimism was likely already priced in, prompting short-term profit-taking. In addition, growing concerns about emerging competition have fueled ongoing weakness in the stock. If market confidence fails to recover soon, selling pressure could intensify in the coming sessions.
Uptrend Losing Momentum
Since November 11, indecisive price action has led to a break of the long-standing upward trendline that had been guiding the stock’s movement. This uncertainty has created a short-term sideways range, with a ceiling at $196 and a floor at $179 per share. As long as these levels hold, a neutral and sideways phase is likely to dominate, indicating lack of clear direction in the short term.
RSI
The RSI remains slightly below the neutral 50 level, suggesting that selling momentum slightly outweighs buying pressure, though not strongly enough to establish a consistent short-term trend. As long as the RSI stays near 50, neutrality in price movement is likely to persist.
TRIX
The TRIX indicator shows a downward slope, moving closer to the zero line, indicating a balance in the strength of the exponential moving averages. This reinforces the indecision in the stock’s short-term behavior.
Key Levels to Watch:
$196 – Main Resistance: Corresponds to the most recent upward retracement zone. A break above this level could revive the bullish bias and reactivate the long-term uptrend.
$188 – Nearby Barrier: Area aligned with the 50-period simple moving average. Price moves near this level could support the formation of a more defined sideways range.
$179 – Key Support: Represents the lowest area from the past two months and serves as the most critical bearish barrier. A drop below this level could trigger a stronger selling bias and mark the start of a short-term downtrend.
Written by Julian Pineda, CFA, CMT – Market Analyst

Breaking: Nvidia ($NVDA) Crush Q3 Earnings Nvidia ( NASDAQ:NVDA ) stock saw a noteworthy uptick of 5% in early Thursday premarket trading albeit market turmoil. The asset reported earnings yesterday after market close sparking bullish sentiment.
The asset is approaching the $200 resistant as the RSI is at 47 giving room for massive upside.
The Shares of Nvidia popped in premarket trade after the U.S. firm beat expectations in third-quarter results after the closing bell on Wednesday.
Shares were last trading 5.5% higher at 4:15 a.m. ET.
Nvidia topped forecasts for revenue, which jumped 62% to $57.01 billion year-on-year, and issued stronger-than-expected fourth-quarter sales guidance.
“There’s been a lot of talk about an AI bubble,” Nvidia CEO Jensen Huang told investors on an earnings call, as the firm set out its view of the industry. “From our vantage point, we see something very different.”
Financial Performance
In 2024, NVIDIA's revenue was $130.50 billion, an increase of 114.20% compared to the previous year's $60.92 billion. Earnings were $72.88 billion, an increase of 144.89%.
Financial Performance
In 2024, NVIDIA's revenue was $130.50 billion, an increase of 114.20% compared to the previous year's $60.92 billion. Earnings were $72.88 billion, an increase of 144.89%.
About NVDA
NVIDIA Corporation, a computing infrastructure company, provides graphics and compute and networking solutions in the United States, Singapore, Taiwan, China, Hong Kong, and internationally. The Compute & Networking segment includes its Data Centre accelerated computing platforms and artificial intelligence solutions and software; networking; automotive platforms and autonomous and electric vehicle solutions; Jetson for robotics and other embedded platforms; and DGX Cloud computing services.

Nvidia - Squeezing every single bear!🧯NVidia ( NASDAQ:NVDA ) is finally breaking out:
🔎Analysis summary:
Over the course of the past couple of months, Nvidia has been rallying +125%. Considering the market cap of Nvidia, this is already an insane move but clearly not the end. We can still see another +25% from here, before Nvidia will then retest the next resistance.
📝Levels to watch:
$250
SwingTraderPhil
SwingTrading.Simplified. | Investing.Simplified. | #LONGTERMVISION

Nvidia: Acceleration Toward New Highs Nvidia gained strong upward momentum shortly after our last update, surging past the $196.45 mark, which had previously served as resistance. As a result, our prior short-term alternative scenario was triggered, and we have now adjusted the chart accordingly (with minor modifications). We now view the green wave as complete and believe that the joint top of green wave and beige wave III, as well as the low of wave IV, have already been established. The Target Zone we had initially set for the wave- low has therefore been removed. In our updated short-term alternative scenario, we still see a 30% probability of a new low for beige wave alt.IV below the $176.21 support level. In this case, however, price would likely rebound above the lower $145.50 level.

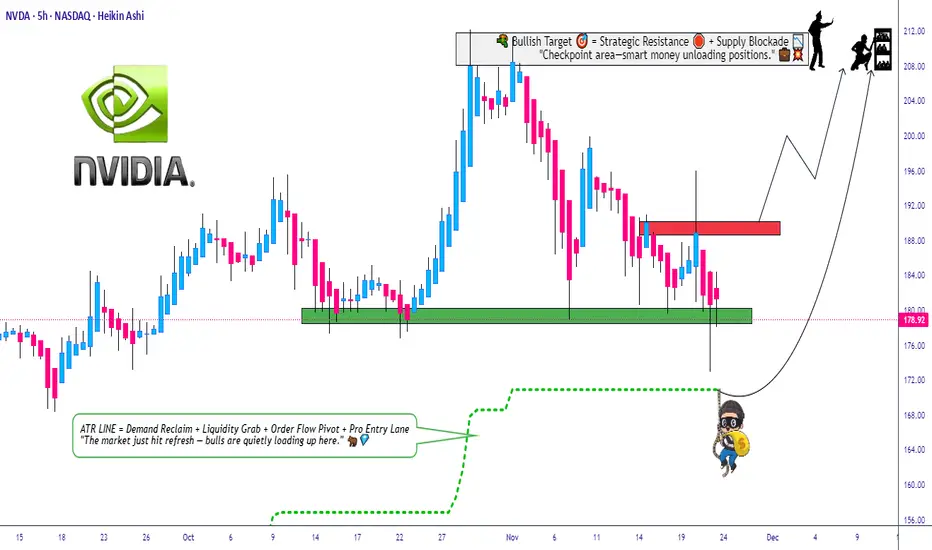
NVDA Setup Explained: Layered Entry + Clear SL/TP Levels😎 NVDA Thief’s Wealth Heist: Swing/Day Trade Blueprint 🚀
Asset: NVIDIA Corporation (NVDA) 📈Vibe: Bullish, sneaky, and ready to snatch profits with style! 💰
Welcome, ladies and gentlemen, to the Thief’s OG Wealth Strategy Map for NVDA!
This is a fun swing/day trading plan designed to grab liquidity like a master thief. Let’s break down this bullish setup with a double bottom pullback, layered entries, and a cheeky escape plan. Ready to outsmart the market? 🕵️♂️
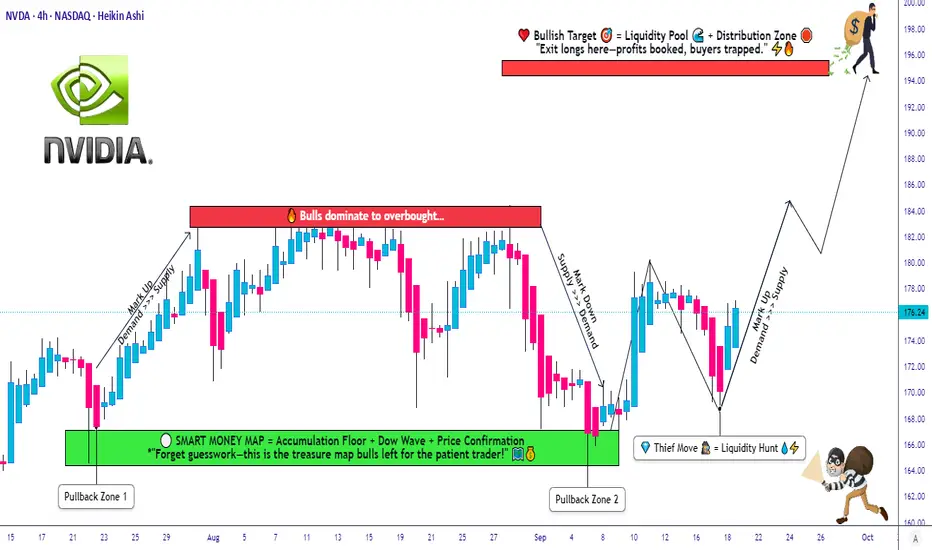
📊 Market Analysis: Why NVDA?
NVDA is riding a bullish wave 🌊, confirmed by a double bottom pullback pattern and a sneaky liquidity grab at key support levels. The stock’s momentum is screaming “UP!” as buyers step in to defend the price. This setup is perfect for swing or day traders looking to capitalize on NVIDIA’s tech-fueled surge. 💻
🗺️ The Thief’s Plan: Bullish Heist Strategy
🎯 Entry Strategy:Deploy the Thief’s Layering Tactic with multiple buy limit orders to maximize your entry precision.
Suggested price levels:
$172.00
$174.00
$176.00
$178.00
Pro Tip: Feel free to add more layers based on your risk appetite and market conditions. The more, the merrier! 🧑💼
🛑 Stop Loss (SL):Set a Thief’s SL at $168.00 to protect your loot.
Note: Dear Thief OGs, this SL is my suggestion, but you’re the boss of your trades! Adjust based on your risk tolerance and let the profits roll. 💸
🎉 Take Profit (TP):Aim for the juicy $195.00 target, where we expect strong resistance, potential overbought conditions, and a possible trap for the unprepared. Lock in those hard-earned gains and escape like a pro! 🏃♂️
Note: This TP is my call, but you do you! Take profits at your own pace and keep the cash flowin’. 😎
🔗 Related Pairs to Watch (in USD)
To boost your market awareness, keep an eye on these correlated assets:
NASDAQ:AMD (Advanced Micro Devices): NVDA’s chipmaking cousin often moves in tandem. A bullish NVDA could signal strength in AMD. 📡
NASDAQ:SMH (VanEck Semiconductor ETF): This ETF tracks the semiconductor sector, including NVDA. Watch for sector-wide momentum. 📊
NASDAQ:QQQ (Invesco QQQ Trust): NVDA’s a heavy hitter in this tech-heavy ETF. QQQ’s trend can confirm NVDA’s direction. 🚀
Key Correlation Point: NVDA’s performance is tied to the broader semiconductor and tech sector. If AMD or SMH shows bullish patterns, it reinforces NVDA’s upside potential. Conversely, weakness in QQQ could signal caution. Stay sharp, thieves! 🕵️
🛠️ Why This Setup Rocks
Double Bottom Pullback: A textbook bullish reversal pattern, signaling strong buying interest. 📉➡️📈
Liquidity Grab: The market’s attempt to shake out weak hands before the real move up. We’re smarter than that! 😏
Layered Entries: Spread your risk across multiple price levels for a smoother ride. 🎢
Risk Management: Clear SL and TP levels keep your heist disciplined and profitable. 🧠
⚠️ Disclaimer
This Thief Style Trading Strategy is just for fun and educational purposes! I’m not a financial advisor, and trading involves risks. Make your own decisions, manage your risk, and trade responsibly. Let’s keep the vibes high and the losses low! 😜
✨ “If you find value in my analysis, a 👍 and 🚀 boost is much appreciated — it helps me share more setups with the community!”
#NVIDIA #NVDA #Trading #SwingTrading #DayTrading #ThiefStrategy #StockMarket #Bullish #TechnicalAnalysis
Nvidia - The next rally of +33% started!🚀Nvidia ( NASDAQ:NVDA ) just broke out:
🔎Analysis summary:
Over the past couple of months, Nvidia has been rallying an expected +100%. However, just objectively looking at the chart, this rally is not over yet. After the confirmed all time high breakout, Nvidia can rally another +33% until it will retest a substantial resistance level.
📝Levels to watch:
$250
SwingTraderPhil
SwingTrading.Simplified. | Investing.Simplified. | #LONGTERMVISION

Nvidia - Starting a clear +20% rally!🧲Nvidia ( NASDAQ:NVDA ) rallies higher now:
🔎Analysis summary:
About one decade ago, Nvidia broke out of a major bullish triangle pattern. Following this remarkable breakout, Nvidia continued with a rally of about +35.000%. But looking at all these previous cycles, Nvidia remains bullish with another potential +20% move towards the upside.
📝Levels to watch:
$200, $250
SwingTraderPhil
SwingTrading.Simplified. | Investing.Simplified. | #LONGTERMVISION

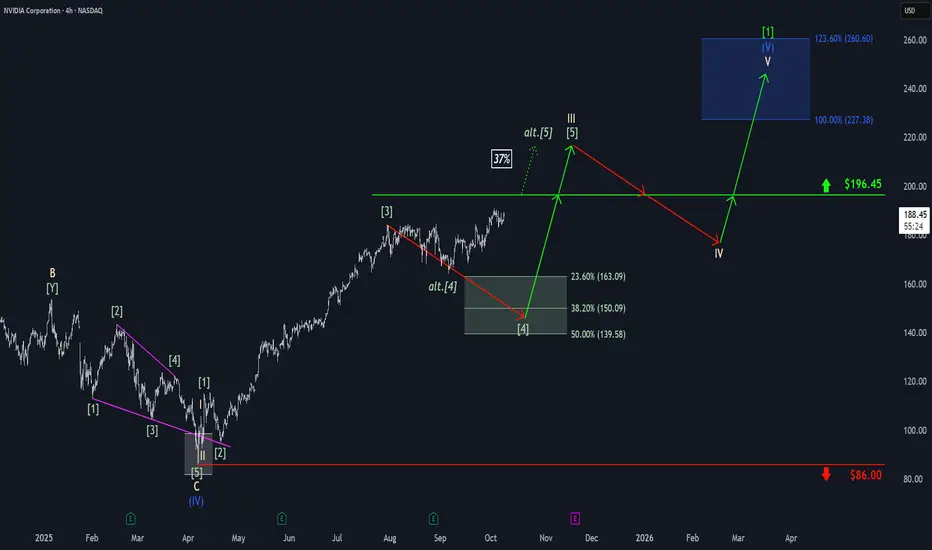
Nvidia: Bullish DistractionAmid bullish momentum, Nvidia edged closer to resistance at $196.45 before settling into sideways action late last week. As a result, there remains a 37% probability that the stock will bypass a new low and instead break directly above the $196.45 level. However, our primary expectation is for the stock to turn lower, targeting our green Target Zone between $163.09 and $139.58 to complete green wave . Only after this move do we anticipate a sustained advance above $196.45, which would mark the completion of beige wave III. Following a wave IV pullback below this threshold, we ultimately expect gains into the blue Target Zone between $227.38 and $260.60, where beige wave V should complete not only blue wave (V), but also the larger neon green wave .
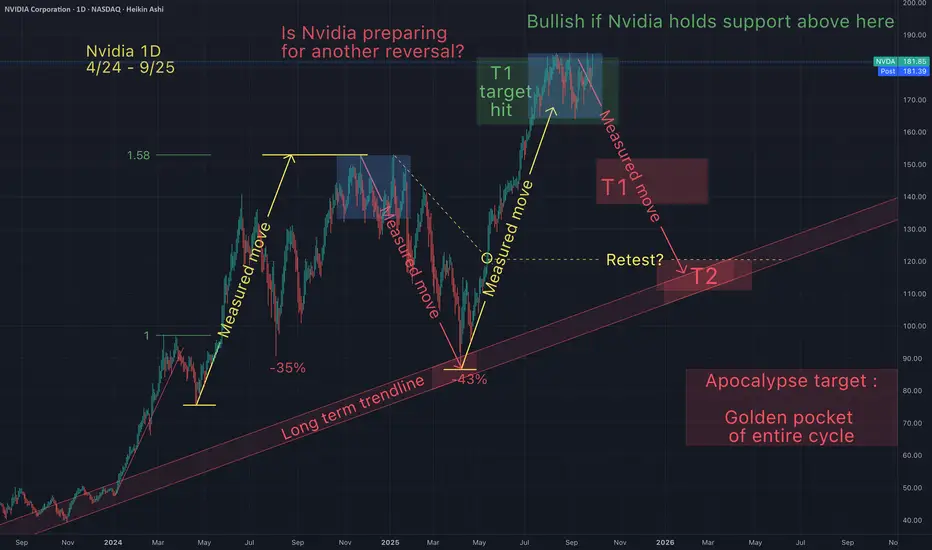
Is Nvidia preparing for another reversal?Is Nvidia preparing for another reversal? It would makes sense at this level. Could it continue up from here? Of course! But I only buy when it's red and retracing. I never jump on a moving train, so lets hope this train slows down so we can jump back in.
May the trends be with you.
Nvidia and OpenAI Announce Partnership, NVDA Shares SurgeNvidia and OpenAI Announce Partnership, NVDA Shares Surge
Yesterday it was revealed that leading chipmaker Nvidia and leading artificial intelligence research laboratory OpenAI have announced a strategic partnership, under which Nvidia will invest $100 billion in OpenAI.
A network of data centres will also be created to train and operate the most advanced artificial intelligence models:
→ the network will be based on Nvidia’s next-generation platform, Vera Rubin;
→ the network’s total capacity is unprecedented, reaching 10 gigawatts;
→ the first phase of the project is expected to launch in the second half of 2026.
Nvidia (NVDA) shares reacted sharply to the news. During Monday’s trading, 22 September, the company’s stock price jumped by roughly 4%, climbing at yesterday’s high above $184.30 (marking a new all-time record, as shown on the chart). The chipmaker’s market capitalisation closed in on $4.5 trillion, cementing its status as the most valuable company in the world.
Technical Analysis of Nvidia (NVDA) Chart
Previously, in our 1 September analysis of NVDA, we:
→ plotted an ascending channel describing NVDA’s price movements following the bullish impulse at the end of June;
→ noted unsuccessful attempts by the bulls to break resistance at $183, which provided grounds to view the chart in the context of a Triple Top pattern (1-2-3);
→ assumed that the bears were exerting pressure on an overvalued stock and considered a correction scenario.
Since then, the Nvidia stock price corrected to $165, from where it resumed its upward trend (shown with a broken arrow).
The new data provide grounds to:
→ expand the channel (shown in blue) without changing its slope, adding the QH and QL lines to divide the wider channel into quarters;
→ plot the trajectory of the correction (in red).
Within this context, it is reasonable to assume that:
→ the stock price of NVDA found support at the QL line and moved up towards the midline;
→ the red lines form a Bullish Flag pattern;
→ yesterday’s rise broke out of this corrective pattern, with the bulls attempting to resume the upward trend, though the $183 level still provides resistance.
It is not excluded that the strong fundamental background, the development of AI technologies, and the supportive driver of the Fed’s rate cut may ultimately enable the bulls to overcome the $183 level, paving the way for NVDA’s share price to approach the psychological $200 mark.
This article represents the opinion of the Companies operating under the FXOpen brand only. It is not to be construed as an offer, solicitation, or recommendation with respect to products and services provided by the Companies operating under the FXOpen brand, nor is it to be considered financial advice.
Nvidia - The rally is still not over!🔌Nvidia ( NASDAQ:NVDA ) still heads much higher:
🔎Analysis summary:
For the past decade, Nvidia has perfectly been respecting a major bullish rising channel formation. Currently, Nvidia is still far away from the upper red resistance trendline, which indicates another potential move higher. Just understand that the trend is your closest friend.
📝Levels to watch:
$200
SwingTraderPhil
SwingTrading.Simplified. | Investing.Simplified. | #LONGTERMVISION

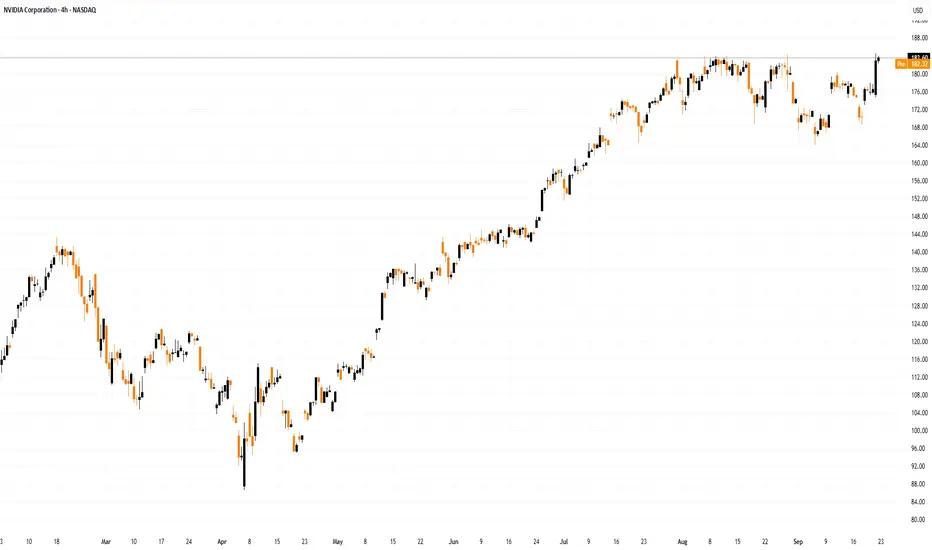
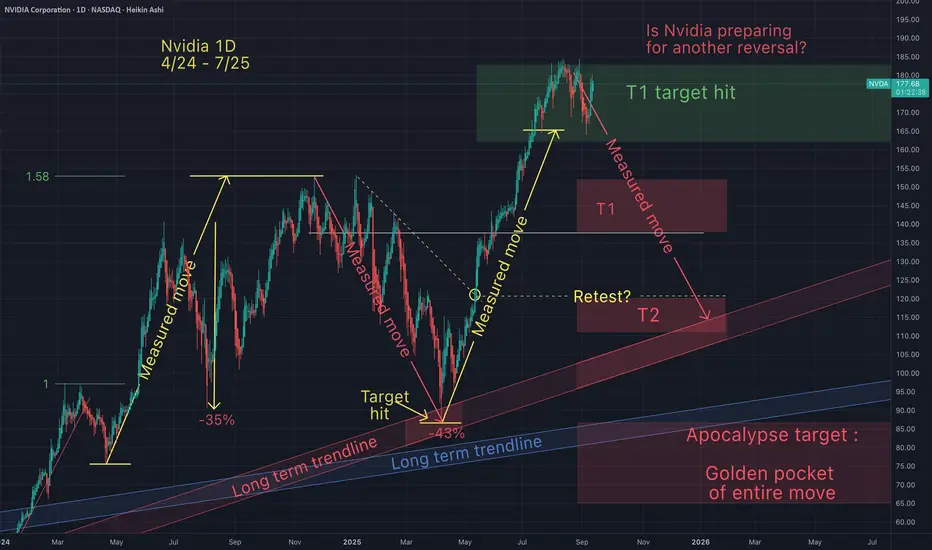
Is Nvidia preparing for a retracement?On July 23rd I posted a chart suggesting that Nvidia had topped (at my green T1). Since then Nvidia has stalled at my T1 range for the past 2 months.
Question remains, will Nvidia retrance from here as anticipated? What do you think, I'd like to hear from you, to gauge sentiment.
May the trends be witht you.

Is Nvidia preparing for a reversal?On July 23rd I suggested that Nvidia had reached my take profit zone (T1) and may be preparing for a reversal. Since then price has stalled in my T1 range.
Is Invidia preparing for a reversal? Let me know what do you think?
NVIDIA: Rally Stalling?After Nvidia initially drew closer to our beige Target Zone between $150.09 and $139.58, the stock was recently pushed higher once again. Therefore, we still see a 40% chance that a new high for beige wave alt.III could emerge above resistance at $184.11. However, our primary view is that price has already entered wave IV, which should extend downward into the aforementioned beige zone. Since we expect a strong rally during wave V, this price range presents an attractive entry point for long positions, with a stop that can be set 1% below the lower boundary of the zone. Looking ahead, beige wave V should extend up to the blue Target Zone between $227.38 and $260.60, where it should complete the larger waves (V) in blue and in lime green.

Nvidia (NVDA) Shows Bearish Signs After Earnings ReleaseNvidia (NVDA) Shows Bearish Signs After Earnings Release
On Wednesday, Nvidia published a fairly strong quarterly report:
→ Revenue for the second quarter came in at $46.74 billion (record), up 56% compared with the same period last year;
→ Adjusted earnings per share (EPS) were $1.05, a 54% year-on-year increase and above analysts’ expectations of $1.01–$1.02.
However, in the Data Centre segment (closely watched by the market), results fell slightly short of Wall Street forecasts, which may suggest a slowdown in capital flows into AI infrastructure. This factor could explain why Nvidia (NVDA) underperformed the index later in the week: for instance, the S&P 500 hit a record high on Thursday, while NVDA closed lower.
Technical analysis of Nvidia (NVDA) chart
Six days ago, we:
→ Drew an upward channel (shown in blue), capturing NVDA’s price swings after the bullish surge at the end of June;
→ Highlighted the importance of support at $170 and resistance at $183.
Indeed, $183 looks like a solid barrier:
→ The numbers (1, 2, 3) mark failed attempts by the bulls to break through this resistance, giving grounds to view the chart in the context of a triple top pattern.
→ The third peak only slightly exceeds the previous highs, which resembles a bull trap and the Upthrust After Distribution (UTAD) pattern in Richard Wyckoff’s methodology, signalling the prospect of lower prices. A bearish gap the following day (shown by the red arrow) and a weak Friday close underline the bears’ aggression.
Given the above, we could assume that the bulls may try to keep the price within the channel, relying on support at its lower boundary. Yet the mentioned signals suggest that the bears are intensifying pressure. If we see only a weak rebound from the lower boundary at the start of September, the current channel could be at risk. In the event of a bearish breakout, a move down to test the $170 support could happen.
This article represents the opinion of the Companies operating under the FXOpen brand only. It is not to be construed as an offer, solicitation, or recommendation with respect to products and services provided by the Companies operating under the FXOpen brand, nor is it to be considered financial advice.

Nvidia (NVDA) Upcoming Earnings ReportNvidia (NVDA) Upcoming Earnings Report
Tomorrow after hours, Nvidia will release its quarterly report, attracting heightened attention given its position as:
→ the world’s largest company (market capitalisation of around $4.39 trillion);
→ a leader in the development of AI-related industries;
→ strong stock price performance — approximately +33% year-to-date, +108% from the yearly low.
Bullish Expectations
Analysts anticipate Nvidia will report revenue of around $46 billion, more than 50% higher than the same period last year.
Investors are counting on confirmation of robust demand for Nvidia’s chips from tech giants such as Microsoft, Google, Amazon, and Meta, all of which continue to expand capital expenditure on data centres to power AI workloads.
Further support for NVDA’s share price could come from positive news about demand for the new Blackwell chips and the resumption of sales in China following a recent agreement with the US government.
Bearish Concerns
Even strong results may fall short of “sky-high” optimistic expectations, potentially triggering profit-taking and a decline in Nvidia’s (NVDA) stock price. The stock trades at a high P/E multiple (price-to-earnings ratio), making it vulnerable to any negative news or even a minor miss against forecasts.
The primary concern is that Nvidia’s forward guidance might point to a slowdown in AI infrastructure spending growth by its key clients. Any hint of this could negatively affect not only Nvidia’s shares but also the broader technology sector.
Technical Analysis of Nvidia (NVDA) Chart
NVDA’s share price remains within an upward channel (shown in blue), with the following configuration:
→ until mid-August, the price remained within the upper half of the channel;
→ in August, the price declined towards the lower boundary (point A).
The $170 level appears to be a key support:
→ it is a round psychological level;
→ the low at point A looks like an aggressive test of this level, after which the price reversed upward.
From a bullish perspective:
→ support is provided by the lower boundary of the channel;
→ a long bullish candlestick (2) signals persistent demand.
From a bearish perspective, the $183 level looks like key resistance: NVDA’s share price slowed its advance here in early August, with repeated unsuccessful attempts to break higher.
Given the above, we could assume that the bulls may attempt to push through the $183 resistance on the back of the earnings release, but to do so, Nvidia’s results and guidance must at least meet the market’s extremely optimistic expectations.
This article represents the opinion of the Companies operating under the FXOpen brand only. It is not to be construed as an offer, solicitation, or recommendation with respect to products and services provided by the Companies operating under the FXOpen brand, nor is it to be considered financial advice.
