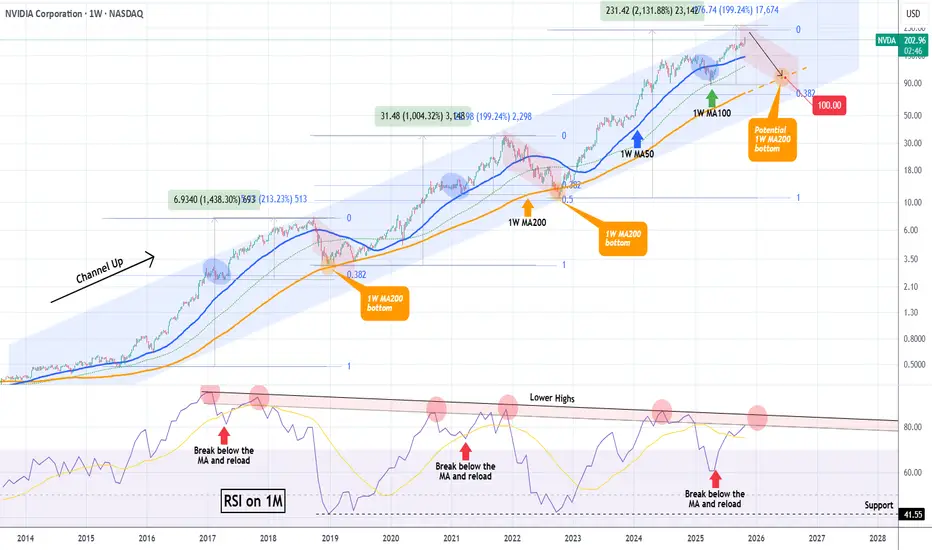
NVIDIA hit $5 Trillion but the end of the rally may be near.NVIDIA Corporation (NVDA) broke this week the $5 Trillion market cap barrier, becoming the first company to do so. In the meantime, it is extending the rally that started on the April 07 Low on the 1W MA100 (green trend-line), following the end of the Tariff War.
This rally has been nothing more than a part of the larger technical Bullish Leg inside the 10-year Channel Up that NVIDIA has been trading in. Within this pattern, the price has had rather asymmetric Bullish Legs in terms of rise % but has always been rejected at the top of the Channel Up and corrected back to the 1W MA200 (orange trend-line).
Following the mid-Bullish Leg corrections to the 1W MA50 (blue trend-line), the final rallies of the Bullish Legs before their Tops have been around +200%. Then their corrections/ Bearish Legs have always hit the 1W MA200 (as mentioned), with one time bottoming just above the 0.382 Fibonacci retracement level and the other below it (0.5 Fib).
We previously had NVIDIA's top at around $240, which is slightly below this expected +200% rise from the 1W MA100 bottom. As a result, we project that a potential contact with the 1W MA200 for the 2026 Bearish Leg can be achieved around $100, which is above the 0.382 Fib, similar to 2018.
Note that a very reliable Top indicator has also been the 1M RSI and its 9-year Lower Highs Zone. Every time the RSI entered the Zone and then broke below its MA (yellow trend-line) and rebounded, the next hit was the Bullish Leg's Top. Right now the 1M RSI is about to enter this Zone for the second time, indicating that we may be approaching the end of this long-term rally.
-------------------------------------------------------------------------------
** Please LIKE 👍, FOLLOW ✅, SHARE 🙌 and COMMENT ✍ if you enjoy this idea! Also share your ideas and charts in the comments section below! This is best way to keep it relevant, support us, keep the content here free and allow the idea to reach as many people as possible. **
-------------------------------------------------------------------------------
💸💸💸💸💸💸
👇 👇 👇 👇 👇 👇
Nvidiasignals
NVIDIA Next stop.. $200For a long time we've been calling for a $200 Target on NVIDIA Corporation (NVDA). That was our main Target for the Bull Cycle that started in November 2022. The stock is very close to this level and the short-term pattern that can get to it is this Channel Up.
Supported by the 1H MA100 (green trend-line), NVIDIA has been posting Bullish Legs of around +10% since the September 05 Low. The confirmation signal for those Legs has been a 1H MACD Bullish Cross.
Given that we formed one yesterday, we expect the price to be on such a Bullish Leg already. The 'weakest' of those sequences has been +9.58%, which if repeated, lands marginally above the $200 psychological level.
Time to hit it?
-------------------------------------------------------------------------------
** Please LIKE 👍, FOLLOW ✅, SHARE 🙌 and COMMENT ✍ if you enjoy this idea! Also share your ideas and charts in the comments section below! This is best way to keep it relevant, support us, keep the content here free and allow the idea to reach as many people as possible. **
-------------------------------------------------------------------------------
💸💸💸💸💸💸
👇 👇 👇 👇 👇 👇

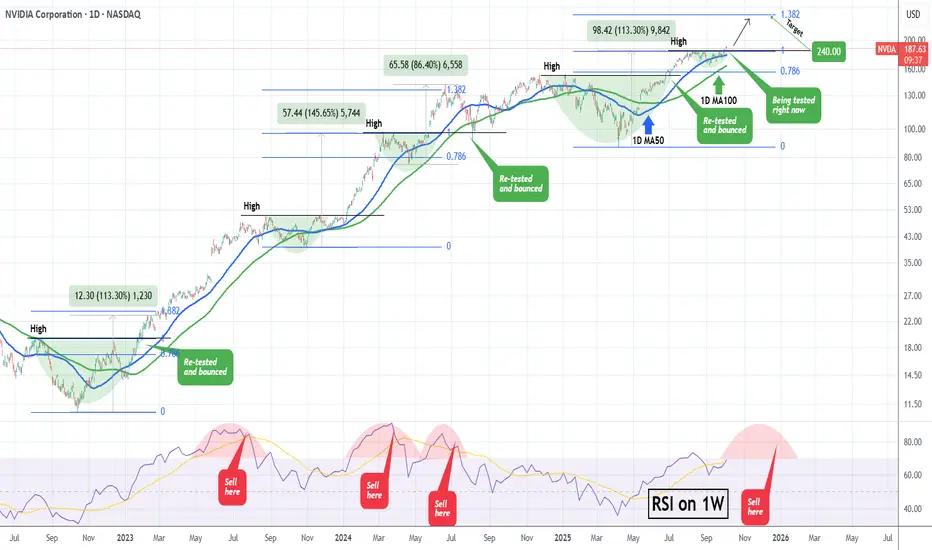
NVIDIA What happens when it retests a Resistance after a break?NVIDIA Corporation (NVDA) has been on a strong rise since the mid-term September 05 Low and this week finally broke above its previous $184 High. During the current Bull Cycle (since the October 2022 bottom), every time the price broke above a previous High and re-tested it as a Support, it started a secondary rally to new Highs.
Technically, as long as the 1D MA100 (green trend-line) holds, we should see at least a 1.382 Fibonacci extension test, similar to the February 2023 and June 2024 Highs. As a result, once the current former High / Resistance level finishes getting re-tested, we expect an end-of-the-year rally to $240.
Additionally, we will keep an eye on the 1W RSI. Typically, once it gets massively overbought above 85.00 and then starts to decline within an Arc peak formation, the time to Sell is after the middle of that Arc.
-------------------------------------------------------------------------------
** Please LIKE 👍, FOLLOW ✅, SHARE 🙌 and COMMENT ✍ if you enjoy this idea! Also share your ideas and charts in the comments section below! This is best way to keep it relevant, support us, keep the content here free and allow the idea to reach as many people as possible. **
-------------------------------------------------------------------------------
💸💸💸💸💸💸
👇 👇 👇 👇 👇 👇
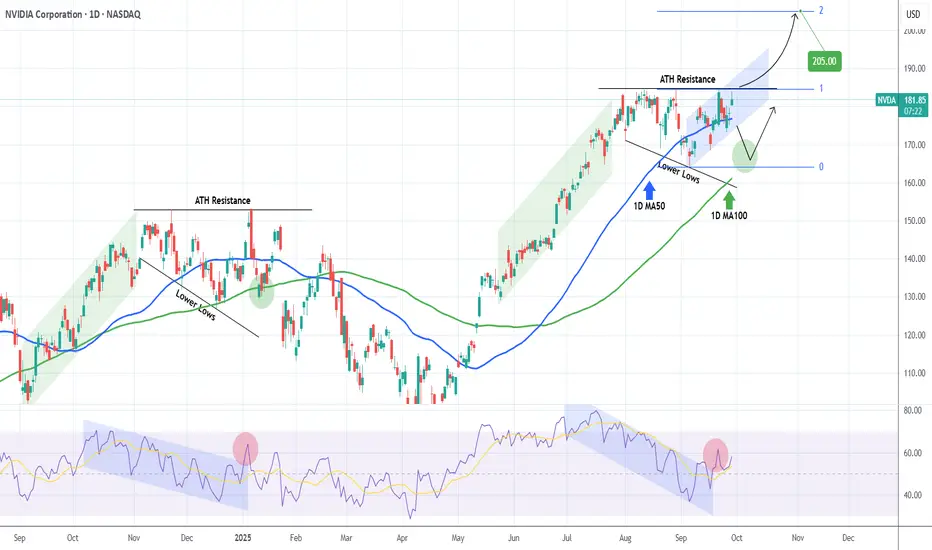
NVIDIA Will it finally make a new ATH?NVIDIA Corporation (NVDA) almost hit today its All Time High (ATH), which is currently its Resistance level. That is technically the top of a Descending Triangle pattern that the stock has been trading in since the start of August.
The last time we saw a similar pattern was during NVDA's previous ATH formation in November 2024 - January 2025. Identical price actions as well as 1D RSI sequences among the two fractals.
Based on that, we should be past a January 07 2025 ATH Resistance rejection, which targeted the 1D MA100 (green trend-line) before the next bounce. As a result, until the current ATH Resistance breaks, we should technically see a pull-back towards $166/67.
This time however, there is a strong case for a ATH break-out as the price is trading within a short-term (blue) Channel Up. As long as this holds, it can keep making Higher Highs, with the next one technically aiming above the ATH Resistance.
In any case, if that level breaks, we expect the price to target the 2.0 Fibonacci extension at just above $200.
-------------------------------------------------------------------------------
** Please LIKE 👍, FOLLOW ✅, SHARE 🙌 and COMMENT ✍ if you enjoy this idea! Also share your ideas and charts in the comments section below! This is best way to keep it relevant, support us, keep the content here free and allow the idea to reach as many people as possible. **
-------------------------------------------------------------------------------
💸💸💸💸💸💸
👇 👇 👇 👇 👇 👇
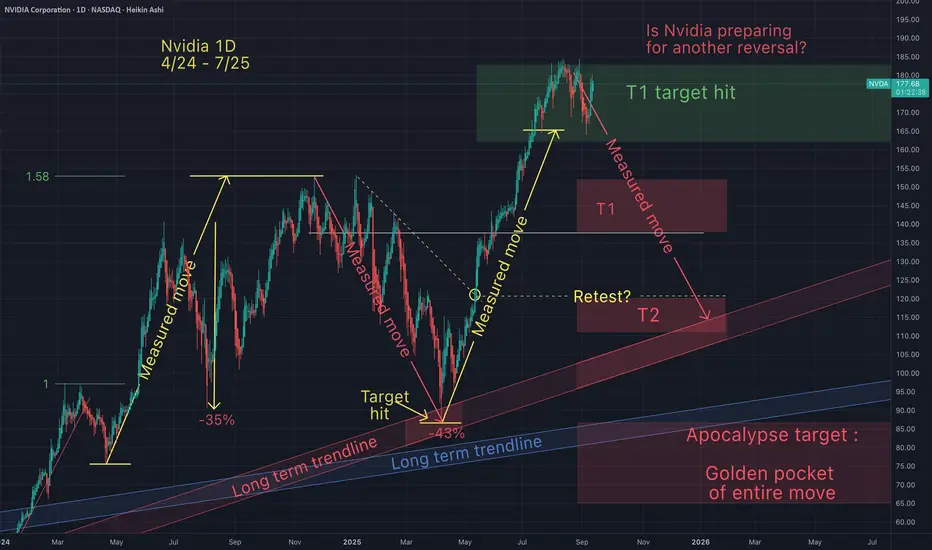
Is Nvidia preparing for a reversal?On July 23rd I suggested that Nvidia had reached my take profit zone (T1) and may be preparing for a reversal. Since then price has stalled in my T1 range.
Is Invidia preparing for a reversal? Let me know what do you think?
NVIDIA Has it bottomed??NVIDIA Corporation (NVDA) broke last week below its 1D MA50 (blue trend-line) for the first time in 4 months (since May 06). That was perceived as the bullish trend's strongest Support and rightfully so technically.
The next level to watch as a Support is the 1D MA100 (green trend-line), which was the level that held and led the stock to its previous peak during the last strong bullish trend of October 31 2023 to June 20 2024.
As you can see, there was a situation similar to today's where the price again broke below the 1D MA50 during the uptrend but kept the 1D MA100 intact and rebounded. Still, it managed to touch the 0.236 Fibonacci retracement level.
As a result, there might be potential for one more weekly Leg down to $155.00 (Fib 0.236) before recovering but this would also most likely mean breaking below the 1D MA100. This is doubtful but not impossible but still there are higher probabilities of a rebound sooner.
A strong indicator that is in Support of this is the 1D RSI, which just touched its 2-year Support Zone, a level that has always been a 'Buy' whether short or long-term. As far as a Target is concerned, the 2024 Channel Up peaked on the -0.382 Fibonacci extension, which is at $245.00.
-------------------------------------------------------------------------------
** Please LIKE 👍, FOLLOW ✅, SHARE 🙌 and COMMENT ✍ if you enjoy this idea! Also share your ideas and charts in the comments section below! This is best way to keep it relevant, support us, keep the content here free and allow the idea to reach as many people as possible. **
-------------------------------------------------------------------------------
💸💸💸💸💸💸
👇 👇 👇 👇 👇 👇

NVIDIA Is it still a buy after its Earnings release?NVIDIA Corporation (NVDA) delivered stronger-than-expected second-quarter earnings on Wednesday, but its data center revenue came in slightly below forecasts as U.S. restrictions on H20 chip sales to China weighed on results. The result was a 3.1% fall on the company's stock in after-hours trading following the report.
The obvious question is this: Is it still a buy?
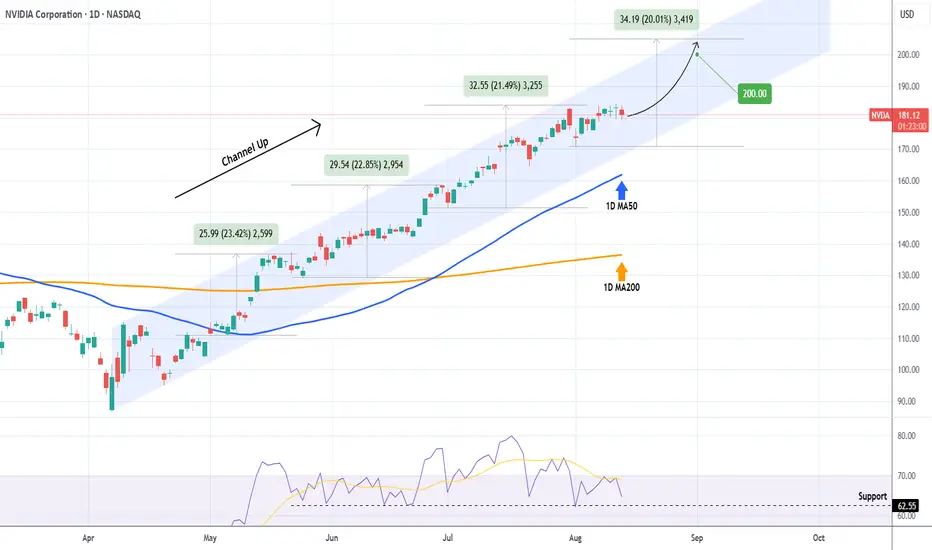
The answer can be given by purely looking at the technicals. Based on the bigger picture, the stock's 5-month pattern remains a Channel Up since the April 07 bottom, and in fact the recent dip on August 20 was a Higher Low exactly on the pattern's bottom and almost on the 1D MA50 (blue trend-line), which has been intact since May 06.
Given also the fact that the 1D CCI rebounded with aggression after marginally breaking below its oversold level (-100.00), similar to April 21, we expect NVIDIA to resume the bullish trend and extend this new Bullish Leg.
Since the last three Bullish Legs have all increased by a little more than +20%, we expect the price to easily reach our $200.00 long-term Target, before the next technical correction occurs.
-------------------------------------------------------------------------------
** Please LIKE 👍, FOLLOW ✅, SHARE 🙌 and COMMENT ✍ if you enjoy this idea! Also share your ideas and charts in the comments section below! This is best way to keep it relevant, support us, keep the content here free and allow the idea to reach as many people as possible. **
-------------------------------------------------------------------------------
💸💸💸💸💸💸
👇 👇 👇 👇 👇 👇
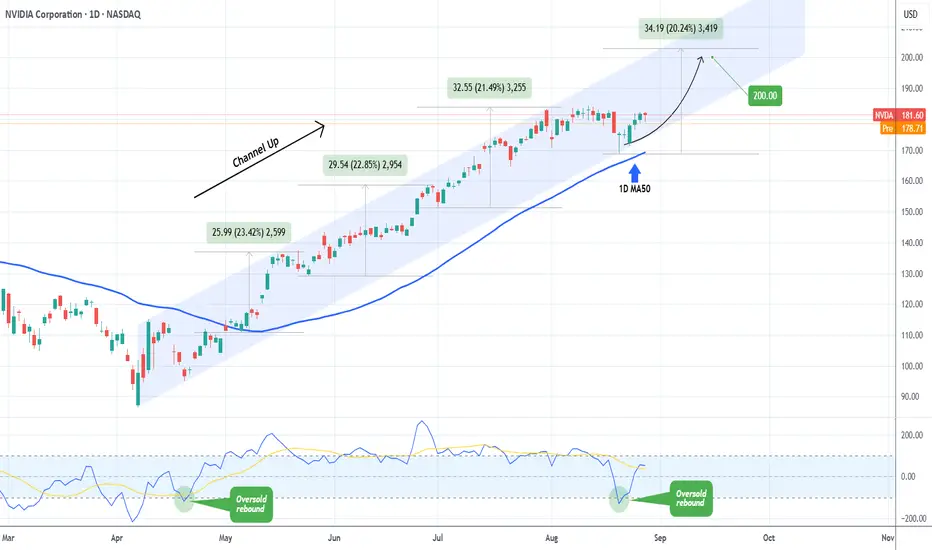
NVIDIA Is the path to $200 that easy?NVIDIA Corporation (NVDA) has been trading within a Channel Up since the April 07 market Low, being so aggressive that it has turned its 1D MA50 (blue trend-line) into Support since May 01.
The last 3 main Bullish Legs all rose by at least +20%. As long as the 1D RSI Support holds, we expect another such Leg, which would be enough for NVIDIA to reach the all important $200 psychological Target.
-------------------------------------------------------------------------------
** Please LIKE 👍, FOLLOW ✅, SHARE 🙌 and COMMENT ✍ if you enjoy this idea! Also share your ideas and charts in the comments section below! This is best way to keep it relevant, support us, keep the content here free and allow the idea to reach as many people as possible. **
-------------------------------------------------------------------------------
💸💸💸💸💸💸
👇 👇 👇 👇 👇 👇
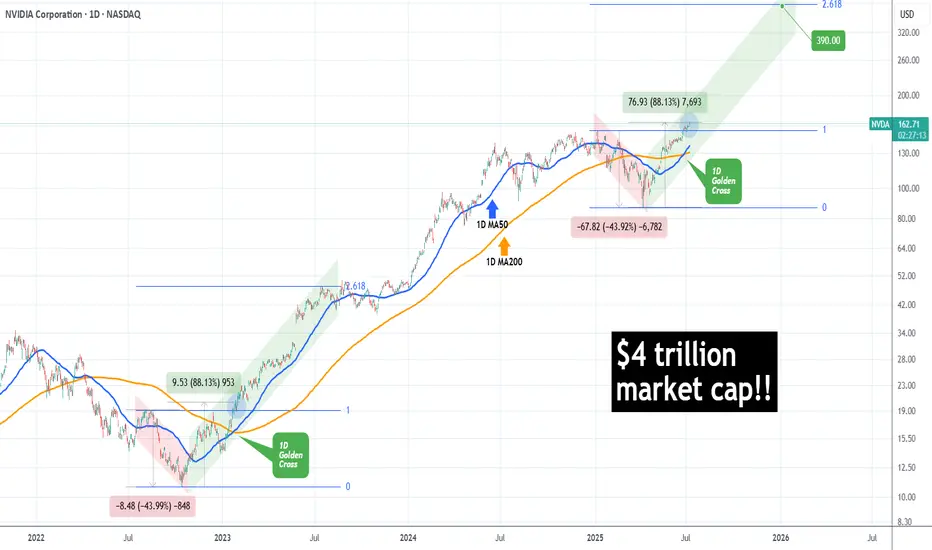
NVIDIA made history! First company with $4 trillion market cap!NVIDIA Corporation (NVDA) became today the first company in history to surpass a $4 trillion market value, as A.I. bulls extended the recent rally and pushed the price past the approximate $163.93 level needed to reach this market capitalization threshold.
The long-term trend on the 1D time-frame couldn't look more bullish. Coming off a 1D Golden Cross less than 2 weeks ago, the price has turned the 1D MA50 (blue trend-line) into Support and sits at +88.13% from the April 07 2025 Low.
This is the exact set-up that the market had when it was coming off the 2022 Inflation Crisis bottom (October 13 2022). As you can see, both fractals started with a -44% decline, bottomed and when they recovered by +88.13%, there were just past a 1D Golden Cross. In fact that Golden Cross (January 24 2023) was the last one before the current.
NVIDIA entered a Channel Up (green) on its recovery and for as long as the 1D MA50 was supporting, it peaked on the 2.618 Fibonacci extension before it pulled back below it.
If history repeats this pattern, we are looking at a potential peak around $390, which may indeed seem incredibly high at the moment, but as we pointed out on previous analyses, the market is in the early stages of the A.I. Bubble, similar to the Internet Bubble of the 1990s.
-------------------------------------------------------------------------------
** Please LIKE 👍, FOLLOW ✅, SHARE 🙌 and COMMENT ✍ if you enjoy this idea! Also share your ideas and charts in the comments section below! This is best way to keep it relevant, support us, keep the content here free and allow the idea to reach as many people as possible. **
-------------------------------------------------------------------------------
💸💸💸💸💸💸
👇 👇 👇 👇 👇 👇
NVIDIA Massive Cup and Handle targets $200.NVIDIA Corporation (NVDA) is pulling back aggressively following yet another positive Earnings report, where they beat the estimates again but the market is reacting with selling. That has been a 'norm' in the past 12 months but even from a technical standpoint, the price reached the 143.60 Resistance level (made of the February 18 High), so profit taking is technically normal market behavior here.
On the longer term however, this Resistance test potentially forms the top f a very powerful pattern, the Cup and Handle (C&H). At the moment, the market has the support of both the 1D MA200 (orange trend-line) and 1D MA50 (blue trend-line) and the Handle, which has just started, has some room to safely consolidate for a while before the pattern break-out upwards.
Technically, C&H patterns reach their 2.0 Fibonacci extensions after the break-out, so our medium-term Target is set at $200.
Notice also the Bearish Divergence on the 1D RSI, which is similar to that of late October 2024. A break below the 1D MA50 risks the bullish structure on this pattern.
-------------------------------------------------------------------------------
** Please LIKE 👍, FOLLOW ✅, SHARE 🙌 and COMMENT ✍ if you enjoy this idea! Also share your ideas and charts in the comments section below! This is best way to keep it relevant, support us, keep the content here free and allow the idea to reach as many people as possible. **
-------------------------------------------------------------------------------
💸💸💸💸💸💸
👇 👇 👇 👇 👇 👇

NVIDIA The 1W MA100 rebound is targeting $225 at least.NVIDIA Corporation (NVDA) broke last week above its 1W MA50 (blue trend-line) for the first time in 2.5 months and all this is generated by April's bottom rebound on the 1W MA100 (green trend-line).
The 1W MA100 has been intact since January 23 2023, so this rebound technically initiates a new Bullish Leg. Since the December 2018 bottom (previous U.S. - China Trade War), the minimum rise on such a Bullish Leg has been +156.11%. As a result, NVIDIA can now target $225 at least before the end of 2025.
-------------------------------------------------------------------------------
** Please LIKE 👍, FOLLOW ✅, SHARE 🙌 and COMMENT ✍ if you enjoy this idea! Also share your ideas and charts in the comments section below! This is best way to keep it relevant, support us, keep the content here free and allow the idea to reach as many people as possible. **
-------------------------------------------------------------------------------
💸💸💸💸💸💸
👇 👇 👇 👇 👇 👇

NVIDIA Massive bullish break-out after 4 months of selling.NVIDIA Corporation (NVDA) made a critical bullish break-out yesterday (in the aftermath of Meta's and Microsoft AI capex numbers) as it didn't just break above the 1D MA50 (blue trend-line) that has been intact as a Resistance since February 27 but also above the top of the Channel Down that has been the dominant pattern throughout this correction since the January 07 All Time High (ATH).
The 1D RSI is on an Inverse Head and Shoulders (IH&S) pattern, which is always bullish and if NVDA closes a 1D candle above the 1D MA50 next, then our short-term Target will be 143.50, which is just below Resistance 1 and the 2.0 Fibonacci extension.
-------------------------------------------------------------------------------
** Please LIKE 👍, FOLLOW ✅, SHARE 🙌 and COMMENT ✍ if you enjoy this idea! Also share your ideas and charts in the comments section below! This is best way to keep it relevant, support us, keep the content here free and allow the idea to reach as many people as possible. **
-------------------------------------------------------------------------------
💸💸💸💸💸💸
👇 👇 👇 👇 👇 👇

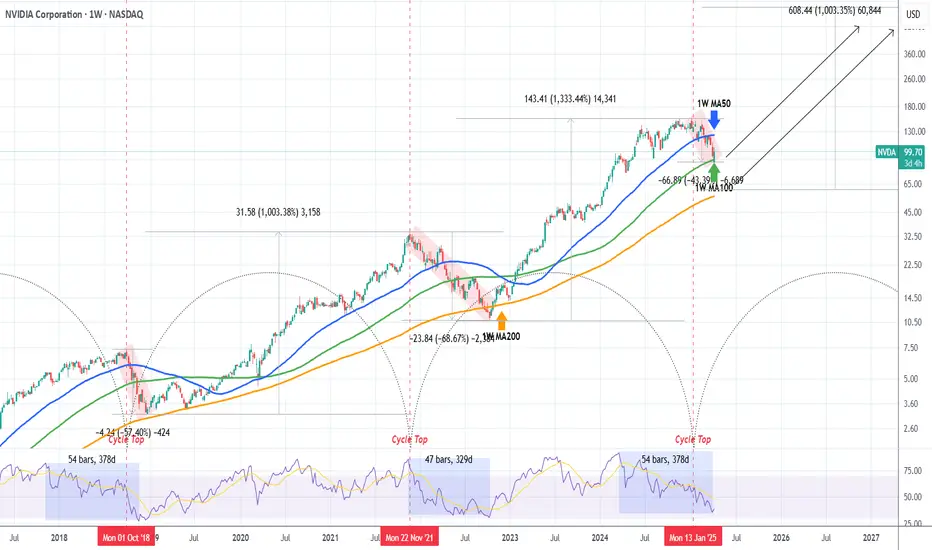
NVIDIA on Bear Market territory. Will the 1W MA100 save the day?NVIDIA Corporation (NVDA) has officially entered Bear Market territory as it has declined by almost -45% from the January 2025 All Time High (ATH) and just hit its 1W MA100 (green trend-line) for the first time since the week of January 30 2023.
This is the strongest correction the stock has seen since the 2022 Inflation Crisis and based on the Time Cycle Indicator of the last two Cycle Tops, the week of Jan 06 2025 falls indeed on the third count. This high degree of symmetry isn't only present on the price action but on the 1W RSI sequence itself as the current time range from the RSI High (March 18 2024) to today's Low is fairly consistent (54 weeks, 378 days) with the top-to-bottom range of the previous two Bear Markets, 2022 and 2018 (red Channel Down patterns).
So far the current correction looks similar to the September - December 2018 as not only their RSI counts are similar but both are more aggressive and fast than the 2022 Inflation Crisis. The 2018 correction though didn't top on the 1W MA100 but almost reached the 1W MA200 (orange trend-line) before making a bottom, but it did so in less than 2 months and declined by -57.40%. The current correction is already running for 3 months.
So what remains to be seen is if the 1W MA100 will manage to hold and kick-start a bullish reversal on its own, despite this correction being 'only' -43.39%. The 1W RSI dropped close enough to 30.00 (the oversold limit) though, which has historically been a very reliable indicator for a long-term buy on NVDA.
If those work in favor of the 1W MA100 holding, expect to see a strong rebound, that will confirm the new Bull Cycle with a break above the 1W MA50 (blue trend-line) and can technically aim for at least a +1000% rise from the bottom, as both previous Bull Cycles did.
If the 1W MA100 fails, we expect a bottom by the end of June 2025 around the 1W MA200 between $65-60. Again a +1000% rise from that level is technically plausible, potentially giving a Target estimate of at least $660.
-------------------------------------------------------------------------------
** Please LIKE 👍, FOLLOW ✅, SHARE 🙌 and COMMENT ✍ if you enjoy this idea! Also share your ideas and charts in the comments section below! This is best way to keep it relevant, support us, keep the content here free and allow the idea to reach as many people as possible. **
-------------------------------------------------------------------------------
💸💸💸💸💸💸
👇 👇 👇 👇 👇 👇
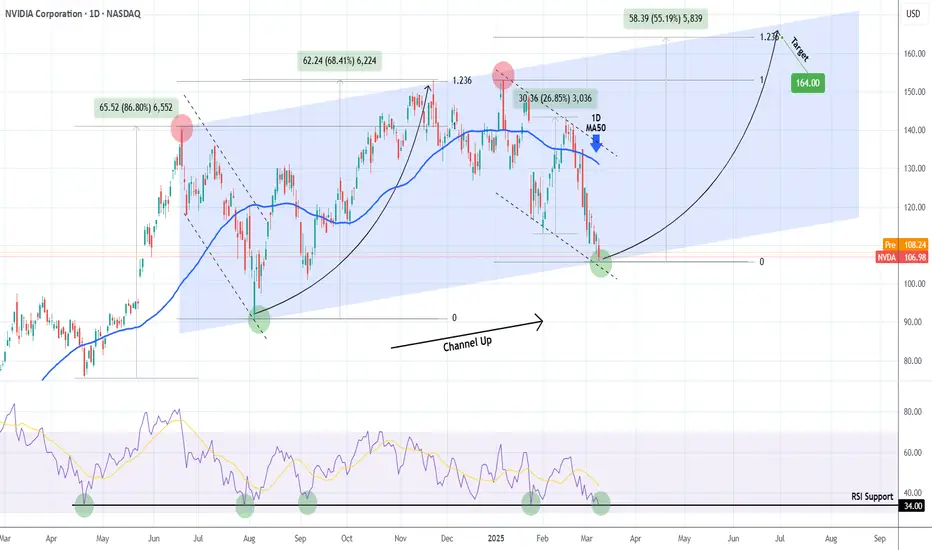
NVIDIA 9-month Channel Up bottomed! Is it a buy??NVIDIA Corporation (NVDA) has been trading within a Channel Up pattern for almost 9 months (since the June 20 2024 High). The correction since the start of January is technically the pattern's Bearish Leg and yesterday it hit the bottom (Higher Low trend-line).
Last time it did so was on August 05 2024 and an instant rebound followed. That was also the time the 1D RSI was on the 34.00 Support, just like today. In fact every time in the past 11 months that this RSI Support was tested, the price rebounded aggressively by at least +26.85%.
Since the previous Higher High rebound peaked on the 1.236 Fibonacci extension, our Target on the medium-term will be $164.00.
-------------------------------------------------------------------------------
** Please LIKE 👍, FOLLOW ✅, SHARE 🙌 and COMMENT ✍ if you enjoy this idea! Also share your ideas and charts in the comments section below! This is best way to keep it relevant, support us, keep the content here free and allow the idea to reach as many people as possible. **
-------------------------------------------------------------------------------
💸💸💸💸💸💸
👇 👇 👇 👇 👇 👇
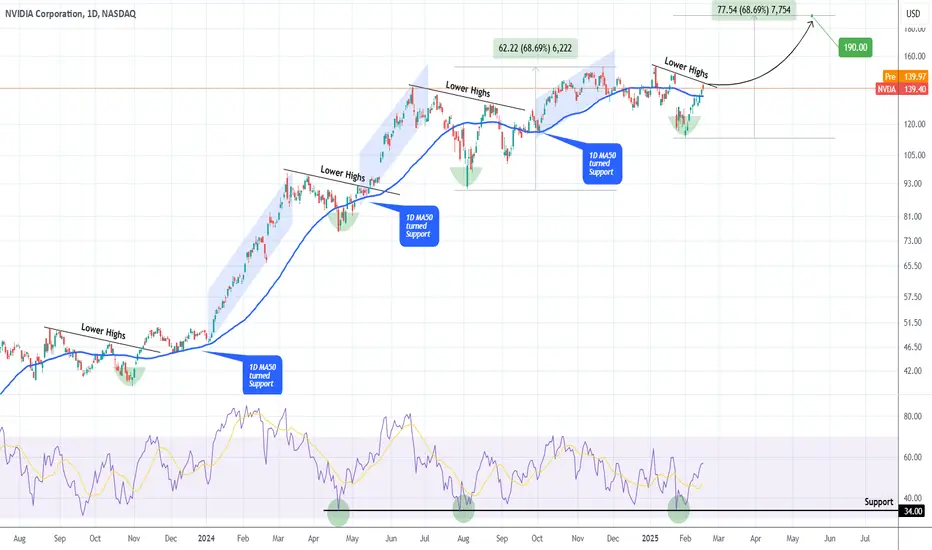
NVIDIA Rejected on the most important Resistance of all.Last time we looked at NVIDIA Corporation (NVDA) was just 20 days ago (January 29, see chart below) but we managed to get the exact bottom buy opportunity on the 1W MA50:
As the stock reacted with an immediate and relentless rally of 10 straight green 1D candles, it hit yesterday its first hurdle, the All Time High (ATH) Lower Highs trend-line and closed in red.
This Lower Highs trend-line is historically very important as every time a similar technical structure broke in the past 2 years, a strong rally followed. The early ones were stronger, which is natural to expect as the company was recovering from the 2022 Inflation Crisis and had enormous room to grow. On a side-note, the 1D RSI rebounded on its 34.00 Support, where the stock's last two bottoms were priced.
As a result, we believe that if NVIDIA breaks and closes above the current Lower Highs trend-line, it should at least repeat the last rally from its bottom (+68.69%), which translates to a $190 medium-term Target.
-------------------------------------------------------------------------------
** Please LIKE 👍, FOLLOW ✅, SHARE 🙌 and COMMENT ✍ if you enjoy this idea! Also share your ideas and charts in the comments section below! This is best way to keep it relevant, support us, keep the content here free and allow the idea to reach as many people as possible. **
-------------------------------------------------------------------------------
💸💸💸💸💸💸
👇 👇 👇 👇 👇 👇
NVIDIA hit its 1W MA50 after 2 years! One last rally left?NVIDIA Corporation (NVDA) opened significantly lower on Monday following the DeepSeek news on more efficient and lower cost A.I. competition and by doing so, the price hit its 1W MA50 (blue trend-line) for the first time in 2 years, resulting in Tuesday's very strong rebound.
We have to go back to the week of January 23 2023 to see NVDA trading again on the 1W MA50, which became the major Support of the Channel Up pattern that took it off the 2022 Inflation Crisis bottom.
So the question is, does NVIDIA have fuel left in the tank for one more rally? Technically the answer is yes and it can be found on the stock's price action since July 2015. As you can see, the price has gone through 3 similar eras of Bull Cycles through Channel Up patterns and subsequent Bear Cycles of strong corrections that touched the 1W MA200 (orange trend-line) before initiating the new Bull.
From the Bear Cycle bottom to the Bull Cycle's top, NVIDIA took around 1100 days (1162 during the 2015 - 2018 Cycle and 1071 during the 2019 - 2021 Cycle). Assuming the current Cycle will be at least as long as the last one (1071 days), the stock's Top is expected to be around September 2015.
It was in fact around this time during the last Cycle (Feb 2021) when NVIDIA touched again its 1W MA50, resulting into a new rally phase, the last one of the Cycle. This historic price action shows that during its last year, the stock always makes a January - Oct/Nov rally. When the 1W MA50 gets hit again, it is when the new Bear Cycle is confirmed.
As a result, based on this data set, we've entered NVIDIA's final rally of the Cycle, assuming of course it doesn't close a candle below the 1W MA50 and also that the 1M RSI recovers its MA trend-line (yellow), which also happened again during its previous Cycle.
-------------------------------------------------------------------------------
** Please LIKE 👍, FOLLOW ✅, SHARE 🙌 and COMMENT ✍ if you enjoy this idea! Also share your ideas and charts in the comments section below! This is best way to keep it relevant, support us, keep the content here free and allow the idea to reach as many people as possible. **
-------------------------------------------------------------------------------
💸💸💸💸💸💸
👇 👇 👇 👇 👇 👇

NVIDIA This is the final call for $240.NVIDIA corporation (NVDA) has been trading within a Channel Up for the past 2 years and just last Monday it made contact with its bottom (Higher Lows trend-line). As long as the 1D MA200 (orange trend-line) remains intact, the bullish trend will be maintained.
On top of that, the price action has just completed a pattern, which in the last two times we saw it (Q3 2024 and Q4 2023), it initiated a rally. With the Channel's Bullish Legs being at least of a +86.50% increase, we expect NVIDIA to target at least $240 by May.
-------------------------------------------------------------------------------
** Please LIKE 👍, FOLLOW ✅, SHARE 🙌 and COMMENT ✍ if you enjoy this idea! Also share your ideas and charts in the comments section below! This is best way to keep it relevant, support us, keep the content here free and allow the idea to reach as many people as possible. **
-------------------------------------------------------------------------------
💸💸💸💸💸💸
👇 👇 👇 👇 👇 👇

NVIDIA $NVDA | FALL OF THE CHIP KING, WHO'S UP NEXT? - Dec22'24NVIDIA NASDAQ:NVDA | FALL OF THE CHIP KING, WHO'S UP NEXT? - Dec22'24
NASDAQ:NVDA BUY/LONG ZONE (GREEN): $136.25 - $149.00
NASDAQ:NVDA DO NOT TRADE/DNT ZONE (WHITE): $133.00 - $136.25 (can be extended to $127.25 - $136.25)
NASDAQ:NVDA SELL/SHORT ZONE (RED): $118.25 - $133.00 (can be extended to $118.25 - $127.25)
NASDAQ:NVDA Trends:
NASDAQ:NVDA Weekly Trend: Bullish
NASDAQ:NVDA Daily Trend: Bullish
NASDAQ:NVDA 4H Trend: Bearish
NASDAQ:NVDA 1H Trend: Bearish
NASDAQ:NVDA stock has been in a downtrend since their last earnings release on Nov20, who will become the next trillion-dollar chip maker? Trying a new style of analysis. Previously would erase the zones that I would reference in the past, but now I will include them, as I have been constantly updating my NASDAQ:NVDA analysis for other to use and follow along. After we saw the fall from the Nov20 earnings report, price pulled back to the previous price level the day of earnings release, before tumbling back into the bearish zones. The down trend has not been broken for NASDAQ:NVDA , but bulls should look for a break above 136.25 and bears should look for continuation below 133.00 or 127.25.
I will link below my previous NASDAQ:NVDA analysis, along with my NASDAQ:SMCI analysis and NASDAQ:AMD analysis!
This is what I would personally look at before entering trades, everything is subject to change on a daily basis and as I analyze different timeframes and ideas.
ENTERTAINMENT PURPOSES ONLY, NOT FINANCIAL ADVICE!
trendanalysis, trendtrading, priceaction, priceactiontrading, technicalindicators, supportandresistance, rangebreakout, rangebreakdown, rangetrading, chartpatterntrading, chartpatterns, spy, sp500, s&p, fed, federalreserve, fedrate, fedratecut, interestrate, jeromepowell, fedchair, 50bps, volatile, volatility, nvidia, nvidiapricetarget, nvdatrend, nvidiatrend, nvdasetup, nvidialongs, nvidiashorts, chipmakers, smci, amd, supermicro, advancedmicro, chipmakertrends, newchipmakers, trilliondollarchipmakers, nvidiaproducts, nvidiachips, nvdachips, nvdatrend, nvdaprice, nvidiaprice, nvidiaanalysis, nvidiasetups, nvdaideas,

NVIDIA Analysis - Personal viewNVIDIA remains a leader in AI-driven markets, benefiting from demand for GPUs in data centers, gaming, and AI development. Its AI and machine-learning capabilities are shaping industries like autonomous vehicles and healthcare. However, valuation concerns and risks tied to macroeconomic shifts or supply chain vulnerabilities may pressure the stock.
Looking ahead to 2025, my personal target for NVIDIA lies between $200 and $250. This range reflects a cautious approach, factoring in potential earnings normalization, adjustments in investor sentiment, and the broader tech sector's resilience in an evolving economic environment.
*This is not financial advice.

Nvidia breakout pullback area, Buy timing NOW!!!!Overall speaking, Nvidia stock price is moving in a bullish market.
It just break above the pullback area, signaling a potential rally.
The price soared after break above the previous pullback area, which confirmed the high winrate of this buy point.

Nvidia's Meteoric Rise: $420 Billion Added in Four Days
Nvidia Corporation has once again captured the world's attention, this time with a stunning market value surge. The tech titan, synonymous with the burgeoning artificial intelligence (AI) landscape, has added a staggering $420 billion market capitalization in just four trading days. This represents a 17% surge in its stock price, leaving investors and analysts alike in awe.
The rally comes on the heels of a tumultuous period for Nvidia shareholders. The stock had experienced a significant downturn, wiping out billions in market value. However, the recent rebound has been spectacular, propelling the company into the spotlight as a dominant force in the tech industry.
What's driving this incredible resurgence?
Several factors are likely contributing to Nvidia's meteoric rise. Primarily, the company is at the forefront of the AI revolution. Its high-performance graphics processing units (GPUs) have become the de facto standard for training complex AI models. As the demand for AI applications continues to explode across industries, from healthcare and finance to autonomous vehicles and gaming, Nvidia stands to benefit immensely.
Investor sentiment has also played a crucial role. The recent dip in the stock price created a buying opportunity for many, with investors recognizing the long-term potential of Nvidia in the AI space. As the company prepares to release its earnings report at the end of the month, anticipation is building, and investors are positioning themselves for potentially strong results.
It's important to note that Nvidia's performance has had a ripple effect on the broader market. The company has accounted for a significant portion of the S&P 500's gains during this period, highlighting its outsized influence. This has led to a more optimistic outlook among investors, as positive sentiment surrounding Nvidia has spread to other tech stocks.
While the recent surge is undoubtedly impressive, it's essential to approach it with a degree of caution. The stock market is inherently volatile, and past performance is not indicative of future results. Investors must conduct thorough research and consider their risk tolerance before making any investment decisions.
Looking ahead, market participants will continue to closely watch Nvidia's trajectory. The company's ability to maintain its technological leadership in the AI space and its capacity to capitalize on emerging opportunities will be key determinants of its future success.
As the world becomes increasingly reliant on AI, Nvidia's role as a key player in this transformative industry is likely to solidify, making it a company worth keeping a close eye on.

NVIDIA to the moon ? It’s a profit taking zone for me !
NVIDIA from 150 to 30 something bad needs to happen with the market
For the moment everyone is bullish on NVIDIA but take this channel in to consideration

NVIDIA is going to top out, consolidate before taking offThere's only one more meme rally left before CBDC's. I expect Nvidia to meet guidance for earnings, will spike up and then crater.
There's some cheap puts for .20 for 500 strike price for July. Will probably be 450 after it's all said and done when it bottoms out. Which is a 2,250x return if the stock did crater! Couldn't rule out a flash crash. I think if we wait till next week to buy the puts it'll be cheaper, maybe .15 which is a 3,000x.
They will definitely soar when the FED ends up cutting rates after the BOJ sells treasuries and BRICS unveil their currency.
If Trump wins our country will convert back to a gold standard. If Biden wins they will try to usher in a CBDC. Better own some food, land, ammo and precious metals comrade if you do decide to vote against "Mean Tweets"...
