NZD/CHF BULLISH BIAS RIGHT NOW| LONG
Hello, Friends!
NZD/CHF is trending up which is evident from the green colour of the previous weekly candle. However, the price has locally plunged into the oversold territory. Which can be told from its proximity to the BB lower band. Which presents a beautiful trend following opportunity for a long trade from the support line below towards the supply level of 0.466.
Disclosure: I am part of Trade Nation's Influencer program and receive a monthly fee for using their TradingView charts in my analysis.
✅LIKE AND COMMENT MY IDEAS✅
Nzdchf!

Bullish bounce off pullback support?NZD/CHF is falling towards the pivot, which is a pullback support and could bounce to the 1st resistance.
Pivot: 0.45562
1st Support: 0.45192
1asr Resistance: 0.46117
Disclaimer:
The opinions given above constitute general market commentary and do not constitute the opinion or advice of IC Markets or any form of personal or investment advice.
Any opinions, news, research, analyses, prices, other information, or links to third-party sites contained on this website are provided on an "as-is" basis, are intended to be informative only, and are not advice, a recommendation, research, a record of our trading prices, an offer of, or solicitation for, a transaction in any financial instrument and thus should not be treated as such. The information provided does not involve any specific investment objectives, financial situation, or needs of any specific person who may receive it. Please be aware that past performance is not a reliable indicator of future performance and/or results. Past performance or forward-looking scenarios based upon the reasonable beliefs of the third-party provider are not a guarantee of future performance. Actual results may differ materially from those anticipated in forward-looking or past performance statements. IC Markets makes no representation or warranty and assumes no liability as to the accuracy or completeness of the information provided, nor any loss arising from any investment based on a recommendation, forecast, or any information supplied by any third party

NZDCHF: Bullish Push to 0.467?FX:NZDCHF is eyeing a bullish breakout on the 4-hour chart , with price rebounding from support after a downward trendline break and breakout candle, converging with a potential entry zone that could fuel upside momentum if buyers hold amid recent volatility. This setup suggests a continuation opportunity in the uptrend, targeting higher resistance levels with risk-reward exceeding 1:2.🔥
Entry between 0.4516–0.4544 for a long position. Target at 0.4670 . Set a stop loss at a daily close below 0.4585 , yielding a risk-reward ratio of more than 1:2 . Monitor for confirmation via a bullish candle close above entry with rising volume, leveraging the pair's momentum post-breakout.🌟
Fundamentally , NZDCHF is trading around 0.458 in late December 2025, with limited high-impact events for NZD this week, shifting focus to CHF catalysts that could influence the pair. For the Swiss Franc, key releases include Current Account Q3 on December 19 at 08:00 AM (forecast CHF 14.5B), where a weaker surplus might pressure CHF; Economic Sentiment Index DEC on December 23 at 09:00 AM (forecast 10), potentially weakening CHF if sentiment dips; and KOF Leading Indicators DEC on December 30 at 08:00 AM (forecast 102.5), with softer readings signaling economic slowdown and CHF vulnerability. No major NZD events until January, leaving the pair sensitive to CHF data and broader USD sentiment. 💡
📝 Trade Setup
🎯 Entry (Long):
0.4516 – 0.4544
🎯 Target:
• 0.4670
❌ Stop Loss:
• Daily close below 0.4585
⚖️ Risk-to-Reward:
• > 1:2
💡 Your view?
Will NZDCHF defend this breakout zone and push toward 0.4670 — or does momentum fade into consolidation? 👇

Bearish drop?NZD/CHF has rejected off the resistance level, which is a pullback resistance and could drop from this level to our take profit.
Entry: 0.46105
Why we like it:
There is a pullback resistance level.
Stop loss: 0.46333
Why we like it:
There is a pullback resistance level.
Take profit: 0.45529
Why we like it:
There is a pullback support that is slightly above the 61.8% Fibonacci retracement.
Enjoying your TradingView experience? Review us!
Please be advised that the information presented on TradingView is provided to Vantage (‘Vantage Global Limited’, ‘we’) by a third-party provider (‘Everest Fortune Group’). Please be reminded that you are solely responsible for the trading decisions on your account. There is a very high degree of risk involved in trading. Any information and/or content is intended entirely for research, educational and informational purposes only and does not constitute investment or consultation advice or investment strategy. The information is not tailored to the investment needs of any specific person and therefore does not involve a consideration of any of the investment objectives, financial situation or needs of any viewer that may receive it. Kindly also note that past performance is not a reliable indicator of future results. Actual results may differ materially from those anticipated in forward-looking or past performance statements. We assume no liability as to the accuracy or completeness of any of the information and/or content provided herein and the Company cannot be held responsible for any omission, mistake nor for any loss or damage including without limitation to any loss of profit which may arise from reliance on any information supplied by Everest Fortune Group.

NZDCHF is in the Bearish DirectionHello Traders
In This Chart NZDCHF HOURLY Forex Forecast By FOREX PLANET
today NZDCHF analysis 👆
🟢This Chart includes_ (NZDCHF market update)
🟢What is The Next Opportunity on NZDCHF Market
🟢how to Enter to the Valid Entry With Assurance Profit
This CHART is For Trader's that Want to Improve Their Technical Analysis Skills and Their Trading By Understanding How To Analyze The Market Using Multiple Timeframes and Understanding The Bigger Picture on the Chart

Bullish bounce off pullback support?NZD/CHF has bounced off the pivot, which has been identified as an overlap support, and could rise to the 1st resistance.
Pivot: 0.4587
1st Support: 0.45584
1st Resistance: 0.46322
Disclaimer:
The opinions given above constitute general market commentary and do not constitute the opinion or advice of IC Markets or any form of personal or investment advice.
Any opinions, news, research, analyses, prices, other information, or links to third-party sites contained on this website are provided on an "as-is" basis, are intended to be informative only, and are not advice, a recommendation, research, a record of our trading prices, an offer of, or solicitation for, a transaction in any financial instrument and thus should not be treated as such. The information provided does not involve any specific investment objectives, financial situation, or needs of any specific person who may receive it. Please be aware that past performance is not a reliable indicator of future performance and/or results. Past performance or forward-looking scenarios based upon the reasonable beliefs of the third-party provider are not a guarantee of future performance. Actual results may differ materially from those anticipated in forward-looking or past performance statements. IC Markets makes no representation or warranty and assumes no liability as to the accuracy or completeness of the information provided, nor any loss arising from any investment based on a recommendation, forecast, or any information supplied by any third party

NZD/CHF Price Action Supports Upside Continuation Scenario🔥 NZD/CHF Bullish Breakout After Kijun Retest — Upside in Play? 🔥
📊 Asset
NZD/CHF – “KIWI DOLLAR vs SWISSY”
Forex Market Trade Opportunity Guide (Swing / Day Trade)
🧭 Market Bias
🟢 Bullish Structure Confirmed
Price has successfully broken above the KIJUN Moving Average and completed a clean breakout + retest, signaling a shift in momentum from sellers to buyers. This type of Kijun behavior often acts as a trend continuation trigger when aligned with broader risk sentiment.
🎯 Trade Plan
📈 Bullish Plan – Active
✅ Confirmation: Kijun MA Breakout & Retest
🔓 Entry: You can enter at ANY price level
(Position sizing and timing should match your own execution model)
🛑 Stop Loss
🚫 Thief SL: 0.45600
Dear Ladies & Gentlemen (Thief OG’s),
Adjust your stop-loss based on your own risk management, volatility tolerance, and account size. This SL is not mandatory—it’s a reference level only.
⚠️ Note: I do not recommend blindly following my SL. You make money, you manage risk — your responsibility, your choice.
🎯 Target Zone
🎯 Primary Target: 0.46700
🚧 Police Barricade Resistance Zone
📊 Overbought conditions building
Potential liquidity trap near highs
Kindly escape with profits as price approaches this zone. Momentum may stall or reverse once supply steps in.
⚠️ Note: I do not recommend blindly following my TP. Scale out or exit based on your own system.
👀 Related Pairs to Watch (Correlation & Confirmation)
💱 NZD-Related (Risk Currency)
$NZD/USD 💵
🔹 Strong positive correlation with NZD/CHF
🔹 Kiwi strength vs USD supports upside continuation in NZD crosses
$AUD/NZD 💵
🔹 Acts as a regional sentiment gauge
🔹 AUD weakness vs NZD adds confidence to NZD bullish flows
💱 CHF-Related (Safe Haven)
OANDA:USDCHF 💵
🔹 CHF weakness vs USD often aligns with CHF weakness across the board
🔹 Rising USD/CHF = supportive for NZD/CHF upside
OANDA:EURCHF 💵
🔹 CHF selling pressure here confirms broader Swiss franc softness
🔹 Sustained EUR/CHF bids favor NZD/CHF bullish continuation
📌 Key Correlation Insight
📈 Risk-ON environment = NZD strength
📉 Risk-OFF environment = CHF strength
If equities and risk assets remain supported, NZD/CHF bullish structure stays valid.
🧠 Final Thought
This setup favors trend continuation traders following Ichimoku Kijun dynamics. Manage risk smartly, respect resistance zones, and don’t marry the trade.
💬 If this breakdown helps you, drop a LIKE ❤️, COMMENT 🗨️, and FOLLOW 🔔 for more clean market structures.
Trade safe. Trade disciplined. 💼📊

Bullish bounce off?NZD/CHF is falling towards the support level, which is an overlap support that aligns with the 38.2% Fibonacci retracement and could rise from this level to our take rpofit.
Entry: 0.45900
Why we like it:
There is an overlap support level that aligns with the 38.2% Fibonacci retracement.
Stop loss: 0.45575
Why we like it:
There is a pullback support level
Take profit: 0.4648
Why we like it:
There is a pullback resistance level.
Enjoying your TradingView experience? Review us!
Please be advised that the information presented on TradingView is provided to Vantage (‘Vantage Global Limited’, ‘we’) by a third-party provider (‘Everest Fortune Group’). Please be reminded that you are solely responsible for the trading decisions on your account. There is a very high degree of risk involved in trading. Any information and/or content is intended entirely for research, educational and informational purposes only and does not constitute investment or consultation advice or investment strategy. The information is not tailored to the investment needs of any specific person and therefore does not involve a consideration of any of the investment objectives, financial situation or needs of any viewer that may receive it. Kindly also note that past performance is not a reliable indicator of future results. Actual results may differ materially from those anticipated in forward-looking or past performance statements. We assume no liability as to the accuracy or completeness of any of the information and/or content provided herein and the Company cannot be held responsible for any omission, mistake nor for any loss or damage including without limitation to any loss of profit which may arise from reliance on any information supplied by Everest Fortune Group.

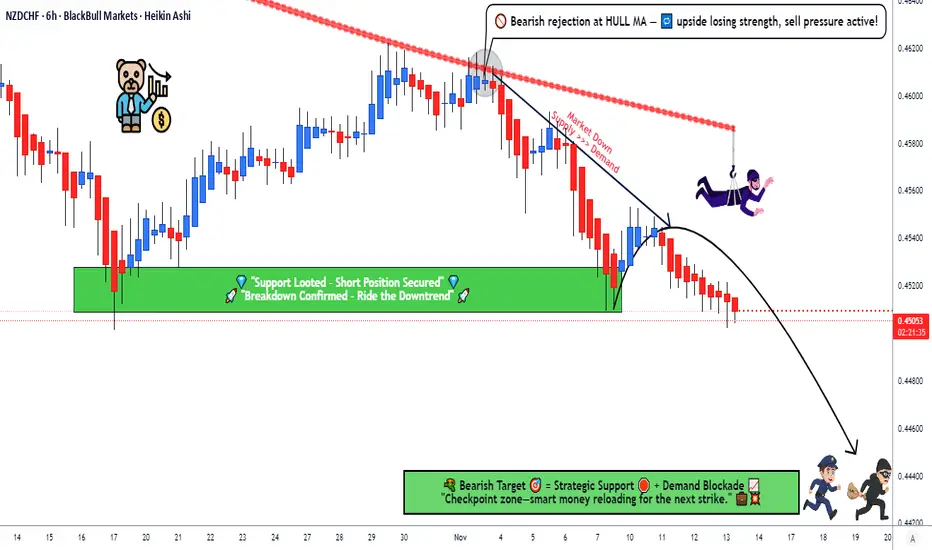
Will the Kiwi Fall Against the Swissy? Bearish Trend in MotionNZD/CHF Swing Trade Setup 🐻 | HULL MA Reversal & Support Breakout Confirmation! 🚨
🎯 Welcome, Traders! 🎯
Get ready for a high-probability swing trade opportunity on the NZD/CHF (Kiwi vs. Swissy)! This bearish plan is confirmed by a powerful technical confluence. Let's dive in! 👇
⚡ Trade Thesis: BEARISH ⚡
The pair is showing a classic trend reversal signature. We have a confirmed breakdown of a strong support level, coupled with a decisive pullback from the HULL Moving Average, signaling a shift in momentum to the downside.
📊 The Technical Edge (Why This Works):
HULL MA Rejection: Price has been rejected at the dynamic resistance of the HULL Moving Average, confirming the loss of bullish momentum. 📉
Support Turned Resistance: The previous strong support zone has now broken, and we expect it to act as a new resistance barrier.
Market Trap Identification: The structure suggests an overbought trap, where late bulls are likely getting squeezed. It's time to escape with the bears! 🐻➡️💰
🎯 Detailed Trading Plan (The "Thief" Strategy)
This plan uses a layered entry method to optimize your average entry price and manage risk effectively.
📍 Asset: NZDCHF | #Forex | #SwingTrade
🛑 Entry Strategy (Layer Method):
We are deploying multiple SELL LIMIT orders at the following key levels:
Layer 1: 0.45500
Layer 2: 0.45400
Layer 3: 0.45300
Layer 4: 0.45200
💡 Pro Tip: You can increase or decrease the number of layers based on your capital and risk appetite. The goal is to scale into the position.
🚨 Stop Loss (RISK MANAGEMENT):
A collective Stop Loss can be placed above the last layer and the recent swing high at 0.45600.
⚠️ Disclaimer: This is MY strategy. You MUST adjust your SL based on your personal risk tolerance and trading rules. Protect your capital first! 🙏
🎯 Take Profit Target:
Our primary profit target is set at 0.44400, a key support zone where we anticipate the next significant pullback or consolidation.
💰 Reminder: You are free to take partial profits along the way! Trail your stop or secure gains at your own discretion. The market is yours to conquer!
🔍 Related Pairs & Market Context
To strengthen your market view, keep an eye on these correlated assets:
OANDA:AUDCHF : The Australian Dollar often moves in correlation with the NZD (both are risk-sensitive, commodity-linked currencies). A bearish NZD/CHF is often confirmed by a weak AUD/CHF.
OANDA:NZDUSD & OANDA:AUDUSD : Watch the broader "Kiwi" and "Aussie" strength against the USD. If they are also showing weakness, it confirms a broader risk-off sentiment, strengthening our bearish NZD/CHF thesis.
OANDA:USDCHF : The Swiss Franc (CHF) is a traditional safe-haven. A strengthening CHF (weak NZD/CHF) might coincide with a weaker USD/CHF if the USD is also weak, or it could show pure CHF strength. Monitor this for clues on CHF flows.
Key Correlation Point: A strong bearish move in NZDUSD often amplifies the bearish move in NZDCHF.
💬 Let's Engage!
What do you think of this setup? 💭
Like & Follow if you found this analysis valuable!
Share your chart in the comments below!
🔔 Don't forget to follow my profile for more high-quality trade ideas and educational content!
#TradingView #ForexTrade #NZDCHF #SwingTrading #TechnicalAnalysis #Bearish #HULLMA #TradingStrategy #RiskManagement
NZD/CHF Turning Point — Are We Seeing a Breakout or Fakeout?🥝💶 NZD/CHF "KIWI DOLLAR VS SWISS" – Market Capital Flow Blueprint (Swing/Day Trade)
🧭 Plan:
A Bullish structure is confirmed with an LSMA (Least Squares Moving Average) breakout, signaling early momentum flow in favor of the Kiwi Dollar.
Market shows potential continuation after a breakout retest phase, supported by a constructive bullish bias in the CHF cross pairs.
Thief Trader’s Strategy:
I’m using a layering-style entry system — stacking multiple limit orders for optimal positioning.
Buy Limit Layers:
🧱 0.45500
🧱 0.45600
🧱 0.45700
🧱 0.45800
💡 You can customize or increase the layer levels based on your own style and risk comfort.
🎯 Target Zone:
Police barricade (resistance) spotted near 0.46400, where overbought conditions + liquidity trap potential = time to secure profits and vanish like a pro! 🕶️💰
⚠️ Note:
Dear Ladies & Gentlemen (Thief OGs) — this target is for illustration only. You can take profits, scale out, or hold based on your own plan. Trade safe, not greedy!
🛑 Stop-Loss Plan:
📍 Thief SL @ 0.45300
Remember: I’m not recommending everyone to use the same SL. It’s your trade, your risk. Adjust smartly according to your setup and psychology.
💬 Market Correlation Watchlist:
Keep an eye on related pairs to confirm flow direction and sentiment:
OANDA:NZDUSD → Correlates positively with NZD/CHF. A strong Kiwi vs. USD often strengthens NZD/CHF.
OANDA:USDCHF → Inverse correlation. When USDCHF falls, NZDCHF tends to rise.
OANDA:AUDCHF → Moves similarly with NZDCHF. Confirm trend strength across both pairs.
OANDA:EURCHF → Useful for identifying CHF-specific strength or weakness.
⚙️ Key Technical Points:
LSMA Breakout confirming trend shift 📈
Strong accumulation base below 0.45500
Momentum picking up on higher timeframes
RSI rising above neutral zone (momentum confirmation)
Risk-to-reward ratio aligns well for swing/day style setups
✨ “If you find value in my analysis, a 👍 and 🚀 boost is much appreciated — it helps me share more setups with the community!”
#NZDCHF #ForexAnalysis #SwingTrade #DayTrading #KiwiDollar #ThiefTrader #CHF #ForexStrategy #LSMA #MarketFlow #SmartMoney #ForexEducation

Bullish bounce off overlap support?NZD/CHF is falling towards the pivot and could bounce to the 1st resistance.
Pivot: 0.45870
1st Support: 0.45520
1st Resistance: 0.46664
Disclaimer:
The opinions given above constitute general market commentary and do not constitute the opinion or advice of IC Markets or any form of personal or investment advice.
Any opinions, news, research, analyses, prices, other information, or links to third-party sites contained on this website are provided on an "as-is" basis, are intended to be informative only, and are not advice, a recommendation, research, a record of our trading prices, an offer of, or solicitation for, a transaction in any financial instrument and thus should not be treated as such. The information provided does not involve any specific investment objectives, financial situation, or needs of any specific person who may receive it. Please be aware that past performance is not a reliable indicator of future performance and/or results. Past performance or forward-looking scenarios based upon the reasonable beliefs of the third-party provider are not a guarantee of future performance. Actual results may differ materially from those anticipated in forward-looking or past performance statements. IC Markets makes no representation or warranty and assumes no liability as to the accuracy or completeness of the information provided, nor any loss arising from any investment based on a recommendation, forecast, or any information supplied by any third party

NZDCHF Is Bearish! Short!
Take a look at our analysis for NZDCHF.
Time Frame: 4h
Current Trend: Bearish
Sentiment: Overbought (based on 7-period RSI)
Forecast: Bearish
The market is on a crucial zone of supply 0.466.
The above-mentioned technicals clearly indicate the dominance of sellers on the market. I recommend shorting the instrument, aiming at 0.463 level.
P.S
We determine oversold/overbought condition with RSI indicator.
When it drops below 30 - the market is considered to be oversold.
When it bounces above 70 - the market is considered to be overbought.
Like and subscribe and comment my ideas if you enjoy them!

NZDCHF Technical Analysis! BUY!
My dear friends,
My technical analysis for NZDCHF is below:
The market is trading on 0.4629 pivot level.
Bias - Bullish
Technical Indicators: Both Super Trend & Pivot HL indicate a highly probable Bullish continuation.
Target - 0.4649
About Used Indicators:
A pivot point is a technical analysis indicator, or calculations, used to determine the overall trend of the market over different time frames.
Disclosure: I am part of Trade Nation's Influencer program and receive a monthly fee for using their TradingView charts in my analysis.
———————————
WISH YOU ALL LUCK

Bearish reversal off swing high resistance?NZD/CHF has rejected off the resistance level, which is a swing high resistance that aligns with the 127.2% Fibonacci extension and could reverse from this level to our take profit.
Entry: 0.4654
Why we like it:
There is a swing high resistance that aligns with the127.2% Fibonacci extension.
Stop loss: 0.4675
Why we like it:
There is a swing high resistance that aligns with the 128.2% Fibonacci extension.
Take profit: 0.4589
Why we like it:
There is an overlap support level that aligns with the 38.2% Fibonacci 38.2% Fibonacci retracement.
Enjoying your TradingView experience? Review us!
Please be advised that the information presented on TradingView is provided to Vantage (‘Vantage Global Limited’, ‘we’) by a third-party provider (‘Everest Fortune Group’). Please be reminded that you are solely responsible for the trading decisions on your account. There is a very high degree of risk involved in trading. Any information and/or content is intended entirely for research, educational and informational purposes only and does not constitute investment or consultation advice or investment strategy. The information is not tailored to the investment needs of any specific person and therefore does not involve a consideration of any of the investment objectives, financial situation or needs of any viewer that may receive it. Kindly also note that past performance is not a reliable indicator of future results. Actual results may differ materially from those anticipated in forward-looking or past performance statements. We assume no liability as to the accuracy or completeness of any of the information and/or content provided herein and the Company cannot be held responsible for any omission, mistake nor for any loss or damage including without limitation to any loss of profit which may arise from reliance on any information supplied by Everest Fortune Group.

NZDCHF CHANNEL BREAKOUT|SHORT|
✅NZDCHF has broken down out of the rising channel after running buy-side liquidity at the highs, showing clear ICT displacement and a shift in order-flow toward discount levels. Price is now drawing toward the next sell-side pocket near the target zone. Time Frame 2H.
SHORT🔥
✅Like and subscribe to never miss a new idea!✅

NZD-CHF Free Signal! Sell!
Hello,Traders!
NZDCHF tapped directly into a clean horizontal supply zone, sweeping buy-side liquidity that rested above prior highs. This reaction aligns with SMC premium pricing, where smart money distributes before initiating a corrective move lower.
--------------------
Stop Loss: 0.4660
Take Profit: 0.4634
Entry: 0.4646
Time Frame: 10H
--------------------
Sell!
Comment and subscribe to help us grow!
Check out other forecasts below too!
Disclosure: I am part of Trade Nation's Influencer program and receive a monthly fee for using their TradingView charts in my analysis.

NZDCHF FREE SIGNAL|SHORT|
✅NZDCHF taps into the higher-timeframe supply and shows displacement, suggesting a short-term drawdown toward the nearest liquidity pocket before any reversal impulse forms.
—————————
Entry: 0.4650
Stop Loss: 0.4659
Take Profit: 0.4634
Time Frame: 7H
—————————
SHORT🔥
✅Like and subscribe to never miss a new idea!✅

NZDCHF Under Pressure! SELL!
My dear subscribers,
My technical analysis for NZDCHF is below:
The price is coiling around a solid key level - 0.4632
Bias - Bearish
Technical Indicators: Pivot Points Low anticipates a potential price reversal.
Super trend shows a clear sell, giving a perfect indicators' convergence.
Goal - 0.4620
My Stop Loss - 0.4639
About Used Indicators:
By the very nature of the supertrend indicator, it offers firm support and resistance levels for traders to enter and exit trades. Additionally, it also provides signals for setting stop losses
Disclosure: I am part of Trade Nation's Influencer program and receive a monthly fee for using their TradingView charts in my analysis.
———————————
WISH YOU ALL LUCK

NZDCHF FREE SIGNAL|SHORT|
✅NZDCHF price is reacting inside the supply block and is about to retest the mitigation zone, with bearish displacement hinting at a downside move toward the target level.
—————————
Entry: 0.4615
Stop Loss: 0.4623
Take Profit: 0.4606
Time Frame: 4H
—————————
SHORT🔥
✅Like and subscribe to never miss a new idea!✅

Bullish momentum to continue?NZD/CHF has bounced off the support level which is an overlap support and could rise from this level to our take profit.
Entry: 0.45848
Why we like it:
There is an overlap support level.
Stop loss: 0.45566
Why we like it:
There is a pullback support level.
Take profit: 0.46520
Why we like it:
There is a multi-swing high resistance that is slightly below the 127.2% Fibonacci extension.
Enjoying your TradingView experience? Review us!
Please be advised that the information presented on TradingView is provided to Vantage (‘Vantage Global Limited’, ‘we’) by a third-party provider (‘Everest Fortune Group’). Please be reminded that you are solely responsible for the trading decisions on your account. There is a very high degree of risk involved in trading. Any information and/or content is intended entirely for research, educational and informational purposes only and does not constitute investment or consultation advice or investment strategy. The information is not tailored to the investment needs of any specific person and therefore does not involve a consideration of any of the investment objectives, financial situation or needs of any viewer that may receive it. Kindly also note that past performance is not a reliable indicator of future results. Actual results may differ materially from those anticipated in forward-looking or past performance statements. We assume no liability as to the accuracy or completeness of any of the information and/or content provided herein and the Company cannot be held responsible for any omission, mistake nor for any loss or damage including without limitation to any loss of profit which may arise from reliance on any information supplied by Everest Fortune Group.

Bullish momentum to continue?NZD/CHF is falling towards the support level, which is a pullback support that aligns with the 38.2% Fibonacci retracement and could bounce from this level to our take profit.
Entry: 0.45591
Why we like it:
There is a pullback support level that aligns with the 38.2% Fibonacci retracement.
Stop loss: 0.45159
Why we like it:
There is a pullback support level that aligns with the 61.8% Fibonacci retracement.
Take profit: 0.46520
Why we like it:
There is a pullback resistance that is slightly below the 127.2% Fibonacci extension.
Enjoying your TradingView experience? Review us!
Please be advised that the information presented on TradingView is provided to Vantage (‘Vantage Global Limited’, ‘we’) by a third-party provider (‘Everest Fortune Group’). Please be reminded that you are solely responsible for the trading decisions on your account. There is a very high degree of risk involved in trading. Any information and/or content is intended entirely for research, educational and informational purposes only and does not constitute investment or consultation advice or investment strategy. The information is not tailored to the investment needs of any specific person and therefore does not involve a consideration of any of the investment objectives, financial situation or needs of any viewer that may receive it. Kindly also note that past performance is not a reliable indicator of future results. Actual results may differ materially from those anticipated in forward-looking or past performance statements. We assume no liability as to the accuracy or completeness of any of the information and/or content provided herein and the Company cannot be held responsible for any omission, mistake nor for any loss or damage including without limitation to any loss of profit which may arise from reliance on any information supplied by Everest Fortune Group.

NZD/CHF SENDS CLEAR BEARISH SIGNALS|SHORT
Hello, Friends!
NZD/CHF pair is in the downtrend because previous week’s candle is red, while the price is clearly rising on the 1D timeframe. And after the retest of the resistance line above I believe we will see a move down towards the target below at 0.453 because the pair is overbought due to its proximity to the upper BB band and a bearish correction is likely.
Disclosure: I am part of Trade Nation's Influencer program and receive a monthly fee for using their TradingView charts in my analysis.
✅LIKE AND COMMENT MY IDEAS✅

Swing high resistance ahead?NZD/CHF is rising towards the pivot and could reverse to the 1st support, which is a pullback support.
Pivot: 0.46184
1st Support: 0.45882
1st Resistance: 0.46405
Disclaimer:
The opinions given above constitute general market commentary and do not constitute the opinion or advice of IC Markets or any form of personal or investment advice.
Any opinions, news, research, analyses, prices, other information, or links to third-party sites contained on this website are provided on an "as-is" basis, are intended to be informative only, and are not advice, a recommendation, research, a record of our trading prices, an offer of, or solicitation for, a transaction in any financial instrument and thus should not be treated as such. The information provided does not involve any specific investment objectives, financial situation, or needs of any specific person who may receive it. Please be aware that past performance is not a reliable indicator of future performance and/or results. Past performance or forward-looking scenarios based upon the reasonable beliefs of the third-party provider are not a guarantee of future performance. Actual results may differ materially from those anticipated in forward-looking or past performance statements. IC Markets makes no representation or warranty and assumes no liability as to the accuracy or completeness of the information provided, nor any loss arising from any investment based on a recommendation, forecast, or any information supplied by any third party.
