NZDCHF: So easy with Sphyn analysis!At the start of the week, the GBPNZD exchange rate is experiencing a defensive stance, with potential gains expected in the following days. Although there is noticeable volatility, it remains constrained within a narrow range. This indicates that we can anticipate further trading activity between levels near 2.0910, reminiscent of highs from 2023, and recent lows approximately at 2.0500.
Nzdchfshort

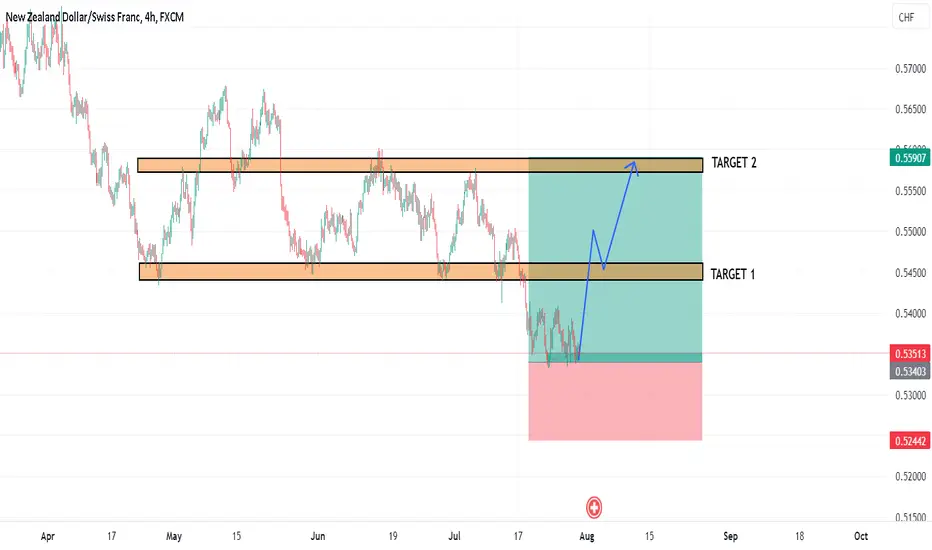
NZDCHF Long Term Buying Trading IdeaHello Traders
In This Chart NZDCHF DAILY Forex Forecast By FOREX PLANET
today NZDCHF analysis 👆
🟢This Chart includes_ (NZDCHF market update)
🟢What is The Next Opportunity on NZDCHF Market
🟢how to Enter to the Valid Entry With Assurance Profit
This CHART is For Trader's that Want to Improve Their Technical Analysis Skills and Their Trading By Understanding How To Analyze The Market Using Multiple Timeframes and Understanding The Bigger Picture on the Charts
NZDCHF TradeAfter taken liquidity o the buyside and change of character and beraker block we will see a drop of the price we consider Breaker block an entry point

NZDCHF Bearish Bias Prevails!NZD-CHF is trading in a
Downtrend and the pair broke
Out of the bearish triangle
Thus reinforcing our bearish bias
And I think that after some
Consolidation we will see
A further move down
Towards the 0.53107 level !

NZDCHF - Short from bearish order block ✅Hello traders!
‼️ This is my perspective on NZDCHF.
Technical analysis: After the change of character here price started to form lower lows and lower highs, so I am looking for shorts. I want price to fill the imbalance higher and then to reject from bearish order block.
Like, comment and subscribe to be in touch with my content!

NZDCHF- Future of the the pair yet to be decided!Dear traders, Bears have failed to break through the recent lows, indicating the change of the character to occur in coming days or weeks. Firstly, we need to wait and see how price behave in the coming week. If we see strong bullish price action, we can see a strong ‘bullish impulse’. If price fails and bears keep the selling momentum as it is then we will see another strong bearish impulse.

NZDCHF to drop again after a Short Formed M FormationShort Formed M pattern has formed where the second rounding top has a lower high than the previous.
This confirms the sellers are in control.
Now that the price has broken below the neckline, means we can expect the price to make the next down leg.
A conservative entry will be for one more leg up, test and break down.
200>21>7
RSI<50
Target 1 will be at 0.52711

NZDCHF - Risky long ✅Hello traders!
‼️ This is my perspective on NZDCHF.
Technical analysis: As I said in my previous analysis I look for a short from bearish order block, but as a risky long, I will see price to fill the imbalance lower and then to reject from institutional big figure 0.55000.
Fundamental analysis: This week on Thursday we have news on CHF, will be released Interest Rate. Follow the results in order to validate the analysis.
Like, comment and subscribe to be in touch with my content!

NZDCHF WILL MELT DOWNNZDCHF formed bearish pattern... descending triangle and already gave breakdown ,... price can drop from this level.

NZDCHF - Continuation To The Downside!Analysis:
This setup to us is ideal. Firstly price is clearly in a downwards trend and there is no doubt about this. We've seen price create a series of lower lows and lower highs which confirms that we are in a downwards trend. Knowing this we are only looking for shorts on this pair. Where price is currently is a very interesting area to us. Why? This area has held as major support in the past and as support recently so we now expect that it will hold as resistance. If you've been trading long enough you'll know that very often support can turn to resistance and resistance can turn into support. For more confluence at this area we have the 50% fib retracement level which we expect sellers will be sat at waiting before pushing price down further. We've also got an downwards trendline which has been beautifully respected multiple time showing us the bullish pressure and momentum on this pair. Fundamentally as well we're pretty neutral. Both the NZD and the CHF have almost the same long to short ratio so there isn't any real bias here until we dig a little further and we can see that the NZD only really had an increase in short positions by institutions whereas the CHF has an increase in both long and short positions by institutions so we actually have a slight bias to the bullish side of the CHF which goes with our idea and wraps up why we are bearish on this pair.
Please feel free to leave any comments you have and like this idea if you agree with us. Any feedback or comments will be read. We appreciate it all.
Stay Safe - JPI
Disclaimer:
This does not constitute as financial advise. We are not responsible for any monetary loss that you endure. Trading is hard to be profitable with and we take losses just like everyone else does to. Our ideas won't always be correct which is why we urge you to always do your own analysis first before entering into the market but please feel free to use our analysis to assist you with yours.

NZDCHF Monthly AnalysisHere is my analysis for NZDCHF on Monthly timeframe. The price could go bearish, you can put a pending order on the Order block or find an entry on LTF within OB Zone. Trade Safe!

NZD-CHF - KEYLEVELS for a scalp TradeNZD-CHF - KEYLEVELS for a scalp Trade.
These are the keylevels if you wanna enter in a scalp trade on this pair.

NZDCHF Sell TF H1. TP = 0.5457On the hour chart the trend started on June 2 (linear regression channel).
There is a high probability of profit. A possible take profit level is 0.5457
But do not forget about SL = 0.5533
Using a trailing stop is also a good idea!
Please leave your feedback, your opinion. I am very interested. Thank you!
Good luck!
Regards, WeBelieveInTrading

NZDCHF - Expect retracement ✅Hello traders!
‼️ This is my perspective on NZDCHF.
Technical analysis: We can see here a failure swing and then change of character, which means now I am looking for shorts. I expect price to make a retracement to fill that huge imbalance higher and then to reject from bearish order block.
Like, comment and subscribe to be in touch with my content!

NZDCHF ShortNzdchf from approaching Daily Resistance level.
expecting a sell down to continue the bearish Trend


NZDCHF - Short from premium zone ✅Hello traders!
‼️ This is my perspective on NZDCHF.
Technical analysis: Here we are in a bearish market structure from 4H timeframe perspective, so I am looking for shorts from premium zone. I expect price to continue the retracement to fill the imbalance higher and then to reject from bearish order block + institutional big figure 0.57000.
Like, comment and subscribe to be in touch with my content!

NZDCHFD SHORT - AWAITING CONFIRMATION!Waiting for a retest of 0.56310 to short NZDCHF back to prior lows at 0.54432
If you agree drop a like and if you have nay questions leave a comment :)

NZDCHF - descending channel.The price is moving in a descending channel and has reached the upper part of the channel and a strong resistance level, so a bearish movement is expected.
Good trading!
If you find it useful, like, follow, share!

NZDCHF - Bearish TrendBased on the chart, it appears that there is a bearish trend forming as evidenced by Lower highs (LHs) and lower lows (HLs).
Further analysis using the Relative Strength Index (RSI) indicates that there is currently no divergence present.
I recommend taking a short trade with a risk/reward ratio of 1:1.
Please note that this is my personal analysis and trade plan, and it is important for you to conduct your own research and risk management strategies before making any trading decisions.

Short NZDCHFNZDCHF is forming rising wedge pattern...shorts can be opened after confirmation with targets near 0.5400

NZDCHF - Short active ✅Hello traders!
‼️ This is my perspective on NZDCHF.
Technical analysis: Here we are in a bearish market structure from 4H timeframe perspective, so I am looking for shorts. I expect bearish price action from here as price rejected from bearish order block. My target is sell stop liquidity.
Fundamental analysis: Tomorrow will be released Unemployment Rate on NZD, which is forecasted to increase, this means weakness for currency. As well, on Friday will be released monthly CPI on CHF.
Like, comment and subscribe to be in touch with my content!

NZDCHF- Bearish Trend - 1H Time Frame Based on the chart, it appears that there is a bearish trend forming as evidenced by Lower highs (LHs) and lower lows (HLs). Further analysis using the Relative Strength Index (RSI) indicates that there is currently no divergence present. With this in mind, we recommend taking a long short with a risk/reward ratio of 1:1
Please note that this is my personal analysis and trade plan, and it is important for you to conduct your own research and risk management strategies before making any trading decisions.
