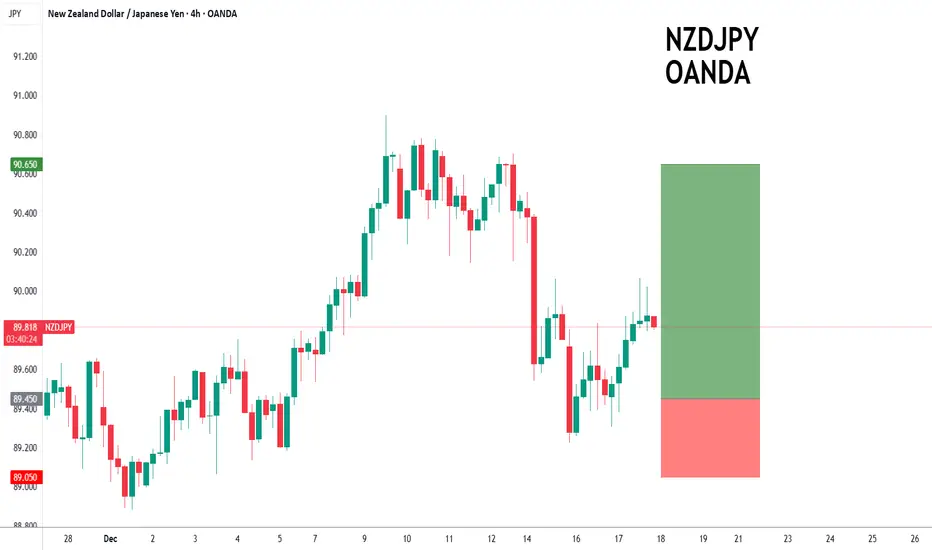
NZDJPY to continue in the upward move?NZDJPY - 24h expiry
Early pessimism is likely to lead to losses although extended attempts lower are expected to fail.
20 1day EMA is at 89.44.
We look for a temporary move lower.
Dip buying offers good risk/reward.
Our outlook is bullish.
We look to Buy at 89.45 (stop at 89.05)
Our profit targets will be 90.65 and 90.95
Resistance: 90.06 / 90.30 / 90.90
Support: 89.54 / 89.23 / 88.88
Risk Disclaimer
The trade ideas beyond this page are for informational purposes only and do not constitute investment advice or a solicitation to trade. This information is provided by Signal Centre, a third-party unaffiliated with OANDA, and is intended for general circulation only. OANDA does not guarantee the accuracy of this information and assumes no responsibilities for the information provided by the third party. The information does not take into account the specific investment objectives, financial situation, or particular needs of any particular person. You should take into account your specific investment objectives, financial situation, and particular needs before making a commitment to trade, including seeking, under a separate engagement, as you deem fit.
You accept that you assume all risks in independently viewing the contents and selecting a chosen strategy.
Where the research is distributed in Singapore to a person who is not an Accredited Investor, Expert Investor or an Institutional Investor, Oanda Asia Pacific Pte Ltd (“OAP“) accepts legal responsibility for the contents of the report to such persons only to the extent required by law. Singapore customers should contact OAP at 6579 8289 for matters arising from, or in connection with, the information/research distributed.
Nzdjpy!!
USDJPY: before BoJ🛠 Technical Analysis: On the 4-hour timeframe, USDJPY is maintaining a strong long-term bullish posture within a large ascending channel. The price has recently found solid support near the SMA 100 and SMA 200 confluence. The critical development will be the breakout above the descending resistance line that has been constraining price action since the November peak. Currently, the pair try to test the horizontal resistance zone around 157.00 – 158.00. A successful consolidation above this area, as indicated by the "Resistance line" breakout, confirms a trend continuation. With the moving averages trending upward and the price remaining in the upper half of the channel, the path of least resistance is toward the channel's upper boundary.
———————————————
❗️ Trade Parameters (BUY)
———————————————
➡️ Entry Point: Buy on a confirmed break of the resistance line (approx. 156.733 – 157.00).
🎯 Take Profit: 161.50 – 162.00 (Upper boundary of the Ascending Channel).
🔴 Stop Loss: Below the recent swing low and SMA support (approx. 155.162).
⚠️ Disclaimer: This is a potential trade idea based on current analysis; market conditions and price direction are subject to change based on news factors and volatility.

Is This Moving Average Pullback the Next NZD/JPY Entry?NZDJPY 🥝🔥 | Bullish Swing on MA Pullback | Key Levels & Correlation Guide
🚀 Trade Idea: NZD/JPY ("KIWI vs YEN") - Bullish Swing/Day Trade
A clean bullish structure is confirming itself! We're looking for opportunities on a pullback to dynamic support for the next leg up. 🎯
📈 Market Structure & Rationale:
Primary Trend: Bullish ✅
Current Phase: Potential pullback to a key moving average confluence for a higher low.
Trigger: Momentum alignment on a respected MA pullback (e.g., 21 or 50 EMA on H4/D1). This offers a favorable risk/reward entry.
⚙️ Trade Plan (Guide - Adapt to Your Strategy):
Entry Zone: ANY PRICE LEVEL ENTRY is possible, but for optimal R/R, watch for a bullish rejection or pattern near the 89.500 - 89.800 area (adjust based on live MA touch). 🎣
Stop Loss (Protection): A decisive break below 89.000 invalidates the immediate bullish structure. ⚠️ IMPORTANT: This is MY technical SL. Adjust based on YOUR risk tolerance & strategy. Your SL is your responsibility! 🙏
Take Profit Targets:
TP1: 90.200 (Initial Resistance)
TP2: 90.700 (Major Resistance & Profit Zone - Strong confluence, potential for overbought correction/trap 🪤). Escape with profits here is logical.
➡️ Scalpers can take partials earlier.
📢 Risk Disclaimer:
Dear Traders! 👋 This is an IDEA, not financial advice. I do NOT recommend using only my SL/TP levels. You MUST adjust them based on your own analysis, account size, and risk management. "You can make money, then take money at your own risk." Protect your capital! 🛡️
🔍 RELATED PAIRS TO WATCH & KEY CORRELATIONS:
Monitoring these pairs provides context for NZDJPY momentum:
OANDA:AUDJPY 🦘/🇯🇵: The primary correlation. Both are "risk-on" APAC pairs driven by commodity currencies vs. the safe-haven JPY. If AUDJPY is strong, it often supports NZDJPY bulls. Watch for divergence!
OANDA:NZDUSD 🥝/💵: Check the Kiwi's standalone strength. A strong NZDUSD confirms broad Kiwi demand, reinforcing NZDJPY longs.
OANDA:AUDUSD 🦘/💵: Another gauge for APAC/commodity sentiment. Weakness here can spill over to NZD pairs.
FX:USDJPY 💵/🇯🇵: CRITICAL. Direct JPY strength/weakness indicator. A surging USDJPY (weak JPY) can lift NZDJPY even if NZD is flat. A crashing USDJPY (strong JPY) can sink all JPY crosses.
🎯 Key Correlation Takeaway: For this NZDJPY long idea to thrive, we want:
✔️ Stable/Rising AUDJPY & NZDUSD.
✔️ No severe sell-off in USDJPY (i.e., JPY isn't broadly strengthening).
✔️ General "Risk-On" market sentiment.
Like & Follow for more multi-pair analysis! ❤️
Comments are open—share your charts and levels below! Let's get this bread. 🥖💰
#NZDJPY #Forex #TradingView #SwingTrading #DayTrade #Kiwi #Yen #TechnicalAnalysis #RiskManagement #Correlation

Bearish reversal?NZD/JPY is reacting off the pivot, which aligns with an overlap resistance. Price could drop toward the first support, which also acts as an overlap support.
Pivot: 89.67
1st Support: 88.80
1st Resistance: 90.03
Disclaimer:
The opinions given above constitute general market commentary and do not constitute the opinion or advice of IC Markets or any form of personal or investment advice.
Any opinions, news, research, analyses, prices, other information, or links to third-party sites contained on this website are provided on an "as-is" basis, are intended to be informative only, and are not advice, a recommendation, research, a record of our trading prices, an offer of, or solicitation for, a transaction in any financial instrument and thus should not be treated as such. The information provided does not involve any specific investment objectives, financial situation, or needs of any specific person who may receive it. Please be aware that past performance is not a reliable indicator of future performance and/or results. Past performance or forward-looking scenarios based upon the reasonable beliefs of the third-party provider are not a guarantee of future performance. Actual results may differ materially from those anticipated in forward-looking or past performance statements. IC Markets makes no representation or warranty and assumes no liability as to the accuracy or completeness of the information provided, nor any loss arising from any investment based on a recommendation, forecast, or any information supplied by any third party

NZDJPY:Support Retest vs. BoJ Volatility
FOREXCOM:NZDJPY NZD/JPY: Watching the 88.85 Support Floor – Confirmation Required Strategy: Support/Resistance + COT Sentiment Timeframe: D1 (Structure) / H4 (Trigger)
Market Context
NZD/JPY is currently caught in a tug-of-war. We have a fundamentally "neutral" New Zealand Dollar facing off against a Japanese Yen that is aggressively being bought back (Short-Covering) ahead of this Friday’s Bank of Japan rate decision.
The pair has pulled back from the 90.50 resistance and is now approaching a major structural "Buy Zone" on the Daily chart.
Technical Levels (S/R)
Major Resistance Zone: 90.75 – 90.95. This is the recent swing high. Bulls must reclaim this to target the 92.00 handle.
The Critical Floor (Support): 88.85 – 89.10. This level has been pivotal throughout late 2025. It aligns with the horizontal structural support on the Daily chart.
Secondary Support: 87.60. If 88.85 fails, this is the final macro defense.
COT & Fundamental "Fuel"
NZD: Large speculators are largely neutral, with no extreme positioning. This means the Kiwi lacks the "squeeze" energy seen in AUD or GBP.
JPY: Short-covering is the main driver. Net shorts have dropped to -31K, providing natural strength to the Yen.
RBNZ: Holding steady at 2.25%. No immediate catalyst for Kiwi strength.
🛡️ Execution Rule: The Confirmation Filter
With the BoJ expected to hike rates on Friday, we could see a "stop-run" below our support levels. Wait for one of these H4 signals at the 88.85 – 89.10 zone:
Bullish Engulfing: A strong green candle that closes above the high of the previous bearish candle.
The "Hammer" / Long Wick: Price stabs below 88.85 but aggressively reverses to close back above it, showing that buyers are defending the floor.
Morning Star Pattern: A three-candle sequence (Red -> Doji -> Green) confirming a bottom has formed.
🎯Trade Parameters
Entry: Only after H4 Confirmation at 88.85 - 89.10.
Stop Loss: (Below the recent swing lows).
Take Profit 1: 90.40 (Recent resistance).
Take Profit 2: 91.90 (Macro extension).

NZDJPY Will Explode! BUY!
My dear subscribers,
NZDJPY looks like it will make a good move, and here are the details:
The market is trading on 89.853 pivot level.
Bias - Bullish
Technical Indicators: Both Super Trend & Pivot HL indicate a highly probable Bullish continuation.
Target - 90.313
About Used Indicators:
The average true range (ATR) plays an important role in 'Supertrend' as the indicator uses ATR to calculate its value. The ATR indicator signals the degree of price volatility.
Disclosure: I am part of Trade Nation's Influencer program and receive a monthly fee for using their TradingView charts in my analysis.
———————————
WISH YOU ALL LUCK

Is NZD/JPY Setting Up for a Perfect Swing Trade Setup?🥝💴 KIWI vs YEN: The Ultimate Profit Heist Plan! (Swing/Day Trade Setup)
📊 Asset Overview
NZD/JPY | New Zealand Dollar vs Japanese Yen
Current Market Context: Price recently trading around 86.50, with recent volatility showing moves between 86.49 and 88.50
🎯 Trade Setup: BULLISH Bias
🚀 Entry Zones (Pick Your Poison)
1st Entry: @ 87.500 and above
For the aggressive OGs who love catching momentum
2nd Entry: Pullback & Retest @ 85.500+ (ATR Zone)
For the patient masterminds waiting for the clean retest
💡 Flexibility Note: You've got freedom anywhere above these levels — trade what you see, not what you feel!
🛡️ Stop Loss Zones (Guard Your Gold)
1st Entry SL: @ 86.500
Tight stop for momentum entries
2nd Entry SL: @ 85.000 (ATR Pullback Protection)
Wider net for retest entries
⚠️ Risk Disclosure: These are reference levels only! Adjust your stop loss based on YOUR risk tolerance and account size. This is your capital, your rules — manage it wisely!
💰 Target Zone (Escape with the Loot)
Primary Target: @ 89.500
🎪 What's Waiting There?
Strong resistance confluence
Overbought conditions likely
Potential liquidity trap zone
🏃💨 Exit Strategy: Don't get greedy! When you see profits, TAKE THEM. The market gives, but it also takes back. Scale out, lock gains, and live to trade another day.
📌 TP Flexibility: This target is guidance, not gospel. If you're in profit and want to secure gains earlier, DO IT! Your profit, your choice.
🔗 Related Pairs to Watch (Correlation Game)
Keep an eye on these correlated moves:
OANDA:AUDJPY | Sister Oceanic pair — moves together with NZD/JPY about 85% of the time
OANDA:NZDUSD | Kiwi strength indicator — if NZD/USD is bullish, it supports NZD/JPY upside
FX:USDJPY | The Yen boss — if USD/JPY rallies, JPY weakness helps NZD/JPY climb
OANDA:EURJPY | Risk sentiment gauge — risk-on = JPY weakness = NZD/JPY support
💵 Why These Matter:
All JPY crosses move on risk sentiment. When global markets are risk-on (stocks up, optimism high), JPY weakens and pairs like NZD/JPY, AUD/JPY, EUR/JPY rise. When fear hits (risk-off), JPY strengthens and these pairs drop. Watch the broader Yen picture!
Key Correlation Points:
✅ Strong correlation with commodity currencies (AUD, CAD)
✅ Inverse correlation with safe-haven flows (Gold, Bonds)
✅ Positive correlation with equity markets (S&P 500, Nikkei)
🧠 Technical Context
Bias: Bullish structure intact
Key Support: 85.000-85.500 (ATR zone)
Key Resistance: 89.500+ (profit-taking zone)
Strategy: Buy dips, sell rips, manage risk!
⚡ The Thief OG Mindset
This isn't financial advice — it's a treasure map. You decide if you want to dig. The market doesn't care about your feelings, your bills, or your dreams. It rewards patience, discipline, and ruthless risk management. Trade smart, not hard!
✨ If you find value in my analysis, a 👍 and 🚀 boost is much appreciated — it helps me share more setups with the community!
📜 Disclaimer
This is a "Thief Style" trading strategy shared purely for educational and entertainment purposes. This is NOT financial advice, investment guidance, or a recommendation to buy/sell any asset. Trading forex involves substantial risk of loss and is not suitable for all investors. Past performance does not guarantee future results. Always trade with money you can afford to lose, use proper risk management, and consult with a licensed financial advisor before making any trading decisions. By viewing this analysis, you acknowledge that all trading decisions are your own responsibility. Trade at your own risk! 🎲
#NZDJPY #ForexTrading #SwingTrading #DayTrading #KiwiYen #ForexSignals #TechnicalAnalysis #PriceAction #RiskManagement #ForexStrategy #CurrencyTrading #JPYPairs #ForexIdeas #TradingSetup #ForexCommunity #MarketAnalysis #ForexEducation #ThiefStyle #SmartMoney #ForexLife

NZDUSD: bearish reversal🛠 Technical Analysis: On the 4-hour timeframe, NZDUSD is showing signs of exhaustion after a sustained rally. The price is now trading near a strong resistance zone around 0.5850 and is expected to execute a short-term jump towards 0.5850-0.5880 for a final liquidity grab (liquidating late buyers) before a major reversal. The chart shows a potential downside move back to the key support level at 0.5690.
———————————————
❗️ Trade Parameters (SELL)
———————————————
➡️ Entry Point: Sell at Resistance (approx. 0.5850 – 0.5880)
🎯 Take Profit: 0.5690 (Support)
🔴 Stop Loss: Above the resistance zone (approx. 0.5915)
⚠️ Disclaimer: This is a potential trade idea based on current analysis; market conditions and price direction are subject to change based on news factors and volatility.

Falling towards pullback support?NZD/JPY is falling towards the pivot which acts as a pullback support and could bounce to the pullback resistance.
Pivot: 89.71
1st Support: 88.97
1st Resistance: 90.75
Disclaimer:
The opinions given above constitute general market commentary and do not constitute the opinion or advice of IC Markets or any form of personal or investment advice.
Any opinions, news, research, analyses, prices, other information, or links to third-party sites contained on this website are provided on an "as-is" basis, are intended to be informative only, and are not advice, a recommendation, research, a record of our trading prices, an offer of, or solicitation for, a transaction in any financial instrument and thus should not be treated as such. The information provided does not involve any specific investment objectives, financial situation, or needs of any specific person who may receive it. Please be aware that past performance is not a reliable indicator of future performance and/or results. Past performance or forward-looking scenarios based upon the reasonable beliefs of the third-party provider are not a guarantee of future performance. Actual results may differ materially from those anticipated in forward-looking or past performance statements. IC Markets makes no representation or warranty and assumes no liability as to the accuracy or completeness of the information provided, nor any loss arising from any investment based on a recommendation, forecast, or any information supplied by any third party

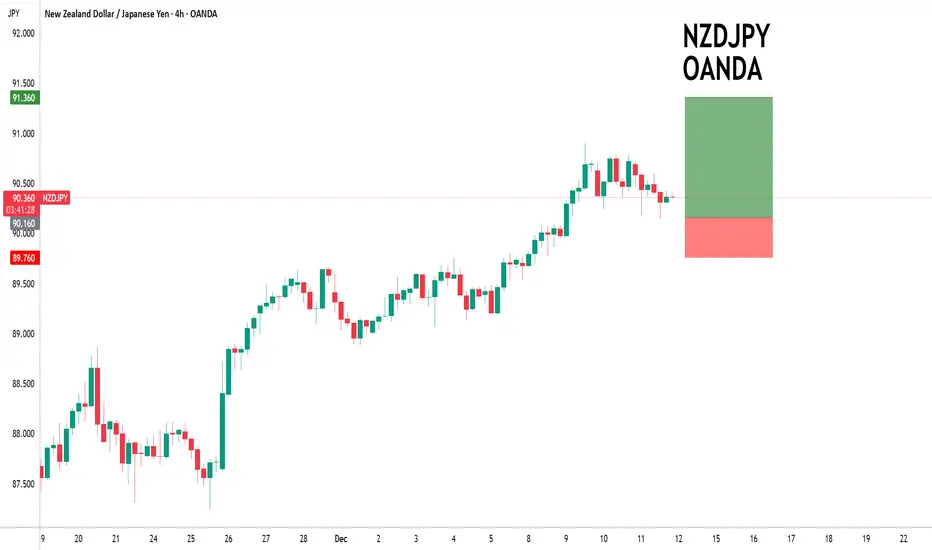
NZDJPY to continue in the upward move?NZDJPY - 24h expiry
Our short term bias remains positive.
There is no clear indication that the upward move is coming to an end.
Offers ample risk/reward to buy at the market.
The sequence for trading is higher highs and lows.
Daily signals are bullish.
We look to Buy at 90.16 (stop at 89.76)
Our profit targets will be 91.36 and 91.56
Resistance: 90.90 / 91.50 / 92.00
Support: 90.14 / 89.50 / 88.88
Risk Disclaimer
The trade ideas beyond this page are for informational purposes only and do not constitute investment advice or a solicitation to trade. This information is provided by Signal Centre, a third-party unaffiliated with OANDA, and is intended for general circulation only. OANDA does not guarantee the accuracy of this information and assumes no responsibilities for the information provided by the third party. The information does not take into account the specific investment objectives, financial situation, or particular needs of any particular person. You should take into account your specific investment objectives, financial situation, and particular needs before making a commitment to trade, including seeking, under a separate engagement, as you deem fit.
You accept that you assume all risks in independently viewing the contents and selecting a chosen strategy.
Where the research is distributed in Singapore to a person who is not an Accredited Investor, Expert Investor or an Institutional Investor, Oanda Asia Pacific Pte Ltd (“OAP“) accepts legal responsibility for the contents of the report to such persons only to the extent required by law. Singapore customers should contact OAP at 6579 8289 for matters arising from, or in connection with, the information/research distributed.
NZDJPY.Bullish Momentum Builds — Pullback or Lift-Off? After breaking above the 89.70 – 88.98 support zone, NZDJPY has entered a sustained bullish structure. Price stabilization above this zone shows strong buyer control, and any correction toward this area may act as a bullish pullback to retest support. 🟩📈
Price is now approaching the 91.94 – 92.33 resistance zone, an area that has shown significant reactions in the past. This level represents the first major challenge for buyers. A clean breakout above this resistance could open the path toward the key weekly resistance at 94.33, which may become the main target for mid-term bulls. 🔥
🎯 Potential Scenarios
1️⃣ Bullish Continuation (Primary Scenario)
If price breaks and holds above 92.33 with strong momentum, NZDJPY is likely to continue its upward trajectory toward higher resistance levels. The market structure remains clearly bullish.
2️⃣ Pullback Toward Support (Corrective Scenario)
If price fails to break the current resistance, a retracement toward the 89.70 – 88.98 support zone becomes likely. Such a correction could provide a new buying opportunity with a higher low formation. 📉➡️📈
⚠️ Risk Disclaimer
This analysis reflects personal opinion only and does not constitute financial advice or a buy/sell signal. Please apply proper risk management and follow your own trading plan. I am not responsible for any potential profits or losses. ⚠️
❓ What Do You Think?
Will NZDJPY break resistance first or drop for a deeper pullback?
Share your thoughts in the comments! 📊💬

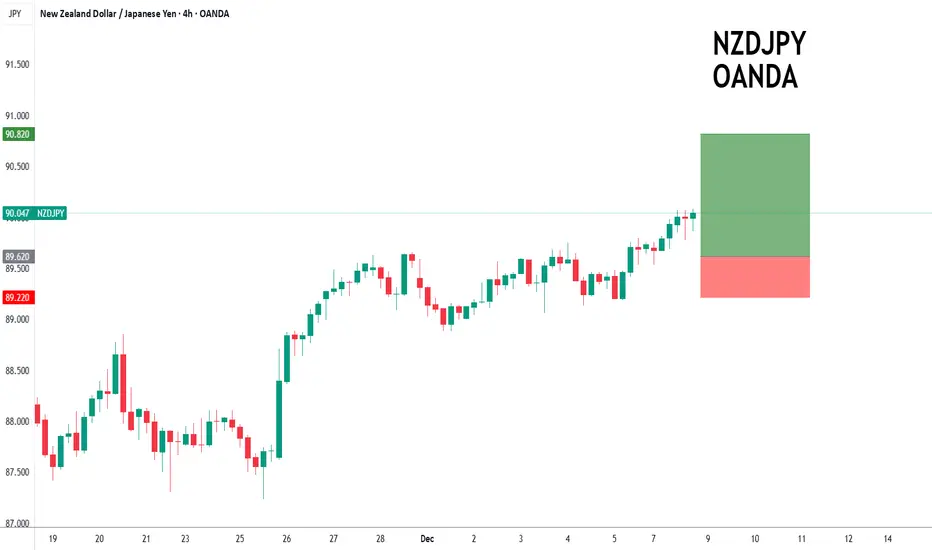
NZDJPY intraday dips continue to attract buyers.NZDJPY - 24h expiry
Intraday dips continue to attract buyers and there is no clear indication that this sequence for trading is coming to an end.
88.88 has been pivotal.
20 4hour EMA is at 89.62.
The RSI is trending higher.
Dip buying offers good risk/reward.
We look to Buy at 89.62 (stop at 89.22)
Our profit targets will be 90.82 and 91.02
Resistance: 90.07 / 90.50 / 91.00
Support: 89.60 / 89.06 / 88.88
Risk Disclaimer
The trade ideas beyond this page are for informational purposes only and do not constitute investment advice or a solicitation to trade. This information is provided by Signal Centre, a third-party unaffiliated with OANDA, and is intended for general circulation only. OANDA does not guarantee the accuracy of this information and assumes no responsibilities for the information provided by the third party. The information does not take into account the specific investment objectives, financial situation, or particular needs of any particular person. You should take into account your specific investment objectives, financial situation, and particular needs before making a commitment to trade, including seeking, under a separate engagement, as you deem fit.
You accept that you assume all risks in independently viewing the contents and selecting a chosen strategy.
Where the research is distributed in Singapore to a person who is not an Accredited Investor, Expert Investor or an Institutional Investor, Oanda Asia Pacific Pte Ltd (“OAP“) accepts legal responsibility for the contents of the report to such persons only to the extent required by law. Singapore customers should contact OAP at 6579 8289 for matters arising from, or in connection with, the information/research distributed.
NZDJPY Buyers In Panic! SELL!
My dear friends,
Please, find my technical outlook for NZDJPY below:
The instrument tests an important psychological level 89.694
Bias - Bearish
Technical Indicators: Supper Trend gives a precise Bearish signal, while Pivot Point HL predicts price changes and potential reversals in the market.
Target - 89.517
Recommended Stop Loss - 89.787
About Used Indicators:
Super-trend indicator is more useful in trending markets where there are clear uptrends and downtrends in price.
Disclosure: I am part of Trade Nation's Influencer program and receive a monthly fee for using their TradingView charts in my analysis.
———————————
WISH YOU ALL LUCK

AUDNZD: difficult situation🛠 Technical Analysis: On the 4-hour timeframe, AUDNZD has formed a bullish "Flag" pattern following a sharp decline, currently consolidating above the critical support zone at 1.1430. Price action is compressing within this structure, with the moving averages (SMA 50, 100, 200) fanning out above the price, confirming strong downward pressure. The projected setup anticipates a bearish breakout below the 1.1430 accumulation zone, signaling a continuation of the downtrend toward the lower support target at 1.1282.
———————————————
❗️ Trade Parameters (SELL)
———————————————
➡️ Entry Point: Sell on a confirmed breakdown of the immediate support consolidation (approx. 1.1430 – 1.1420)
🎯 Take Profit: 1.1282 (Lower Support Zone)
🔴 Stop Loss: 14787
⚠️ Disclaimer: This is a potential trade idea based on current analysis; market conditions and price direction are subject to change based on news factors and volatility.

AUDUSD: trendline breakout🛠 Technical Analysis: On the 4-hour timeframe, AUDUSD has broken above a key descending trendline and is currently testing immediate resistance near 0.65595. Although a "Global bearish signal" remains visible from the previous crossover, the recent price action suggests a bullish reversal if buyers can clear this short-term obstacle. The projected trade setup anticipates a confirmed breakout above this level, opening the door for a rapid rally toward the main resistance zone at 0.66200.
🌍 Fundamental Analysis: Volatility is expected to increase towards the end of the week amid Australian GDP data and key US data on Friday and Thursday. Traders are also exercising caution ahead of next week's Fed meeting, but this is more relevant to the medium-term outlook.
❗️ Trade Parameters (BUY) ❗️
➡️ Entry Point: Buy on breakout above short-term resistance (approx. 0.65600 – 0.65650)
🎯 Take Profit: 0.66200 (Major Resistance Zone)
🔴 Stop Loss: Below the recent consolidation (approx. 0.65369)
⚠️ Disclaimer: This is a potential trade idea based on current analysis; market conditions and price direction are subject to change based on news factors and volatility.

Bullish bounce in play?NZD/JPY has bounced off the support level which is a pullback support that aligns with the 38.2% Fibonacci retracement and could rise from this level to our take profit.
Entry: 88.76
Why we like it:
There is a pullback support that aligns with the 38.2% Fibonacci retracement.
Stop loss: 88.09
Why we like it:
There is a pullback support level that aligns with the 61.8% Fibonacci retracement.
Take profit: 90.19
Why we like it:
There is a resistance level at the 100% Fibonacci projection.
Enjoying your TradingView experience? Review us!
Please be advised that the information presented on TradingView is provided to Vantage (‘Vantage Global Limited’, ‘we’) by a third-party provider (‘Everest Fortune Group’). Please be reminded that you are solely responsible for the trading decisions on your account. There is a very high degree of risk involved in trading. Any information and/or content is intended entirely for research, educational and informational purposes only and does not constitute investment or consultation advice or investment strategy. The information is not tailored to the investment needs of any specific person and therefore does not involve a consideration of any of the investment objectives, financial situation or needs of any viewer that may receive it. Kindly also note that past performance is not a reliable indicator of future results. Actual results may differ materially from those anticipated in forward-looking or past performance statements. We assume no liability as to the accuracy or completeness of any of the information and/or content provided herein and the Company cannot be held responsible for any omission, mistake nor for any loss or damage including without limitation to any loss of profit which may arise from reliance on any information supplied by Everest Fortune Group.

Stop!Loss|Market View: NZDUSD🙌 Stop!Loss team welcomes you❗️
In this post, we're going to talk about the near-term outlook for the NZDUSD currency pair☝️
Potential trade setup:
🔔Entry level: 0.57355
💰TP: 0.57796
⛔️SL: 0.57134
"Market View" - a brief analysis of trading instruments, covering the most important aspects of the FOREX market.
👇 In the comments 👇 you can type the trading instrument you'd like to analyze, and we'll talk about it in our next posts.
💬 Description: By the end of the week, the US dollar remains under pressure for the short term, so a rise to 0.58000 is also expected for NZDUSD. A potential buy trade could be initiated by breaking the upper limit of the current accumulation in the triangle pattern that has formed at 0.57300.
Thanks for your support 🚀
Profits for all ✅

Falling towards key support?NZD/JPY is falling towards the support level, which is a pullback support that aligns with the 38.2% Fibonacci retracement and could bounce from this level to our take profit.
Entry: 88.76
Why we like it:
There is a pullback support that aligns with the 38.2% Fibonacci retracement.
Stop loss: 87.66
Why we like it:
There is a pullback support.
Take profit: 90.19
Why we like it:
There is a resistance level at the 100% Fibonacci projection.
Enjoying your TradingView experience? Review us!
Please be advised that the information presented on TradingView is provided to Vantage (‘Vantage Global Limited’, ‘we’) by a third-party provider (‘Everest Fortune Group’). Please be reminded that you are solely responsible for the trading decisions on your account. There is a very high degree of risk involved in trading. Any information and/or content is intended entirely for research, educational and informational purposes only and does not constitute investment or consultation advice or investment strategy. The information is not tailored to the investment needs of any specific person and therefore does not involve a consideration of any of the investment objectives, financial situation or needs of any viewer that may receive it. Kindly also note that past performance is not a reliable indicator of future results. Actual results may differ materially from those anticipated in forward-looking or past performance statements. We assume no liability as to the accuracy or completeness of any of the information and/or content provided herein and the Company cannot be held responsible for any omission, mistake nor for any loss or damage including without limitation to any loss of profit which may arise from reliance on any information supplied by Everest Fortune Group.

NZDJPY to continue in the rally?NZDJPY - 24h expiry
There is no clear indication that the upward move is coming to an end.
Offers ample risk/reward to buy at the market.
15min EMA is at 89.45.
Our outlook is bullish.
Our bespoke resistance of 89 has been clearly broken.
We look to Buy at 89.45 (stop at 89.05)
Our profit targets will be 90.65 and 90.95
Resistance: 89.56 / 90.00 / 90.50
Support: 89.00 / 88.65 / 88.40
Risk Disclaimer
The trade ideas beyond this page are for informational purposes only and do not constitute investment advice or a solicitation to trade. This information is provided by Signal Centre, a third-party unaffiliated with OANDA, and is intended for general circulation only. OANDA does not guarantee the accuracy of this information and assumes no responsibilities for the information provided by the third party. The information does not take into account the specific investment objectives, financial situation, or particular needs of any particular person. You should take into account your specific investment objectives, financial situation, and particular needs before making a commitment to trade, including seeking, under a separate engagement, as you deem fit.
You accept that you assume all risks in independently viewing the contents and selecting a chosen strategy.
Where the research is distributed in Singapore to a person who is not an Accredited Investor, Expert Investor or an Institutional Investor, Oanda Asia Pacific Pte Ltd (“OAP“) accepts legal responsibility for the contents of the report to such persons only to the extent required by law. Singapore customers should contact OAP at 6579 8289 for matters arising from, or in connection with, the information/research distributed.

NZD-JPYWe can focus on selling with appropriate risk to reward. By observing volume due to the counter-trend.

NZDUSD: bearish channel rejection🛠 Technical Analysis: On the 4-hour timeframe, NZDUSD is trending strictly within a descending channel and is currently rejecting off the key resistance zone near 0.5700. A "Global bearish signal" is highlighted where the Moving Averages have crossed downwards, confirming strong institutional selling pressure. The technical structure suggests a continuation of the decline toward the channel support at 0.5545, provided the price does not close back above the immediate resistance block.
🌍 Fundamental Analysis: The New Zealand Dollar faces downward pressure as markets position themselves for the US GDP data release scheduled for this week (Nov 26), which is expected to drive significant USD volatility. Investors are favoring the US Dollar due to resilient economic growth expectations compared to the softer outlook for the New Zealand economy. This divergence creates a fundamental backdrop that supports the technical bearish trend, with liquidity likely to focus on further downside.
❗️ Trade Parameters (SELL) ❗️
➡️ Entry Point: Sell on rejection from the Resistance Zone (approx. 0.5690 – 0.5700)
🎯 Take Profit: 0.55445 (Support Zone)
🔴 Stop Loss: Above the resistance structure (0.57371)
⚠️ Disclaimer: This is a potential trade idea based on current analysis; market conditions and price direction are subject to change based on news factors and volatility.

NZD/JPY BEARS WILL DOMINATE THE MARKET|SHORT
Hello, Friends!
We are now examining the NZD/JPY pair and we can see that the pair is going up locally while also being in a uptrend on the 1W TF. But there is also a powerful signal from the BB upper band being nearby, indicating that the pair is overbought so we can go short from the resistance line above and a target at 88.001 level.
Disclosure: I am part of Trade Nation's Influencer program and receive a monthly fee for using their TradingView charts in my analysis.
✅LIKE AND COMMENT MY IDEAS✅

NZD/JPY Bullish Breakout Setup | TMA & Pullback PlayNZD/JPY BULLISH BREAKOUT & LAYERED ENTRY STRATEGY 🚀
Hey TradingView Community! 👋 Get ready for a potential move in the Kiwi Dollar vs. the Yen. A clean technical setup is forming, and here’s my professional plan to capitalize on it.
📈 TRADE IDEA: BULLISH
Asset: NZD/JPY ("Kiwi Dollar vs. Yen")
Type: Day Trade / Swing Trade
Bias: Bullish 🟢
Core Concept: Triangular Moving Average (TMA) Breakout confirmed, now looking for a pullback to the Moving Average for a high-probability entry.
⚙️ TRADE PLAN & EXECUTION
✅ Confirmation & Trigger:
Price has broken above a key Triangular Moving Average, signaling a shift in momentum.
The trigger for entry is a pullback and bounce from the moving average support.
🎯 "Thief" Layered Entry Strategy:
This strategy uses multiple buy limit orders to scale into the position at favorable prices, averaging your entry cost.
Buy Limit 1: 87.500
Buy Limit 2: 88.000
Buy Limit 3: 88.500
💡 Pro Tip: You can adjust the number of layers and price levels based on your capital and risk appetite.
❗ Stop Loss (Risk Management):
A hard stop loss can be placed below the recent swing low at 87.000.
IMPORTANT NOTE 👇
"Dear Thief OG's & Fellow Traders – This is MY stop loss based on MY strategy. You MUST adjust your position size and SL level based on YOUR own risk management rules. Protect your capital first!"
🎯 Take Profit Target:
Primary Target: 90.200
Reasoning: This level aligns with:
A strong ATR-based resistance line.
Potential overbought conditions on lower timeframes.
A historical "trap zone" where reversals can occur.
KEY NOTE 👇
"Take profits based on your own style! You can scale out partials on the way up or wait for the full target. The market gives, the market takes – manage your profits according to your own plan!"
🔍 RELATED PAIRS TO WATCH & KEY CORRELATIONS
Understanding the context is key! Here are related instruments to keep on your radar:
AUD/JPY: The "Aussie" and "Kiwi" are often correlated due to their similar economies (commodity-based). A strong NZD/JPY move is often mirrored here.
AUD/NZD: Watch this for relative strength. If NZD is strengthening, this pair should move down.
NZD/USD ( OANDA:NZDUSD ): The direct Kiwi-Dollar pair. A strong NZD here will likely fuel strength in NZD/JPY.
USD/JPY ( FX:USDJPY ): This is critical! JPY pairs are heavily influenced by U.S. Treasury yields. A rising USD/JPY (meaning a weaker Yen) will provide a strong tailwind for this NZD/JPY long trade.
✅ Summary:
Strategy: "Thief" Layered Entries
Setup: TMA Breakout + MA Bounce
Risk: Defined & Managed
Target: Logical Resistance Zone
If you found this idea helpful, don't forget to smash that LIKE button and leave a comment! ✅ Your support helps with visibility. Let's get this bread! 🍞
Disclaimer: This is my personal trade idea, not financial advice. Trade at your own risk.
