#NZDUSD: Final Drop Before Swing Bullish ReversalThe NZDUSD has dropped significantly in recent months without any proper bullish correction. Currently, the price is approaching a key level from which we believe it could finally reverse. However, as this is a swing setup, it might take months to complete. We wish you the best in trading and stay careful tomorrow.
Good luck,
Team Setupsfx_
Nzdusdbuy

NZD/USD Trend Shift Confirmed | Pullback → Reversal Setup📈 NZD/USD – “THE KIWI”
Forex Market Trade Opportunity Guide (Swing / Day Trade)
🧠 Market Bias
BULLISH 🟢
Bullish plan confirmed with:
🔺 Triangular Moving Average pullback
🕯️ Heikin Ashi Doji candle → momentum pause + reversal signal
🔄 Trend structure shift indicating buyers stepping in
This combination signals controlled accumulation, not emotional chasing.
🎯 Entry Strategy
Entry: Any price level
➡️ PLEASE NOTE: Thief Using Layer (or) Any Price Level Entry
🔹 Layering Strategy (Multiple Buy Limits):
📍 0.57400
📍 0.57500
📍 0.57600
📍 0.57700
➡️ You may increase or adjust layers based on your own risk management.
📌 Why layering?
It reduces emotional entries, improves average price, and aligns with institutional-style execution.
🛑 Stop Loss
Thief SL: 0.57300
⚠️ Dear Ladies & Gentlemen (Thief OG’s),
Adjust your SL according to your own strategy, capital, and risk profile.
📎 This SL is a reference, not a recommendation.
🎯 Target / Exit Logic
Target: 0.58500
🚔 Moving Average acts as a “Police Barricade”
Strong dynamic resistance
Overbought conditions likely
Potential bull trap + corrective reaction
➡️ Kindly escape with profits near resistance zones.
⚠️ Dear Ladies & Gentlemen (Thief OG’s),
I am not recommending using only my TP.
Profit-taking is your responsibility.
🔗 RELATED PAIRS TO WATCH (Correlation Insight)
💵 USD-Related
TVC:DXY (US Dollar Index):
⬇️ Weak DXY = ⬆️ NZD/USD bullish continuation
$EUR/USD:
Strength here often confirms USD weakness
$AUD/USD:
Strong positive correlation with NZD (commodity-linked currencies)
🧾 Commodity Link
$XAU/USD (Gold):
Risk-on flows into commodities often support NZD strength
📌 If AUD/USD and EUR/USD stay bid while DXY weakens, NZD/USD bullish bias strengthens.
🌍 ECONOMIC FACTORS TO CONSIDER BEFORE ENTRY
🇳🇿 New Zealand (NZD Drivers)
📊 RBNZ Interest Rate Decisions
📉 Inflation (CPI) trends
🥛 Dairy prices & export demand
🇨🇳 China growth data (key NZ trade partner)
🇺🇸 United States (USD Drivers)
🏦 Federal Reserve policy outlook
📈 CPI / Core PCE inflation data
👷 NFP & unemployment data
📉 Bond yields & risk sentiment
🌐 Macro Environment
Risk-ON → NZD strengthens
Risk-OFF → USD demand increases
📌 Always align technical bias with macro flow.
✅ Final Notes
✔️ Technical confirmation present
✔️ Structured risk via layering
✔️ Macro alignment improves probability
❌ No emotional entries
❌ No blind TP/SL copying
💬 If this setup aligns with your view, support with a LIKE ❤️ and SHARE your thoughts below.
📌 Trade smart. Trade disciplined. Let price do the talking.

NZDUSD - buy nowNZDUSD was in a recent downtrend for the last few weeks and was struggling to stay bullish, but recently it has just broken a strong resistance trend line which it tested several times and failed to break through. NZDUSD is very likely to hit the next major resistance zone which is market as the "TAKE PROFIT" LEVEL. There are many clear signs of new bullish movements. BUY NZDUSD now

Growth is gaining momentum: an upward wave in developmentIn its current phase, USDJPY is showing signs of gradual strengthening. After a period of consolidation, the upward movement is becoming more pronounced, and the wave structure points to the formation of a bullish scenario. Buyers maintain the initiative, limiting the depth of pullbacks.
The chart shows that the price is consolidating above local support zones, while the sequence of waves is taking on a clearer upward character. This dynamic creates the foundation for a new impulse and confirms interest in continued growth.
The fundamental backdrop also favors strengthening: demand for the dollar remains supported by expectations of a dovish Bank of Japan policy, which reinforces buyer positions and sustains upward movement.
As a result, the pair remains in a recovery phase, where the market’s next steps may confirm the formation of a sustainable bullish trend.

Is NZD/USD Ready for a Bullish Drive? WMA Breakout Validated🎯 EUR/USD "THE FIBRE" BREAKOUT SETUP | Multi-Layer Entry Strategy 📊
📈 MARKET ANALYSIS | EUR/USD SWING/DAY TRADE
Asset: EUR/USD (The Fibre)
Bias: BULLISH ✅
Setup: Triangular Moving Average Breakout + Retest Confirmed
Strategy Type: Swing/Day Trade | Multi-Layer Entry (Thief Method)
🎯 TRADE PLAN BREAKDOWN
Entry Strategy: "THIEF LAYERING METHOD" 💰
This strategy uses multiple limit orders to scale into position:
📍 Multi-Layer Buy Limit Entries:
Layer 1: 1.16400
Layer 2: 1.16600
Layer 3: 1.16800
Note: You can add more layers based on your capital allocation and risk tolerance
🛑 Stop Loss:
Thief SL: 1.16200
⚠️ Adjust based on YOUR strategy and risk management plan
🎯 Take Profit Target:
Primary TP: 1.17600 (Strong resistance + potential overbought zone)
💡 Exit Strategy: Watch for trap patterns near resistance—secure profits wisely!
⚡ KEY TECHNICAL LEVELS
Entry Zone: 1.16400-1.16800 (Multi-layer accumulation)
Stop Loss: 1.16200 (Risk management level)
Target: 1.17600 (Resistance + overbought zone)
🔗 RELATED PAIRS TO WATCH (USD CORRELATION)
Monitor these pairs for confirmation and correlation analysis:
Direct USD Pairs:
GBP/USD (Cable) 📉 - Positive correlation with EUR/USD approximately 70-80%. When Cable moves higher, it typically confirms USD weakness across the board and supports EUR/USD bullish momentum.
USD/JPY 📊 - Inverse correlation, acts as a USD strength indicator. If USD/JPY drops below 150.00, it signals USD selling pressure which benefits EUR/USD longs.
USD/CHF 🇨🇭 - Inverse correlation, serves as a risk-off sentiment gauge. When USD/CHF falls, it indicates USD weakness and supports EUR/USD upside.
EUR Cross Pairs:
EUR/GBP 🇪🇺🇬🇧 - Measures EUR strength versus GBP. Rising EUR/GBP shows Euro outperformance and confirms EUR/USD bullish bias.
EUR/JPY 📈 - Risk appetite indicator. When EUR/JPY climbs, it signals risk-on sentiment which typically supports EUR/USD gains.
EUR/CHF - Euro zone stability measure. Stable or rising EUR/CHF indicates confidence in the Eurozone economy.
💡 Correlation Key Points:
USD Index (DXY) - Watch for weakness below 106.00 for EUR/USD bullish continuation. A breaking DXY confirms broad USD selling.
GBP/USD alignment - If Cable breaks higher simultaneously, this confirms USD weakness is widespread, not just EUR strength.
USD/JPY divergence - A drop below 150.00 signals significant USD selling pressure across all pairs.
Risk Sentiment - EUR/JPY rising equals risk-on environment which generally supports EUR/USD bullish moves.
⚠️ RISK DISCLAIMER
Dear Traders (OG Thief Gang),
This is NOT financial advice—educational analysis only
ADJUST YOUR SL/TP based on YOUR risk tolerance
Money management is YOUR responsibility
Take profits at YOUR comfort zone
Never risk more than you can afford to lose
Markets can be unpredictable—trade smart! 🧠
📊 WHY THIS SETUP WORKS
✅ Triangular MA breakout confirmed
✅ Retest of breakout level completed
✅ Multi-layer entry reduces timing risk
✅ Clear risk/reward ratio defined
✅ Correlation analysis supports directional bias
📌 Remember: The market rewards patience and discipline. Trade your plan, not your emotions! 🎯💪

NZDUSD: Bullish Push to 0.593?FX:NZDUSD is eyeing a bullish rebound on the daily chart , with price approaching a key support zone near cumulative sell liquidation, converging with downward short-term and long-term trendlines that could spark upside momentum if buyers defend the level amid recent consolidation. This setup hints at a reversal opportunity after the downtrend, targeting higher levels with strong risk-reward.🔥
Entry between 0.56060–0.56780 for a long position (entry at current levels with proper risk management is recommended). Target at 0.59300 . Set a stop loss at a close below 0.55680 , yielding a risk-reward ratio of approximately 1:2.5 . Monitor for confirmation via a bullish candle close above entry with rising volume, leveraging the pair's potential recovery post-pullback.🌟
Fundamentally , NZDUSD is holding near 0.5723 as of November 28, 2025, after surging to 0.5715 following the RBNZ's 25 bps rate cut to 2.25% on November 27, with signals of no further easing ahead amid resilient labor markets and inflation concerns. The pair has risen about 2.65% since late last week from a low of 0.55910 on November 20, driven by renewed NZD strength and rising US rate cut bets that could weaken the USD further, though forecasts suggest testing support near 0.5675 with volatility persisting due to diverging central bank policies. 💡
📝 Trade Setup
🎯 Entry (Long):
0.56060 – 0.56780
🎯 Target:
• 0.59300
❌ Stop Loss:
• Daily close below 0.55680
⚖️ Risk-to-Reward:
• ~1:2.5 overall
👇 Share your thoughts below! 👇

NZD/USD Price Outlook – Trade Setup📊 Technical Structure
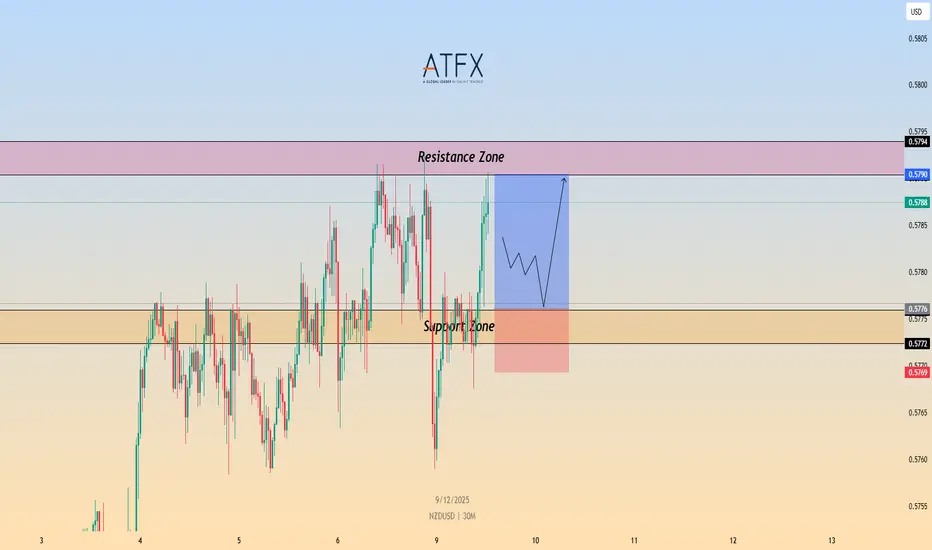
OANDA:NZDUSD NZD/USD is trading slightly softer around 0.5775, holding above the 0.5772–0.5776 support zone while repeatedly failing to sustain a break above the 0.5790–0.5794 resistance area. The pair remains range-bound ahead of major US employment data and the FOMC rate decision, with price action showing a tightening consolidation pattern.
As long as NZD/USD holds above the support band, dips may continue to attract buyers for another attempt toward the resistance zone. A clean break below 0.5769 would invalidate the bullish scenario and expose deeper downside. Conversely, a breakout above 0.5794 could trigger short-covering momentum toward higher levels.
🎯 Trade Setup
Idea: Buy dips near support and target a retest of the resistance zone.
Entry: 0.5772 – 0.5776
Stop Loss: 0.5769
Take Profit 1: 0.5790
Take Profit 2: 0.5794
Risk–Reward Ratio: ~1 : 2.12
Bullish bias remains valid as long as price holds above 0.5772–0.5776 A 30M/1H close below 0.5769 invalidates the setup.
🌐 Macro Background
Markets expect the Fed to cut rates by 25 bps on Wednesday, but traders fear a hawkish cut — meaning the Fed cuts once but signals fewer cuts ahead. This supports the USD in the short term, weighing on NZD/USD.
China, New Zealand’s largest trading partner, posted its largest trade surplus since June, reflecting stronger export performance. A strong China surplus is generally positive for the Kiwi, but this effect is being overshadowed by Fed-related USD strength.
Later today, traders will focus on the delayed US ADP four-week average and JOLTS job openings data. Stronger-than-expected numbers could further support the USD, while softer data may help NZD/USD stabilize near support.
🔑 Key Technical Levels
Resistance Zone: 0.5790 – 0.5794
Support Zone: 0.5776 – 0.5772
Invalidation Level: 0.5769 (30M/1H close below)
📌 Trade Summary
NZD/USD is consolidating below 0.5800 as markets await US employment data and the Fed decision. The technical structure supports buying dips into the support zone, targeting a move toward 0.5790–0.5794. A break below 0.5769 invalidates the bullish setup and suggests a shift in momentum.
⚠️ Disclaimer
This analysis is for reference only and does not constitute trading advice. Trading involves significant risk, and proper risk management is essential.
NZD/USD Price Outlook – Trade Setup📊 Technical Structure
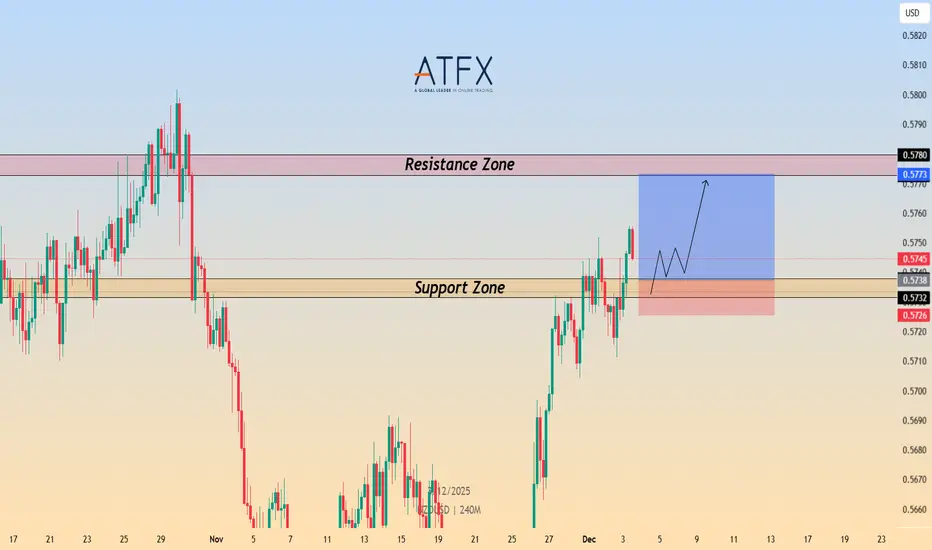
OANDA:NZDUSD NZD/USD holds firm above the 0.5738–0.5732 Support Zone, maintaining its short-term bullish structure. The pair has rebounded strongly from support and is now pressing toward the 0.5773–0.5780 Resistance Zone.
Price action shows a constructive sequence of higher lows on the 4H chart, indicating buyers are defending dips. As long as NZD/USD stays above 0.5732, the bullish outlook remains valid. A clean break above 0.5773 could open a move toward 0.5800+.
A 4H close below 0.5726 would invalidate the bullish structure.
🎯 Trade Setup
Idea: Buy dips toward support, targeting continuation toward resistance.
Entry: 0.5738 – 0.5732
Stop Loss: 0.5726
Take Profit 1: 0.5773
Take Profit 2: 0.5780
Risk–Reward Ratio: ≈ 1 : 3
Bias remains bullish above 0.5738–0.5732
🌐 Macro Background
NZD/USD rises toward 0.5750 as upbeat Chinese Services PMI data boosts risk sentiment. China remains New Zealand’s largest trading partner, making the Kiwi highly sensitive to Chinese economic performance. The November Services PMI beat expectations at 52.1, supporting NZD demand.
The Reserve Bank of New Zealand (RBNZ) delivered a widely expected 25bps rate cut last week but signalled that the easing cycle may be ending. This "less dovish" stance supported NZD on dips.
Meanwhile, US Dollar softness persists as Fed rate-cut expectations strengthen. Markets now price an 89% probability of a December rate reduction. Traders await ADP Employment and ISM Services PMI for further direction.
Overall, stronger Chinese data, a neutral-leaning RBNZ, and dovish Fed expectations favour NZD/USD upside on dips.
🔑 Key Technical Levels
Resistance Zone: 0.5773 – 0.5780
Support Zone: 0.5738 – 0.5732
Bullish Targets: 0.5773 / 0.5780
Invalidation: 4H close below 0.5726
📌 Trade Summary
NZD/USD maintains bullish momentum above the 0.5740 region, supported by upbeat Chinese data and a less-dovish RBNZ stance. With Fed rate-cut expectations weighing on USD, the setup favours buying dips toward support and targeting the 0.5773–0.5780 resistance zone. Structure remains bullish unless price closes below 0.5726.
⚠️ Disclaimer
This analysis is for reference only and does not constitute trading advice. Trading involves significant risk, and proper risk management is essential.
NZDUSD_2025-12-03_15-36-04 1.png
NZD/USD Gave Fake Breakout , Long Setup Valid To Get 200 Pips !Here is my 4H Chart on NZD/USD , We Have A Fake Breakout and then the price Back above my old support and we have a very good bullish Price Action on 2 And 4 Hours T.F Also the price playing very good around my support and i`m waiting the price to retest the broken area and giving a good bullish price action on smaller time frames to can get a confirmation to enter , So i see it`s a good chance to buy this pair if it go down a little to retest the broken area and then we can buy it and targeting 100 to 150 pips . and if we have a daily closure again below my old support then this idea will not be valid anymore .
Reasons To Enter :
1- Perfect Breakout .
2- Clear bullish Price Action .
3- Bigger T.F Giving Good bullish P.A .
4 - Perfect 15 Mins Closure .
5- The Price Respect The support Again .

NZDUSD - Short Term Buy IdeaH1 - Strong bullish move.
Currently it looks like a pullback is happening.
Until the two Fibonacci support zones hold I expect the price to move higher further.
If you enjoy this idea, don’t forget to LIKE 👍, FOLLOW ✅, SHARE 🙌, and COMMENT ✍! Drop your thoughts and charts below to keep the discussion going. Your support helps keep this content free and reach more people! 🚀
----------------------------------------------------------------------------------------------------------------

NZDUSDNZDUSD
- Completed " 12345 " Impulsive Waves and " A " Corrective Waves
- Break of Structure
- RSI - Divergence
- Fibonacci Level - 61.80%
- Fair Value Gap

NZD/USD: Explosion Wave or Kiwi's Last BreathNZD/USD: Explosion Wave or Kiwi's Last Breath
📈 Weekly Scenarios
Bullish scenario: NZD/USD holds the ~0.582-0.588 zone, then breaks upwards through resistance at ~0.598-0.605 → growth to these levels within the impulse wave.
Consolidation: The price may hang between ~0.588 and ~0.605, forming an accumulation zone until the next move.
Bearish scenario: A downward breakout below ~0.582 with volume → possible decline to ~0.560-0.554 within the correction wave.
✅ Conclusion
NZD/USD is at an important decision point: either a strong upward impulse starts, or a corrective wave reverses.
Key levels—0.582-0.588 (support) and 0.598-0.605 (resistance)—will determine the future path.
The wave structure currently allows for both scenarios; it's important to wait for confirmation through price reaction at the indicated levels.

NZD/USD Breakout Done , Long Setup Valid To Get 150 Pips !Here is my 4H Chart on NZD /USD , We Have A Fake Breakout and then the price Back Above my old Support and we have a very good Bullish Price Action on 1 And 2 And 4 Hours T.F Also the price playing very good around my Support and i entered a buy trade after 4H Closure And i`m waiting the price to retest the broken area to can get a confirmation to Add another entry , So i see it`s a good chance to Buy this pair if it go Down a little to retest the broken area and then we can Buy it and targeting 100 to 150 pips . and if we have a daily closure again Below my Support then this idea will not be valid anymore .
Reasons To Enter :
1- Perfect Breakout .
2- Clear Bullish Price Action .
3- Bigger T.F Giving Good Bullish P.A .
4 - Perfect 4H Closure .
5- The Price Respect The Support Again .

NZDUSD Bullish Rebound!
HI,Traders !
#NZDUSD made a retest of
The falling support line
While trading in a local
Uptrend and we are already
Seeing a bullish reaction
So we are locally bullish
Biased and we will be
Expecting a further move up !
Comment and subscribe to help us grow !

NZDUSD Long From Support!
HI,Traders !
#NZDUSD fell down again
But a strong horizontal
Support level is close by
At 0.59191 so after the
Pair retests the support
we will be Expecting a local
Bullish correction !
Comment and subscribe to help us grow !

Ready to Rob the Kiwi? NZD/USD Bullish Breakout Plan🥝💚 NZD/USD Bullish Breakout Heist Plan 🟢💰 (Thief Trader Style)
🎭 Robbery Mission Activated – Code: Kiwi Uprising 💣📈
💥 Asset: NZD/USD
📍 Entry: 0.59400 (Breakout confirmed – the vault door’s open!)
🔐 Stop Loss: 0.58300 (Thief exit point – avoid the trap zone)
🎯 Target: 0.60500 (Cash-out point – grab the bags and vanish!)
🧠 Strategy: Layered Limit Orders a.k.a “Precision DCA Infiltration”
🧤 The Thief Trader is sneaking into the forex vaults once again — this time with eyes locked on Kiwi (NZD/USD). The bulls are loading up, and the breakout zone is showing green flags 🟢 — time to strike hard and clean 💰
🔥 Operation Details:
We’re stacking multiple limit orders like a pro thief would place decoys – distraction + precision = execution! Entry at 0.59400 is our main gate breach. Orders set in layers to trap liquidity zones below.
🚨 Stop Loss @ 0.58300 – tight enough to avoid getting caught, but wide enough to dodge fake traps.
🏆 Target: 0.60500 – that’s where the loot vault is sitting. Clean exit once we’re loaded with profits!
👀 Swingers & Scalpers Alert!
Only look LONG – no short robbing here!
🔁 Use trailing SL once in profit – protect your gold like a pro.
💡If cash is low – no panic, join the swing gang and glide in with patience & alerts. Smart robbers wait 🧠💼
📣 News Risk ⚠️
Avoid jumping during major news blast-offs.
Lock profits with trailing SL.
No panic entries — only sniper moves.🕵️♂️💥
❤️ Smash That BOOST Button 💥💪
Support the squad! More boosts = more heist plans, more clean money from the market streets 🚀📈
🎭 Stay sharp, rob smart — see you in the next plan, robbers 🤑🐱👤🎯
~ Thief Trader

LONG ON NZD/USDNZD/USD is at a major demand level.
Dollar is bearish. Economic News this afternoon should assist and pushing this pair up.
Looking to catch 200 pips to the previous high.

NZDUSD Massive Bullish Breakout!
HI,Traders !
#NZDUSD is trading in a strong
Uptrend and the price just
Made a massive bullish
Breakout of the falling
Resistance line and the
Breakout is confirmed
So after a potential pullback
We will be expecting a
Further bullish continuation !
Comment and subscribe to help us grow !

Nzdusd sell to buy narrativeNzdusd has been responding positively after CPi data and we can see price reacting to close imbalance caused by Trump-powell power tussle.
We expect more bullish move in the future.

NZDUSDMarket structure suggests is preparing for its next move. The level will likely play a critical role in the upcoming direction.
If structure breaks and confirms the shift, a new bias might form after the retest.

NZD/CHF Potential Bullish Reversal SetupNZD/CHF Potential Bullish Reversal Setup 🔄📈
📊 Chart Analysis:
The chart shows a potential bullish reversal for NZD/CHF, supported by technical patterns and key levels:
🧠 Key Technical Highlights:
🔹 Double Bottom Formation (🟠 Circles)
A clear double bottom pattern can be seen around the 0.48300 support zone, signaling potential reversal from the downtrend.
🔹 Strong Support Zone 📉
Price bounced from a historically respected support zone (~0.48200–0.48400), which held several times in the past (marked with green arrows).
🔹 Downtrend Breakout 🔺
A short-term bearish channel has been broken to the upside, indicating potential bullish pressure.
🔹 Target Zone 🎯
Immediate bullish target is around 0.49265, aligning with previous resistance.
🔹 Resistance Area (🔵 Boxes)
Next significant resistance lies at 0.49400–0.49800, which may act as the next hurdle if price breaks the 0.49265 level.
✅ Conclusion:
As long as price holds above 0.48400, bulls may aim for the 0.49265 🎯 target. A breakout above that level can open the path to higher resistances.
📌 Bullish Bias maintained above support zone — monitor for volume confirmation and retest strength.

nzdusd sell signal. Don't forget about stop-loss.
Write in the comments all your questions and instruments analysis of which you want to see.
Friends, push the like button, write a comment, and share with your mates - that would be the best THANK YOU.
P.S. I personally will open entry if the price will show it according to my strategy.
Always make your analysis before a trade

NZDUSD Range Tightens – Breakout Setup BuildingNZDUSD continues to coil within a contracting triangle, forming a symmetrical wedge bounded by lower highs and higher lows. Price is approaching the resistance zone near 0.6028, with visible indecision and rejection wicks, signaling potential for either breakout or rejection.
Key Levels:
Resistance: 0.6028 (structural ceiling, key pivot)
Support: ~0.5800 (ascending support line of wedge)
Breakout Target (Bullish): 0.6150–0.6200
Breakdown Target (Bearish): 0.5650–0.5550
Scenarios to Watch:
🔹 Bearish Rejection
Price rejects off 0.6028 and returns inside range
Watch for momentum drop and move toward wedge base (0.5800)
Clean breakdown opens path toward April lows (~0.5509)
🔹 Bullish Breakout
Break and hold above 0.6028
Confirmation on 4H close + retest
Opens room for bullish extension toward 0.6150+
Outlook:
Price is nearing apex compression, suggesting breakout is imminent.
Bias is neutral until price breaks out of the current wedge structure.
Expect volatility spike around the 0.6028 test.
