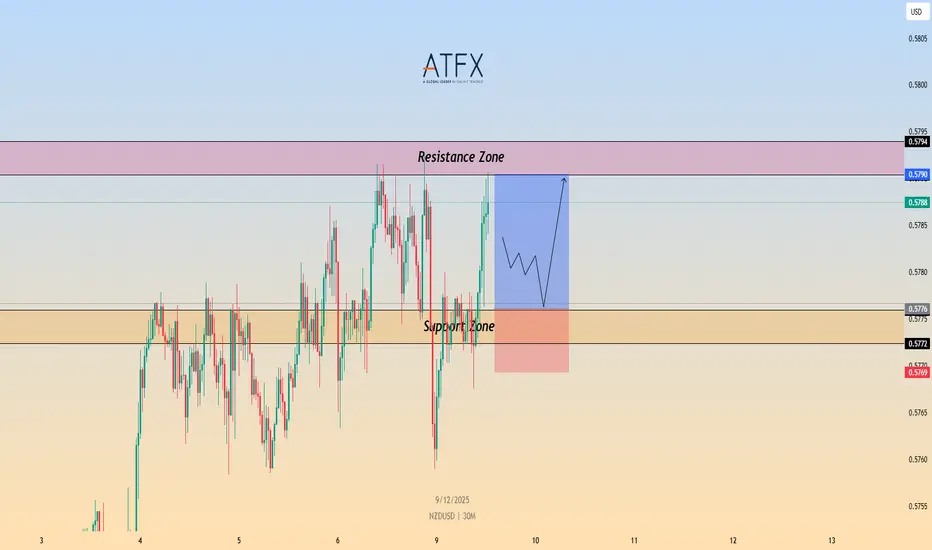
NZD/USD Price Outlook – Trade Setup📊 Technical Structure
OANDA:NZDUSD NZD/USD is trading slightly softer around 0.5775, holding above the 0.5772–0.5776 support zone while repeatedly failing to sustain a break above the 0.5790–0.5794 resistance area. The pair remains range-bound ahead of major US employment data and the FOMC rate decision, with price action showing a tightening consolidation pattern.
As long as NZD/USD holds above the support band, dips may continue to attract buyers for another attempt toward the resistance zone. A clean break below 0.5769 would invalidate the bullish scenario and expose deeper downside. Conversely, a breakout above 0.5794 could trigger short-covering momentum toward higher levels.
🎯 Trade Setup
Idea: Buy dips near support and target a retest of the resistance zone.
Entry: 0.5772 – 0.5776
Stop Loss: 0.5769
Take Profit 1: 0.5790
Take Profit 2: 0.5794
Risk–Reward Ratio: ~1 : 2.12
Bullish bias remains valid as long as price holds above 0.5772–0.5776 A 30M/1H close below 0.5769 invalidates the setup.
🌐 Macro Background
Markets expect the Fed to cut rates by 25 bps on Wednesday, but traders fear a hawkish cut — meaning the Fed cuts once but signals fewer cuts ahead. This supports the USD in the short term, weighing on NZD/USD.
China, New Zealand’s largest trading partner, posted its largest trade surplus since June, reflecting stronger export performance. A strong China surplus is generally positive for the Kiwi, but this effect is being overshadowed by Fed-related USD strength.
Later today, traders will focus on the delayed US ADP four-week average and JOLTS job openings data. Stronger-than-expected numbers could further support the USD, while softer data may help NZD/USD stabilize near support.
🔑 Key Technical Levels
Resistance Zone: 0.5790 – 0.5794
Support Zone: 0.5776 – 0.5772
Invalidation Level: 0.5769 (30M/1H close below)
📌 Trade Summary
NZD/USD is consolidating below 0.5800 as markets await US employment data and the Fed decision. The technical structure supports buying dips into the support zone, targeting a move toward 0.5790–0.5794. A break below 0.5769 invalidates the bullish setup and suggests a shift in momentum.
⚠️ Disclaimer
This analysis is for reference only and does not constitute trading advice. Trading involves significant risk, and proper risk management is essential.
Nzdusdidea
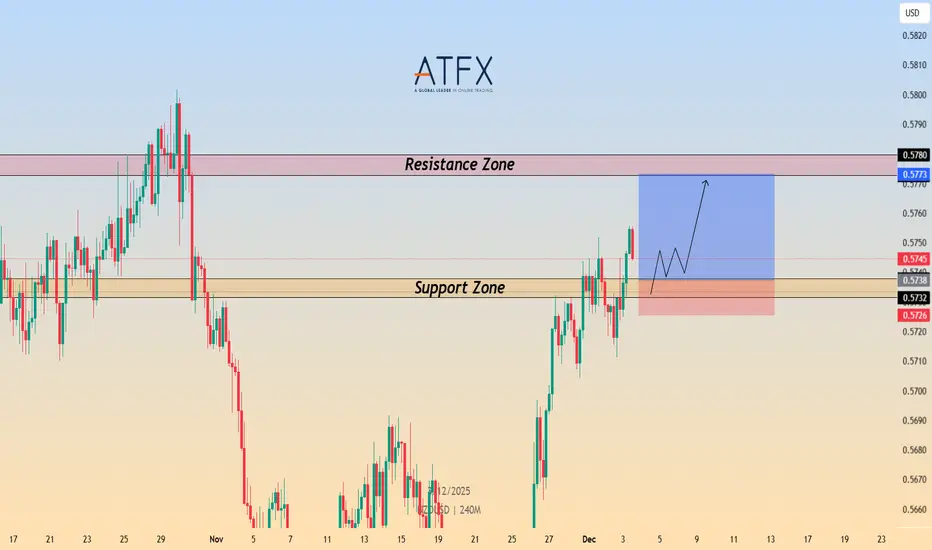
NZD/USD Price Outlook – Trade Setup📊 Technical Structure
OANDA:NZDUSD NZD/USD holds firm above the 0.5738–0.5732 Support Zone, maintaining its short-term bullish structure. The pair has rebounded strongly from support and is now pressing toward the 0.5773–0.5780 Resistance Zone.
Price action shows a constructive sequence of higher lows on the 4H chart, indicating buyers are defending dips. As long as NZD/USD stays above 0.5732, the bullish outlook remains valid. A clean break above 0.5773 could open a move toward 0.5800+.
A 4H close below 0.5726 would invalidate the bullish structure.
🎯 Trade Setup
Idea: Buy dips toward support, targeting continuation toward resistance.
Entry: 0.5738 – 0.5732
Stop Loss: 0.5726
Take Profit 1: 0.5773
Take Profit 2: 0.5780
Risk–Reward Ratio: ≈ 1 : 3
Bias remains bullish above 0.5738–0.5732
🌐 Macro Background
NZD/USD rises toward 0.5750 as upbeat Chinese Services PMI data boosts risk sentiment. China remains New Zealand’s largest trading partner, making the Kiwi highly sensitive to Chinese economic performance. The November Services PMI beat expectations at 52.1, supporting NZD demand.
The Reserve Bank of New Zealand (RBNZ) delivered a widely expected 25bps rate cut last week but signalled that the easing cycle may be ending. This "less dovish" stance supported NZD on dips.
Meanwhile, US Dollar softness persists as Fed rate-cut expectations strengthen. Markets now price an 89% probability of a December rate reduction. Traders await ADP Employment and ISM Services PMI for further direction.
Overall, stronger Chinese data, a neutral-leaning RBNZ, and dovish Fed expectations favour NZD/USD upside on dips.
🔑 Key Technical Levels
Resistance Zone: 0.5773 – 0.5780
Support Zone: 0.5738 – 0.5732
Bullish Targets: 0.5773 / 0.5780
Invalidation: 4H close below 0.5726
📌 Trade Summary
NZD/USD maintains bullish momentum above the 0.5740 region, supported by upbeat Chinese data and a less-dovish RBNZ stance. With Fed rate-cut expectations weighing on USD, the setup favours buying dips toward support and targeting the 0.5773–0.5780 resistance zone. Structure remains bullish unless price closes below 0.5726.
⚠️ Disclaimer
This analysis is for reference only and does not constitute trading advice. Trading involves significant risk, and proper risk management is essential.
NZDUSD_2025-12-03_15-36-04 1.png
NZD/USD Gave Fake Breakout , Long Setup Valid To Get 200 Pips !Here is my 4H Chart on NZD/USD , We Have A Fake Breakout and then the price Back above my old support and we have a very good bullish Price Action on 2 And 4 Hours T.F Also the price playing very good around my support and i`m waiting the price to retest the broken area and giving a good bullish price action on smaller time frames to can get a confirmation to enter , So i see it`s a good chance to buy this pair if it go down a little to retest the broken area and then we can buy it and targeting 100 to 150 pips . and if we have a daily closure again below my old support then this idea will not be valid anymore .
Reasons To Enter :
1- Perfect Breakout .
2- Clear bullish Price Action .
3- Bigger T.F Giving Good bullish P.A .
4 - Perfect 15 Mins Closure .
5- The Price Respect The support Again .

NZDUSD - Short Term Buy IdeaH1 - Strong bullish move.
Currently it looks like a pullback is happening.
Until the two Fibonacci support zones hold I expect the price to move higher further.
If you enjoy this idea, don’t forget to LIKE 👍, FOLLOW ✅, SHARE 🙌, and COMMENT ✍! Drop your thoughts and charts below to keep the discussion going. Your support helps keep this content free and reach more people! 🚀
----------------------------------------------------------------------------------------------------------------

NZD/USD Price Outlook – Trade Setup📊 Technical Structure
FOREXCOM:NZDUSD NZD/USD is consolidating just below the 0.5600 handle after rebounding from multi-month lows near 0.5570. The broader structure remains bearish, with a clear sequence of lower highs and lower lows on the 4H chart.
Price is trading beneath the highlighted Resistance Zone at 0.5635–0.5642, while the Support Zone sits at 0.5577–0.5584. Recent candles show waning downside momentum (longer lower wicks, smaller bodies), hinting at short-term exhaustion, but the downtrend stays intact as long as price holds below the resistance band.
From a structural point of view, rallies into 0.5635–0.5642 are still viewed as areas where sellers may re-enter, targeting a retest of the 0.5584 region.
🎯 Trade Setup
Idea: Sell into resistance in line with the prevailing downtrend.
Entry: 0.5635 – 0.5642 (near Resistance Zone)
Stop Loss: 0.5651 (above resistance & recent swing high)
Take Profit 1: 0.5584 (top of Support Zone)
Take Profit 2: 0.5577 (support lows / extension target)
Risk–Reward Ratio: ≈ 1: : 3.07
Bias: Short-term bearish while NZD/USD trades below 0.5650. A 4H close above this level would invalidate the setup and suggest deeper correction toward 0.5700.
🌐 Macro Background
According to FXStreet’s latest commentary, NZD/USD is struggling to sustain moves above 0.5600, having fallen roughly 9% in less than four months as markets price in a dovish Reserve Bank of New Zealand (RBNZ) stance. Expectations are building for a 25 bps rate cut at Wednesday’s meeting, and the focus is now on the monetary policy statement for clues on further easing into 2026.
RBNZ side:
Markets widely expect one cut this week, with risks tilted toward a dovish message (more easing later if growth and inflation soften).
These expectations are acting as a headwind for the Kiwi, limiting any meaningful rebound despite oversold technical conditions.
USD side:
The US Dollar remains underpinned by reduced confidence in a December Fed rate cut, though upside is capped by upcoming heavy data (PCE, GDP, confidence).
Any stronger-than-expected US data would support the USD, reinforcing NZD/USD downside; softer data could trigger short-term squeezes higher but not necessarily a trend reversal unless the Fed narrative shifts clearly more dovish.
Overall, fundamentals still favour selling NZD on rallies, but the short-term oversold backdrop explains why price is hesitating under 0.5600 rather than collapsing straight to new lows.
🔑 Key Technical Levels
Resistance Zone: 0.5635 – 0.5642
Support Zone: 0.5577 – 0.5584
Intermediate Level: 0.5600 (psychological pivot)
Invalidation (bearish view): Sustained 4H close above 0.5650
📌 Trade Summary
NZD/USD remains in a downtrend, with 0.5635–0.5642 acting as a key supply area. The plan favours selling rallies into resistance, targeting a retest of 0.5584–0.5577, in line with RBNZ-driven Kiwi weakness and a still-supported USD.
Only a clear break above 0.5651 would suggest that bears are losing control and that a broader corrective recovery toward 0.5700 may be underway.
⚠️ Disclaimer
This analysis is for reference only and does not constitute trading advice. Trading involves significant risk, and proper risk management is essential.

NZDUSD idea 12.11.2025For nzdusd I have the following scenario: sfp above the nearest high for a short at a price around 0.581 where the daily level and fibo 0.5 are nearby. for a possible long, I would like sfp below the low because it would mean a drop to the level of 0.552 where, among other things, the monthly level is also located, which will be essential.

#NZDUSD:DXY Gaining Its Strength Back, Is it end for the Bulls? The OANDA:NZDUSD DXY index shows a change in price character and momentum, indicating a possible price reversal for the shorter term. This aligns with our fundamental analysis, as there’s a likelihood of a China-US trade deal that could significantly influence the demand for the DXY.
There are two possible selling entries, allowing you to choose between a riskier or safer approach. Alongside these entries, we’ve set targets accordingly to your chosen entry.
Good luck and trade safely!
Thank you for your unwavering support! 😊
If you’d like to contribute, here are a few ways you can help us:
- Like our ideas
- Comment on our ideas
- Share our ideas
Team Setupsfx_
❤️🚀

NZDUSD - m30 : Possible 1:2 RR Sell OpportunityBased on the liquidity zones and the weakening momentum on the 1H and 30M timeframes, price may go for a short-term downside move to grab lower liquidity before resuming the main trend.

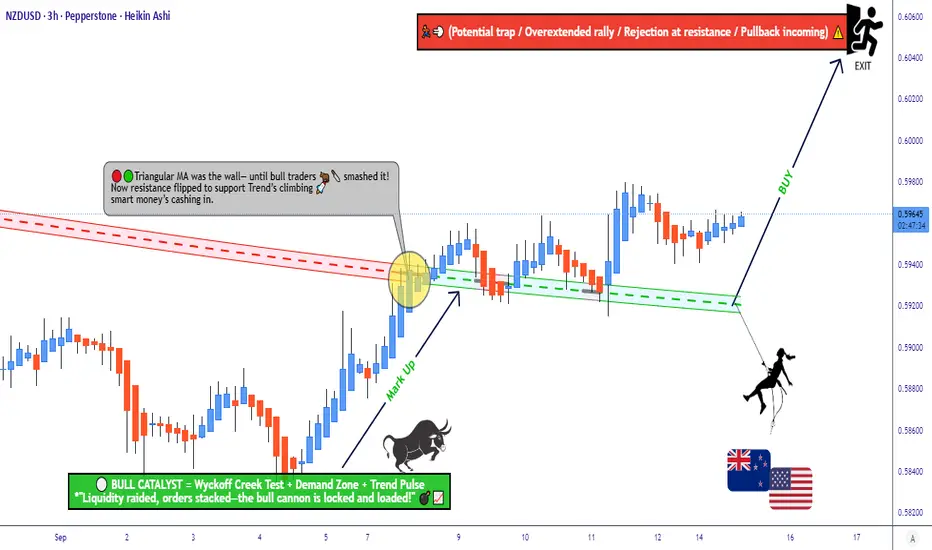
NZD/USD Technical Setup – Demand Retest + Bullish Structure📈 NZD/USD "THE KIWI" Forex Money Looting Plan (Swing/Day Trade) 🥝💵
🛠️ Plan Overview
Bias: Bullish ✅
Reasoning: Demand Re-Test + Wyckoff Accumulation Phase (buyers confirmed their presence).
🎯 Entry Strategy (Thief Layer Style)
Our Thief Strategy = layered limit orders 🔑
Example buy layers:
0.59200
0.59300
0.59400
0.59500
(You can expand layers based on your risk appetite & market liquidity 📊).
⚡ This layered entry approach helps capture price dips while managing risk — OG Thief style!
🛡️ Stop Loss
Suggested SL: 0.59000 (below breakout structure).
⚠️ Note: Dear Ladies & Gentlemen (Thief OG’s), this SL is not a hard rule. Adjust it to match your own strategy & risk management.
🎯 Take Profit
Target zone: 0.60400 (strong resistance area).
Rationale: Price approaching overbought conditions + potential trap zone.
⚠️ Note: Exit is flexible — take profits on your own terms and protect your gains.
🔗 Related Pairs to Watch (Correlation Radar)
OANDA:AUDUSD → Highly correlated (both AUD & NZD are commodity currencies 📦).
OANDA:NZDJPY → Tracks Kiwi strength vs safe-haven flows 💴.
TVC:DXY (US Dollar Index) → Inverse correlation driver 💵.
OANDA:GBPNZD → Cross-check for Kiwi strength in broader FX spectrum.
Watching these helps confirm if Kiwi momentum is real or just a false breakout!
✨ “If you find value in my analysis, a 👍 and 🚀 boost is much appreciated — it helps me share more setups with the community!”
#NZDUSD #Forex #Kiwi #SwingTrade #DayTrade #Wyckoff #FXTrading #TradingPlan #LayeringStrategy #AUDUSD #DXY
NZDUSD - Looking To Sell Pullbacks In The Short TermH4 - Strong bearish move.
No opposite signs.
Currently it looks like a pullback is happening.
Expecting bearish continuation until the two Fibonacci resistance zones hold.
If you enjoy this idea, don’t forget to LIKE 👍, FOLLOW ✅, SHARE 🙌, and COMMENT ✍! Drop your thoughts and charts below to keep the discussion going. Your support helps keep this content free and reach more people! 🚀
-------------------------------------------------------------------------------------------------------------------

NZD/USD Breakout Done , Long Setup Valid To Get 150 Pips !Here is my 4H Chart on NZD /USD , We Have A Fake Breakout and then the price Back Above my old Support and we have a very good Bullish Price Action on 1 And 2 And 4 Hours T.F Also the price playing very good around my Support and i entered a buy trade after 4H Closure And i`m waiting the price to retest the broken area to can get a confirmation to Add another entry , So i see it`s a good chance to Buy this pair if it go Down a little to retest the broken area and then we can Buy it and targeting 100 to 150 pips . and if we have a daily closure again Below my Support then this idea will not be valid anymore .
Reasons To Enter :
1- Perfect Breakout .
2- Clear Bullish Price Action .
3- Bigger T.F Giving Good Bullish P.A .
4 - Perfect 4H Closure .
5- The Price Respect The Support Again .

NZD/USD The Kiwi Heist Plan – Breakout or Bust?🦘 NZD/USD "The Kiwi" Forex Bank Heist Plan (Swing/Day Trade) 🦘
🎯 MISSION: BEARISH (PENDING ORDER HEIST) 🎯
📍 THE ENTRY PLAN: THE BREAKOUT TRIGGER
⚡ MAIN ENTRY SIGNAL: Wait for the BREAKOUT & CLOSE below 0.58000! This is when the bank vault door gets cracked! ⚡
🧨 THIEF'S LAYERED ENTRY STRATEGY: Don't go all in! We use multiple SELL LIMIT orders to scale in like a pro. After the breakout, set your heist layers at:
1st Layer (Safe Loot): 0.58100
2nd Layer (Main Loot): 0.58200
3rd Layer (Ballsy Loot): 0.58400
🤑 You can add more layers based on your own risk appetite! This is the thief's way (DCA/Layering).
🛑 THE ESCAPE ROUTE: STOP LOSS
👮♂️ THIEF OG's STOP LOSS: Our getaway car is parked at 0.58800. Place your SL ONLY AFTER the 0.58000 breakout is confirmed!
📢 Attention all Thieves & Robbers: Adjust your final SL based on your own risk management, lot size, and how many layers you used! Protect your capital! 👊
💰 THE FINAL TARGET: CASH OUT & ESCAPE
🚨 Police Barricade Ahead! Don't get greedy! The mission is to escape with the stolen money at 0.57000! 🚨
🔊 THIEF'S LOOTING MANUAL (READ THIS!):
🚨 Set a CHART ALERT at 0.58000! Don't miss the heist signal!
📰 NEWS = POLICE PATROLS! Avoid opening new trades during high-impact news. It increases volatility and risk!
🔐 Manage Your Position! This is your key to survival. Use proper risk/reward ratios.
💖 SUPPORT THE HEIST CREW!
💥 SMASH THAT LIKE & BOOST BUTTON! 💥
It fuels our next robbery plan! Let's make stealing money from the market look EASY! 🤑🚀
I'll see you on the next heist, Thief! Stay sharp! 🐱👤🤝

NZDUSD Bullish Rebound!
HI,Traders !
#NZDUSD made a retest of
The falling support line
While trading in a local
Uptrend and we are already
Seeing a bullish reaction
So we are locally bullish
Biased and we will be
Expecting a further move up !
Comment and subscribe to help us grow !

NZDUSD: Bearish. Clean Setup For Potential Sells!Welcome back to the Weekly Forex Forecast for the week of Sept 1 - 5th.
In this video, we will analyze the following FX market: NZDUSD
NZDUSD is currently showing the cleanest setup for the FX pairs.
- it's in a downtrend on the HTFs
- D1 shows the LH. LL, low and the -BOS clearly
- the retracement is contacting a decent -OB
- the Descending Channel is only an added bonus as a confluence for resistance.
I like the probabilities for a potential rejection downward from the -OB.
The caution here is that it would require the USD to show strength, pulling the NZD down. That part is still iffy. The DXY has not shown its hand just yet.... but it will very soon.
Enjoy!
May profits be upon you.
Leave any questions or comments in the comment section.
I appreciate any feedback from my viewers!
Like and/or subscribe if you want more accurate analysis.
Thank you so much!
Disclaimer:
I do not provide personal investment advice and I am not a qualified licensed investment advisor.
All information found here, including any ideas, opinions, views, predictions, forecasts, commentaries, suggestions, expressed or implied herein, are for informational, entertainment or educational purposes only and should not be construed as personal investment advice. While the information provided is believed to be accurate, it may include errors or inaccuracies.
I will not and cannot be held liable for any actions you take as a result of anything you read here.
Conduct your own due diligence, or consult a licensed financial advisor or broker before making any and all investment decisions. Any investments, trades, speculations, or decisions made on the basis of any information found on this channel, expressed or implied herein, are committed at your own risk, financial or otherwise.

NZDUSD Move Down Ahead!
HI,Traders !
#NZDUSD is trading in a
Downtrend below the falling
Resistance line and the pair
Will soon hit the resistance
From where we will be
Expecting a further move down!
Comment and subscribe to help us grow !

NZDUSD LONGI enetered Long position on NZDUSD based on fundamentals and technical analysis.
Entry 0.58337
SL 0.57937
TP: 0.63337

Market Analysis: NZD/USD Starts Recovery, Key Hurdles AheadMarket Analysis: NZD/USD Starts Recovery, Key Hurdles Ahead
NZD/USD is also rising and could aim for a move above 0.5900 in the short term.
Important Takeaways for NZD/USD Analysis Today
- NZD/USD is slowly moving higher above 0.5830.
- There is a major bearish trend line forming with resistance at 0.5870 on the hourly chart of NZD/USD.
NZD/USD Technical Analysis
On the hourly chart of NZD/USD, the pair followed AUD/USD. The New Zealand Dollar formed a base above the 0.5800 level and started a recovery wave against the US Dollar.
The pair climbed above the 50-hour simple moving average and 0.5830. There was a close above the 23.6% Fib retracement level of the downward move from the 0.5990 swing high to the 0.5830 low.
However, the bears are now active near the 0.5870 zone and a major bearish trend line. The NZD/USD chart suggests that the RSI is back above 60, signaling a positive bias. On the upside, the pair is facing resistance near 0.5870.
The next major hurdle for buyers could be near the 50% Fib retracement at 0.5895. A clear move above 0.5895 might even push the pair toward 0.5910. Any more gains might clear the path for a move toward the 0.5945 pivot zone in the coming sessions.
On the downside, there is support forming near the 0.5830 zone. If there is a downside break below 0.5830, the pair might slide toward 0.5800. Any more losses could lead NZD/USD into a bearish zone to 0.5740.
This article represents the opinion of the Companies operating under the FXOpen brand only. It is not to be construed as an offer, solicitation, or recommendation with respect to products and services provided by the Companies operating under the FXOpen brand, nor is it to be considered financial advice.

NZDUSD - Looking To Sell Pullbacks In The Short TermH1 - Strong bearish move.
No opposite signs.
Expecting bearish continuation until the two Fibonacci resistance zones hold.
If you enjoy this idea, don’t forget to LIKE 👍, FOLLOW ✅, SHARE 🙌, and COMMENT ✍! Drop your thoughts and charts below to keep the discussion going. Your support helps keep this content free and reach more people! 🚀

NZDUSD Long From Support!
HI,Traders !
#NZDUSD fell down again
But a strong horizontal
Support level is close by
At 0.59191 so after the
Pair retests the support
we will be Expecting a local
Bullish correction !
Comment and subscribe to help us grow !

NZDUSD: Amid 15% Tariffs & Rate Cuts Looming, Time To Sell?Welcome back to the Weekly Forex Forecast for the week of Aug 11 - 15.
In this video, we will analyze the following FX market: NZDUSD
NZDUSD is dealing with new 15% tariffs from the US and signs of a rate cut coming in the next RBNZ meeting. Not to mention price mad a bearish impulsive move, and correcting into a bearish FVG. This would be the perfect premium array for the retracement to end, and the establishment of a lower high, followed by the start of the new bearish leg.
Enjoy!
May profits be upon you.
Leave any questions or comments in the comment section.
I appreciate any feedback from my viewers!
Like and/or subscribe if you want more accurate analysis.
Thank you so much!
Disclaimer:
I do not provide personal investment advice and I am not a qualified licensed investment advisor.
All information found here, including any ideas, opinions, views, predictions, forecasts, commentaries, suggestions, expressed or implied herein, are for informational, entertainment or educational purposes only and should not be construed as personal investment advice. While the information provided is believed to be accurate, it may include errors or inaccuracies.
I will not and cannot be held liable for any actions you take as a result of anything you read here.
Conduct your own due diligence, or consult a licensed financial advisor or broker before making any and all investment decisions. Any investments, trades, speculations, or decisions made on the basis of any information found on this channel, expressed or implied herein, are committed at your own risk, financial or otherwise.

NZD/USD – A Bullish Opportunity You Shouldn't MissNZD/USD is showing a clear bullish structure across multiple timeframes:
Weekly: Overall trend remains bullish.
Daily: Structure flipped bullish on July 23, 2025, confirmed by a strong bullish engulfing candle.
4H: Also aligned bullish, adding further confluence.
We are now anticipating a retest near the previous Daily Higher Low (HL) — likely around a round psychological level. This zone may offer a textbook HL formation and a high-probability long setup.
📍 Potential Trade Plan
Entry: Around 0.6000
Take Profit: 0.6160
Stop Loss: 0.5960
⚠️ This is not financial advice. Please do your own research and analysis before entering any trade. I am not responsible for any potential losses.

NZDUSD Massive Bullish Breakout!
HI,Traders !
#NZDUSD is trading in a strong
Uptrend and the price just
Made a massive bullish
Breakout of the falling
Resistance line and the
Breakout is confirmed
So after a potential pullback
We will be expecting a
Further bullish continuation !
Comment and subscribe to help us grow !

Market Analysis: NZD/USD Climbs as Dollar WeakensMarket Analysis: NZD/USD Climbs as Dollar Weakens
NZD/USD is also rising and might aim for more gains above 0.6000.
Important Takeaways for NZD/USD Analysis Today
- NZD/USD is consolidating gains above the 0.5980 zone.
- There was a break above a major bearish trend line with resistance at 0.5980 on the hourly chart of NZD/USD.
NZD/USD Technical Analysis
On the hourly chart of NZD/USD at FXOpen, the pair started a steady increase from the 0.5910 zone. The New Zealand Dollar broke the 0.5940 resistance to start the recent increase against the US Dollar.
There was a break above a major bearish trend line with resistance at 0.5980. The pair settled above 0.5980 and the 50-hour simple moving average. It tested the 0.6010 zone and is currently consolidating gains.
The NZD/USD chart suggests that the RSI is stable above 60. On the upside, the pair might struggle near 0.6010. The next major resistance is near the 0.6020 level.
A clear move above the 0.6020 level might even push the pair toward the 0.6050 level. Any more gains might clear the path for a move toward the 0.6120 resistance zone in the coming days.
On the downside, immediate support is near the 0.5990 level. It is close to the 23.6% Fib retracement level of the upward move from the 0.5941 swing low to the 0.6008 high.
The first key support is near the 0.5975 level. It is close to the 50% Fib retracement level. The next major support is near the 0.5940 level. If there is a downside break below the 0.5940 support, the pair might slide toward 0.5910. Any more losses could lead NZD/USD in a bearish zone to 0.5850.
This article represents the opinion of the Companies operating under the FXOpen brand only. It is not to be construed as an offer, solicitation, or recommendation with respect to products and services provided by the Companies operating under the FXOpen brand, nor is it to be considered financial advice.
