Super set of oscillators by Thomas DeMark!Dear friends!
I continue describing oscillators developed by Thomas DeMark.
In my previous articles, I have already explained such tools as
TD REI and TD POQ (look here ).
In this post I’ll continue describing technical tools developed by Thomas DeMark.
TD DeMarker I
I’d like to start with the TD DeMarker I indicator. It is similar to TD REI and aims to distinguish between trend and non-trend movements in the market, and then, having determined the trend, it searches for reversal points depending on how the indicator reacts to oversold and overbought levels.
Its calculation technique is very simple. TD DeMarker I compares the current and the previous trading day’s highs according to the following algorithm:
1. Calculate the TD DeMarker I numerator
• If the current bar’s high is higher or equal to the previous bar’s high, the difference is calculated and added to the numerator.
• If the current bar’s high is lower than the previous day’s high, then zero value is assigned to that bar. Next values of the difference between the highs for each bar are added to the numerator over a series of 13 consecutive bars.
• If the current bar’s low is equal or less than the previous price bar’s low, then the difference between the previous day’s low and the current low are the numerator.
• If the low of the current bar’s is greater, a zero value is assigned to the nominator at this bar. The next values of the difference between the lows for each bar are added to the numerator over 13 consecutive bars.
2. Calculate the denominator of TD DeMarker I equation
• You add the value in the denominator to the sum of the differences between the lows in the same period.
3. Calculate TD DeMarker I = divide the numerator by the denominator.
• As a result, we get a value that will move in the range from zero to 100 in the form of a fluctuating 13-period line. At the same time, the overbought zone will be above 60, and the oversold zone will be below 40.
Now, let’s find out how this indicator’s signals are interpreted
A buy signal should satisfy the following conditions:
1. DeMarker I must not be below 40 for more than 13 bars
2. The bar’s close at the signal level should be lower than the low of one or two bars ago
3. The bar’s close at the signal level must be lower than the previous bar’s open or close.
4. The open of the next bar following the assumed reversal bar must be less than or equal to the close of any of the two previous bars.
5. The asset must be trading higher than at least one of the two previous closes.
As an example, I’ll take the BTCUSD market situation that has recently occurred. It is clear from the above chart that the BTCUSD was in the overbought zone (above 60) from the start till the end of May. Afterwards, the price rolled down below 40 and the indicator entered the oversold zone.
Immediately after that, we look for a point where the bar features the low before price exits the oversold zone.
Finally, when the price went beyond the oversold zone on June 13, we can easily identify the low in the period when the ticker had been below 40, according to TD DeMarker I.
Now, we can analyze the continuation pattern based on the above conditions.
1. The DeMarker I indicator was below the level of 40 for not more than 13 bars - in our case it was only 5 days;
2. The bar’s close under the red arrow is lower than the previous bar’s low (blue dots are above than the red dotted line).
3. The close of the bar below the arrow is lower than the previous bar’s open and close (blue dots are far lower than the previous bar).
4. The next bar’s open following the reversal bar is equal to the previous bar’s close (there are no gaps).
5. The asset is trading higher than the previous bars’ close levels. Furthermore, when the indicator exited the overbought zone, the price had been already trading above all the previous bars’ close levels.
Therefore, one could have safely entered a buy trade at the current level when the new bar of June 14 opened (I marked it with a red cross in the chart).
As we already know, this signal reached the target and provided the opportunity to gain on the BTCUSD movement up to the high at 14 000 USD.
I should note that when a buy signal is not confirmed, that is, the five conditions above are not met, there is still a signal, but it is a sell signal. Although such a sell signal cannot be as strong, it can be a confirmation for bearish signals of other indicators.
There is a good example in the chart above. It displays bitcoin’s all-time high at 20 000 USD.
After the DeMarker I had been in the overbought zone for quite a long time, it moved into the oversold zone, and so, we start counting and see how long the price will be in this zone.
Finally, there is the following situation:
1. DeMarker I was not below the level of 40 for more than 13 bars, in this case it was 12. So, this condition is satisfied.
2. The close of the bar under the red arrow is lower than the previous bar’s low (blue dotetd line is below the red dotted line). This condition is also satisfied
3. The close of the bar under the arrow is lower than the previous bar’s open and close. This condition is also met.
4. The open of the bar following the reversal bar is equal the close of the previous bar (there are no gaps). This condition also confirms the bullish scenario.
5. The asset is trading above the previous close levels. This condition is not met.
It is clear from the above chart the bar following the oversold zone (marked with a red arrow) went down lower than the close levels of the previous two bars, and, moreover, it was trading below the close level of the two bars preceding the reversal bar.
Therefore, the last condition is not satisfied, and so, we have the reasons to assume that there is a real reversal of the bullish trend.
Now, let us study the sell signals.
The following conditions must be met:
1. A sell signal should meet the following conditions:
2. The indicator must be above level 60 for at least six bars.
3. The signal bar’s close must be above the previous bar’s open and close.
4. The open of the bar following the signal must be equal or higher than the close of any of the two previous bars.
5. The asset must be trading below one of the previous close levels.
As soon as all these conditions are satisfied, it can be interpreted as a sell signal.
TD DeMarker II
The above chart presents an example of the Bitcoin bullish trend reversal in December 2017, after which there started a long-tern bearish trend. Let us analyze this situation as a bearish signal. When the bar marked with a red cross was forming, the DeMarker I indicator leaves the overbought zone and goes below level 60. Therefore, it is the case for looking for a sell signal within the zone, where the price was above level 60 (the zone is highlighted with green in the chart).
The red arrow highlights the bar that closed higher than the highs of the previous two bars, and so, higher than the previous bar’s open and close (in the chart, it is marked by the purple dotted line on December 17 that is above the green line). The next bar, following the one with the red arrow, also meet the condition and opens above the close of the second-last bar. Finally, there is the trend reversal signal and the opportunity to take the profit on December 20 (it is the bar marked with the red cross in the chart). However, this indicator, like other technical tools, may send false signals. To filter the entry signal, it is recommended to apply TD DeMarker II as a supplementary tool.
TD DeMarker II
Unlike the TD REI and TD DeMarker I, which compare the price highs and lows with those of one bar ago, TD DeMarker II analyzes a number of price ratios to measure the pressure of buyers and sellers.
Let us study the calculation formula of the TD DeMarker II.
Calculate the numerator:
1. Calculate the difference between the current bar’s high and the previous bar’s close.
2. Add the result to the difference between the current bar’s close and its low.
3. Distract the previous value from the current bar’s high
4. Sum up all the values. If there is negative result, assign a zero value to it.
Calculate the denominator:
1. Add the difference between the current bar’s low and the previous bar’s close to the numerator.
2. Add the result to the difference between the current bar’s high and its close (this value defines the selling pressure).
The buy and sell signals of this indicator work under the same conditions as for the TD DeMarker I, so, I won’t enumerate them again. I have already many times mentioned that, if multiple buy or sell signals are at the same place, the signal becomes much stronger. As it is clear from the above chart, a buy signal sent by the TD DeMarker II (green cross) matches to the one sent by the TD DeMarker I (red cross), which in combination confirms the sell signal and enhances it.
TD Pressure
DeMark suggests that the price action is directly affected by the supply/demand ratio. As the price change is often preceded by a change in trading volume, DeMark suggests measuring the speed of changing in the trading volume along with the speed of price changes. In addition, according to DeMark, these parameters are more important for the current bar, rather than for the complete bars. In general, these values determine the buying pressure on the market, which is calculated by subtracting the current bar’s open from the its close and dividing the result by the price range of this bar.
The result is multiplied by the trading volume of the current period and is added as a progressive total to the indicator value.
Finally, we have an indicator that shows buying pressure. For example, if the bar’s open is equal to its low, and the bar’s close is equal to its high, then the trading volume will be on side of buyers, and the indicator will display a strong rise of buying pressure. And vice versa, if the bar’s open and close coincide, even a greater trading volume won’t affect the indicator, as the market will be balanced, and the bulls’ power will be roughly equal to that of bears.
The indicator’s band moves from 0 to 100%, and the overbought and oversold zones, like for the indicators, described above, are the zones above 60 and below 40 respectively. The buy and sell signals sent by this indicator are interpreted in the same way as those sent by TD DeMarker I and II. Besides, this indicator is also a confirming one, and when it coincides with other signals, it confirms the indicated direction.
You see in the above chart that the signal sent by the TD pressure (yellow cross) matches to the signals sent by the DeMarker I and the DeMarker II (red and green crosses respectively), which means that the sell signal is true.
TD Rate of change (TD ROC)
TD ROC is an integral component of TD Alignment but can also be used in isolation as an overbought/oversold indicator.
It is thought to be quite simple and is determined by dividing the close of the current price bar by the close of twelve price bars earlier.
Although it is pretty simple, this indicator is quite efficient. According to Thomas DeMark, the bears’ zone is below 97.5. Bulls zone is above 102.5. Therefore, when the indicator is in a narrow band between 97.5 and 102.5 the market is in balance.
So, this indicator helps you identify the market sentiment at any moment.
But this is not its primary advantage. You can employ this indicator in technical analysis and draw the common patterns and trend lines. The chart above shows how a triangle worked out. A strong momentum, marked with a red arrow, draws the indicator beyond the triangle, which means that the market lost balance and started moving in the bullish trend.
Next, after the triangle was broken out and the bullish trend started, we build trend lines according to the common rules; in the bullish trend, the trend is outlined along the support line (red line), in the bearish trend -along the resistance lines (green line).
It is clear from the chart above that the breakout of these lines and entering the bear zone send a sell signal (red cross) in early July. Afterwards, we build the trend line along the resistance levels sand expect until the price breaks it through and enter bullish zone. Finally, in the mid-July, there is such a buy signal, marked with green cross in the chart.
Next, there is a strong growth in the bullish trend that is marked with the red trend line. The breakout of this line sends a signal to take profit, and entering bearish zone again signals the trend weakness.
As you see from the chart above, the indicator broke through the green trendline in late July but it hasn’t entered the bullish zone, and so, there has been no buy signal so far.
Another signal that really matters when using this indicator is the signal of convergence and divergence.
These signals are rarely sent by this indicator, but they are usually quite accurate, especially in long-term timeframes.
There is a clear divergence in the above chart. When the price is growing, the indicator is declining, which signals the trend exhaustion. In early July, the price couldn’t break through the previous high, thus confirming the direction of the indicator (marked with a circle).
Finally, as I have already said, the indicator went down below the trend line, which sends a strong sell signal; however, as you know, the bearish correction didn’t work out, so, for an accurate forecast, it important to employ all the DeMark's tolls together.
TD Alignment
Just for this purpose, to combine all the tools together, the TD Alignment indicator was developed.
TD Alignment is a composite indicator that combines the following five TD oscillators to measure buying and selling pressure:
1. TD DeMarker I
2. TD DeMarker II
3. TD Pressure
4. TD Rate of Change
5. TD Range expansion Index (this indicator is described here)
Each of these indicators has its own distinct method of measuring overbought/oversold conditions. TD Alignment is based on the values of all the above indicators according to the principle, where the final result is determined of the number of indicators in an oversold condition, overbought and equilibrium.
In addition, to calculate the TD Alignment, there were defined the following overbought/oversold zones:
Overbought/Oversold
1. TD DeMarker I - 60/40
2. TD DeMarker II - 60/40
3. TD Pressure - 82/12
4. TD Rate of Change - 101/99
5. TD Range expansion Index - 40/-40
Therefore, when the TD DeMarker enters the oversold zone, 1 is added to the total result. If the indicator enters the equilibrium zone, between 60 -40, a zero value is assigned, if it is below 40, 1 is subtracted from the total value.
Based on the same principle, all the indicators are calculated, and finally, there is the TD Alignment value that is moving between -5 and +5. -5 is reached when all the indicators are in the oversold zone, and +5 is associated with the case when all the indicators are in the overbought zone.
Unfortunately, I failed to find the TD Alignment in free access, so I had to write everything on my own. I must admit there may be errors in calculations, nonetheless, it performs quite well during testing. As you see, the main benefit of this indicator is showing the cases when the market reaches the extremes of the overbought/oversold zones.
In the above chart, I highlighted these levels from +4 to +5 and from -4 to -5.
When the indicator reaches this zone, it is obvious that the price will start correction soon and so you should take a corresponding decision on either taking profit or entering a trade. In addition, the indicator shows the market sentiment currently dominating; if it is above zero, bullish sentiment is dominating, if it is below zero, the market is bearish.
Buy or sell signal here must meet the same 5 conditions, described for TD DeMarker at the beginning of the article, the only difference is that you need to count the number if bars above or below zero.
Based on my own experience, I would add one more condition, the sixth one, to be met for entering a buy or a sell trade. A buy/sell signal is confirmed when the TD Alignment indicator breaks through zero level (red dots) only provided that the indicator hit the overbought/oversold zone before.
In the above chart, I tried to illustrate that, after the indicator hits green or red zone, i.e. overbought or oversold zone, the sixth condition is satisfied. So, when the indicator breaks through or rebounds from the zero level, there is a buy or a sell signal (according to the market sentiment, I marked the entry signals with green and red arrows). A red thumb down marks the levels where the market doesn’t reach the zones indicated above, and so, the condition is not met and the buy or sell signal is false; I marked false signal with the red crosses in the chart.
However, not everything is that perfect, because this indicator is rather sensitive and so, it sends quite many false signals. That is why, I do not recommend employing this indicator alone, rather, it should be used together with other DeMark's tools so that it will be more efficient.
I will describe other useful DeMark's indicators and explain how to apply them to BTCUSD trading in my next articles.
Subscribe not to miss the continuation!
I wish you good luck and good profits!
Of

BTC Approved as CurrencyThe start of something new always happens on lower timeframes.
The Great Transfer of Wealth is here. July 4th 2020


proxima subida 8% con liberbanktras la compra de acciones por parte de bank of america y el contrato sponsor con el real madrid en la temporada 20/21 liberbank se recupera con fuerza. vemos subida 8% para los proximos dias. si supera .24 subirá con fuerza. liberbank a diferencia del santander u otros bancos ya lleva varios años reestructurando y reduciendo oficinas. a proposito. quien ha comprado acciones de bank of america ultimamente? el mismisimo warren buffett. tiene sentido? leave comments below


Supply and Demand On EURJPY >>4 Hr ChartThe daily trend go to be a uptrend and trend is changing from downtrend to uptrend so what will happen show up in the chart
the price will retest then go to down support level then after go to uptrend

[GBPCAD] Sell idea. Ascending triangle formationI set the sell limit higher than current price because I believe the pair will retrace back to the last highest wick, around the 61 in the Fib from the current price. I see price going straight down into the support zone and either sell past it or make its way back up, regardless we are in a good position for a 33 pip stop and a 300 pip gain.

BITCOIN WILL PUMP TO 9000 USD MINIMUM !!!!!!Hello !
Alot of people are calling this pattern a wickoff, telling that it will dump, but let me tell you, this is not a wickoff patter.
Wickoff patterns happen at the end of trends, for example at the end of an extreme downtrend and then it "wicksoff" and turns bullish again.
A bearish wickoff pattern will not emerge at the end of and extreme bearish pattern after the BIGGEST DUMP bitcoin has ever seen, this is stupid.
Also some people might call this a bear flag which is also not true, bear flags do not take 1 MONTH TO PLAY OUT !!!!!
This is clearly a very strong patter, pointing upwards, this will pump. WE ARE MAKING CONSTANT HIGHER HIGHS AND HIGHER LOWS, also we have a MASSIVE GAP at 9000 USD that needs to be FILLED!!!!!!!!! just look at the charts with a clear mind.
This IS THE OPPORTUNITY YOU HAVE BEEN WAITING FOR, DO NOT FALL FOR THIS FEAR IN THE MARKETS
Be smarter and do the opposite what the herd is doing, don't be a sheep and follow these "professional analysts", they do not know what they are talking about.
Best of luck !

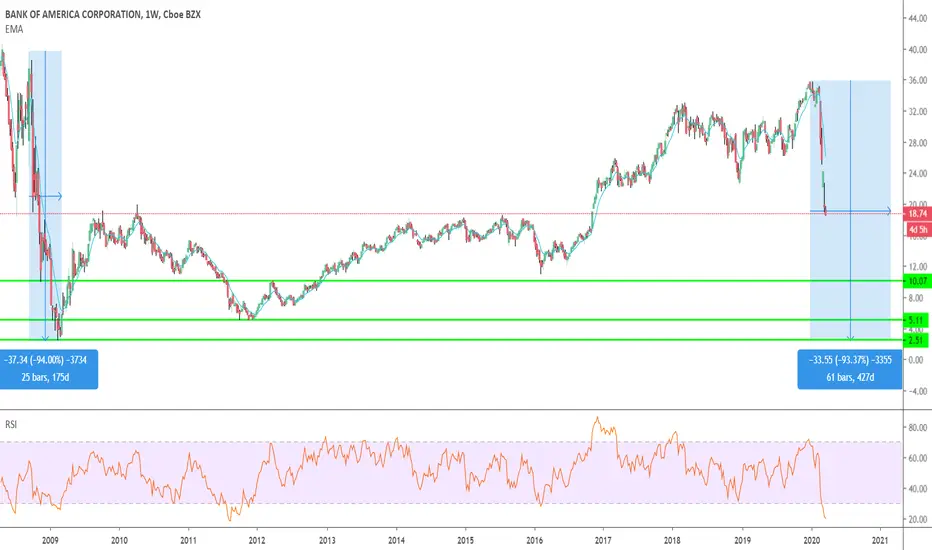
BAC - We are repeating the 2008 dropHello everyone, as we can see we are heading for the same % drop as in 2007, so expect till March - May 2021 the price to be around 5$ - 2.5$ . We do have support at 10$, but giving the fact how the 2007 crysis turned out for BAC with more than 90% drop, right now we are seeing record big drops, I see -90% from all time high price again. Right now we will see temporary retracement to the upside, but it will be fore 1-2 months, then we will drop again. Good luck to everyone, see you next year :D
Buying Astralis part 2Again, following up on the previous analysis posted I am repeating the buy signal, and adding more to my position.
Please, don't consider this a "loss chase" but merely part of my strategy to gradually build up a stock portfolio.
Astralis' Origen team managed to win their matches this weekend, securing them a tied spot for the first place in the LEC Spring
Around the time of the annual report, Astralis might even have won enough matches in the LEC to actually mention that they're (If they are at that point) qualified for some of the mid-year invitational leagues.
Each league that Astralis' teams qualified for, or owns spots in, is money for us as shareholders. More exposure means better sponsor deals.
These things, combined with the excellent opportunity for Astralis Group to showcase a remarkable 2019 result, and some great expectations for 2020, I think, will spark an impulse wave.
This earnings report will also be Astralis Group's first time to speak to the shareholders, so I am expecting the price to pick up rapidly upon the release of their first report, since bringing in over 5000 new individual investors.

manifested of we thru creation of we EXISTING AS WE Manifested of We thru creation of We EXISTING AS We AS Is of we rise as we it is of we ... as we can clearly see upwards as we made it to being of we )

Walking the xyz(w)- jungles. #2 I need proof! Do you wish to see some proof too?
Walk with the General through the garden of Xyz,
and nail every correction ever happened to XRP
under the moon...
As I explained in the previous idea #1,
we can observe exactly 11 waves long correction wave model.
This is one of the most widely encountered correction patterns
in the crypto market on higher timeframes.
This I tell you based on my experience(saw lots of
these complex price depressions on the real charts),
and Elliot agrees too.
Let's make sure that we've counted every important
little fractal. Because in order to see the picture
the trader's way, we gotta fist know EXACTLY,
in what fractal position we're in
(relative to the parent trend, parent's parent trend, e.t.c...).
I've tried out lots of possible combinations,
but only really the 11 waves xyz(w)xyz(w)xyz did the trick,
without any hard confrontations against the Elliot's Theory.
Where are we headed?
What is thy proof, Witcher?!
Let's walk with me along these xyz jungles...
You will see!
-Targets, General?
-Not yet, my friend. We have to confirm this root prognosis first.
Give me a couple more days, will think of something.
Now I'm out of the cigarettes. See you later, then. Gotta doping myself
these tense days... The pump is coming...
-Bye.
----------------------------------------
Thank you very much for reading and following!
I only hope that you've found this quick walk under the moon
refreshing and started considering finally longing that,
which rarely anyone was brave enough to long for the past 2 years!
Wait for the new confirmations and the
next articles on XRP in the following days! bb!
Moon profits to ya'all!

EURJPY GO LONGGGThere are many factors in which I noticed this market is on a up trend I plan on taking this to the upside for at least 20-30 pips maybe more depending on the New York open in a few hours. My tp's are 120.179 (20 pips) and TP 2 would be 120.324 ( 32 pips) if you are interested in learning in this trading style message me or follow me on instagram elite_ricky24

US Oil, theory of contrary opinionThe technical indicators on US Oil are unreliable. Go with the market and just trade the theory of contrary opinion. Trade the leaders, such as Contango Oil and Gas. Have fun :)


SPX Finishing September with a rebound Check out my trend lines, and predicted price movement lines. This is a fun test of my skills. I have been here a week and am still learning. For those of you who have been following me I am a SBUX bull. I have a high stake in an options call for SBUX to hit $105 by 11/15. I am relying on steady growth until earnings and then a killer Q4 earnings. Comment below your opinions on starbucks and your thoughts/predictions on their Q4 report.
So far on trade view I have a 60% accuracy rating for my calls, which is an F. So please don’t make trades based on my predictions until I improve my skills, thank you!

SBUX ending the week strong With market volatility dissipating and a big $30M EU court win for SBUX will help drive the price up the rest of this week. My closing price prediction is $92.50. Are you a Starbucks bull? Ready for Q4 this October? It will be a fun ride.


The Flower of Life + Kabbalistic Nonagon (BTC)This here chart is by no means perfect in it's current state. It's a work in progress still. Just thought i'd share it.

DXY 4H 50 & Ascending TL Rejection Clear 4h 50 EMA & Ascending TL rejection to take lower, which intake was a perfect time when NFP came out to be the catalyst to move Gold up for a simple pullback on a 400-500 downside move, which was another great short entry for gold to take from 1524 to 1504 for 200 pips. Gold Rejected 1H 50 ema, silver aligned well with this too.


BITCOIN (BTC) isThis is a chart
It shows support and resistance
Some are supporting the resistance
Others might be resisting to support
While most just can't resist to support this chart
it also appears that some find resistance to support this chart
Either way Bitcoin will find support within resistance
as it will find resistance true-out support
BITCOIN is

ZEC will guarantee the financial privacy of you and your familyThe cryptography behind Zcash is extremely advanced and allows total privacy. This coin has the potential to become THE world money, by being
1) A medium of exchange
2) A store of value
Recently, the masterminds behind Zcash -- Electric Coin Company -- announced they will to go all-in on $ZEC. electriccoin.co
It's needless to say I strongly believe in this coin, and I'm hodling it.
For short term trading, I like to keep things simple : I believe MA200 will be support and from now we will go up.
For long term view, and If you believe in the power of electronic P2P cash, definitely take a look at this coin. These current price are really attractive.
