#OG/USDT Analysis. Long Setup#OG
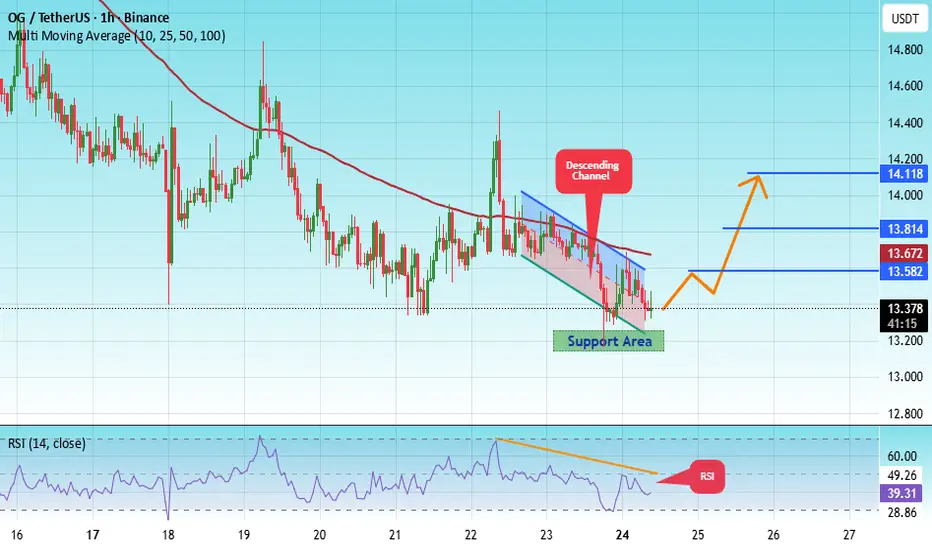
The price is moving within an ascending channel on the 1-hour timeframe and is adhering to it well. It is poised to break out strongly and retest the channel.
We have a downtrend line on the RSI indicator that is about to break and retest, which supports the upward move.
There is a key support zone in green at 13.20, representing a strong support point.
We have a trend of consolidation above the 100-period moving average.
Entry price: 13.38
First target: 13.58
Second target: 13.80
Third target: 14.10
Don't forget a simple money management rule:
Place your stop-loss order below the support zone in green.
Once the first target is reached, save some money and then change your stop-loss order to an entry order.
For any questions, please leave a comment.
Thank you.
OG
OGUSDT UPDATE#OG
UPDATE
OG Technical Setup
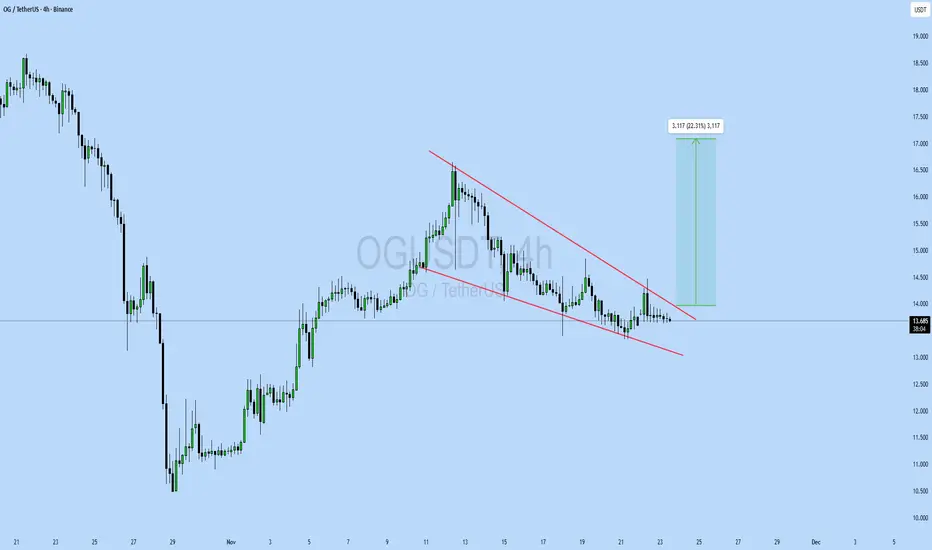
Pattern: Falling Wedge Pattern
Current Price: $13.67
Target Price: $16.78
Target % Gain: 22.31%
Technical Analysis: OG is breaking out of a falling wedge pattern on the 4H chart, showing early bullish momentum. The price has moved above the resistance trendline with steady candles forming near the breakout zone. The structure suggests a continuation toward the measured move target as long as the breakout holds and buyers maintain control.
Time Frame: 4H
Risk Management Tip: Always use proper risk management.
Scalp Long – OG💎 Scalp Long – OG
RSI indicates strong oversold conditions, forming a double-bottom pattern that suggests a potential reversal.
Price is consolidating, while buying volume is gradually increasing, showing signs of a recovery setup.
🎯 Plan:
→ Enter after confirmation of bullish breakout from the accumulation zone.
→ TP: 13.63 | SL: 10.38 | RR: 1 : 5.98
Market structure favors a rebound.
Keep positions lean, trail SL as price gains momentum.
Stay patient — only enter once the setup confirms clearly.

OG road map OG is trading near the upper boundary of the parallel channel formation on the weekly timeframe.The price action indicates potential for an upward breakout as momentum builds
If the resistance level breaks, we could witness a strong surge toward $70

SOL – Bulls Holding the Channel!SOL has been overall bullish, trading inside a clean ascending channel. Price broke above the $215 – $220 structure zone and pushed higher, but is now pulling back for a retest.
This zone is key 🔑 . It aligns with channel support, making it a strong confluence for buyers to step in. If bulls defend it, momentum could continue, and SOL may push toward higher levels inside the channel 🚀.
If the zone fails, a deeper correction could follow before another attempt from the bulls. Until then, the bias remains bullish as long as structure holds.
What do you think — will the bulls 🐂 step in and send SOL flying again, or will bears take over for a deeper pullback? 🤔
⚠️ Disclaimer: This is not financial advice. Always do your own research and manage risk properly.
📚 Stick to your trading plan regarding entries, risk, and management.
Good luck! 🍀
All Strategies Are Good; If Managed Properly!
~Richard Nasr

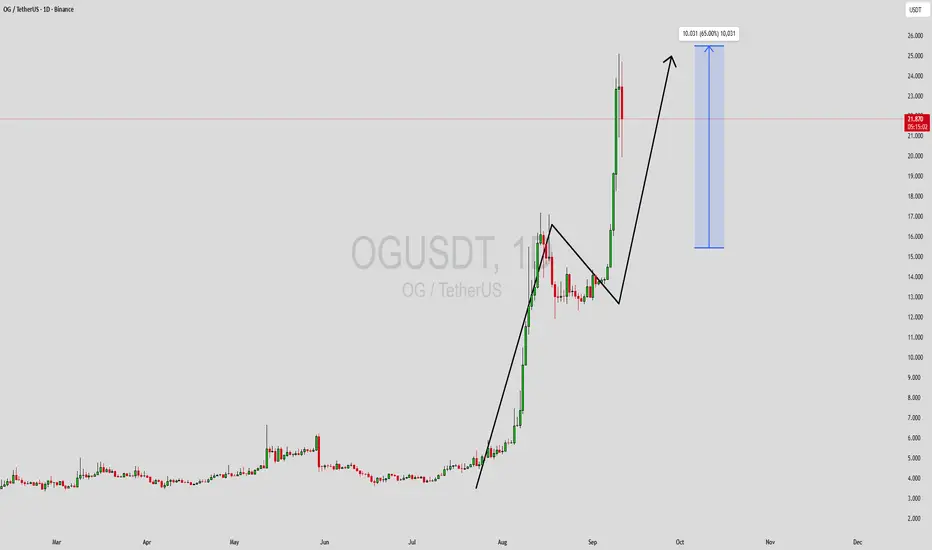
OGUSDT Forming Bullish ContinuationOGUSDT is currently displaying a strong bullish continuation setup, as seen in the recent price breakout and consolidation phase. After a massive rally, the pair entered a brief period of correction, which acted as a healthy retest before momentum returned to the upside. With strong buyer interest and a clear uptrend, the structure is pointing toward further gains, aligning with the 40% to 50%+ profit expectation.
Volume analysis supports this move, as trading activity has remained consistently strong throughout the rally. Sustained volume during bullish retracements is often a sign of smart accumulation, indicating that investors are positioning themselves for the next leg higher. The momentum breakout has confirmed renewed strength, signaling that OGUSDT is ready to push toward new resistance levels.
Investor confidence in OGUSDT continues to grow as the project gains attention in the market. The current setup provides traders with a favorable risk-to-reward ratio, especially given the clear breakout structure and potential upside targets. If momentum continues, we may see OGUSDT extend its bullish trend in the coming sessions.
✅ Show your support by hitting the like button and
✅ Leaving a comment below! (What is You opinion about this Coin)
Your feedback and engagement keep me inspired to share more insightful market analysis with you!
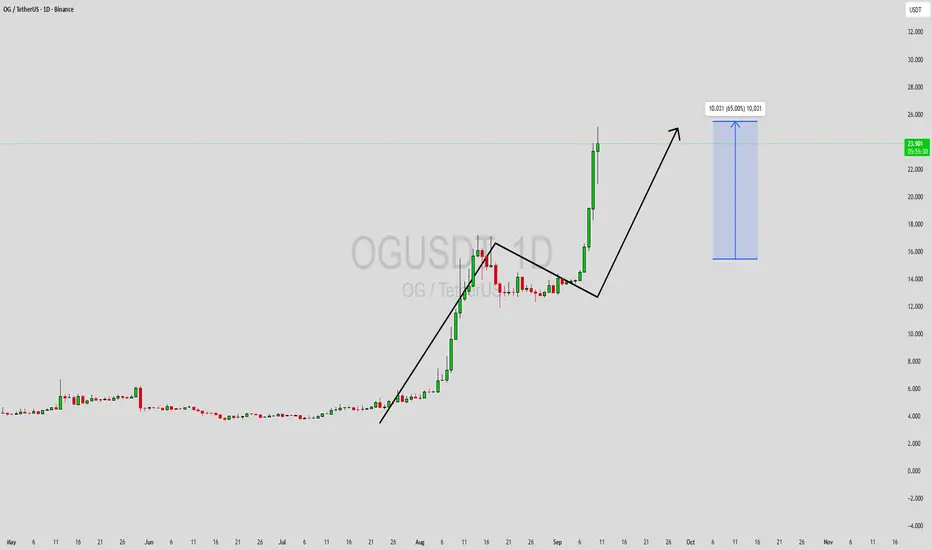
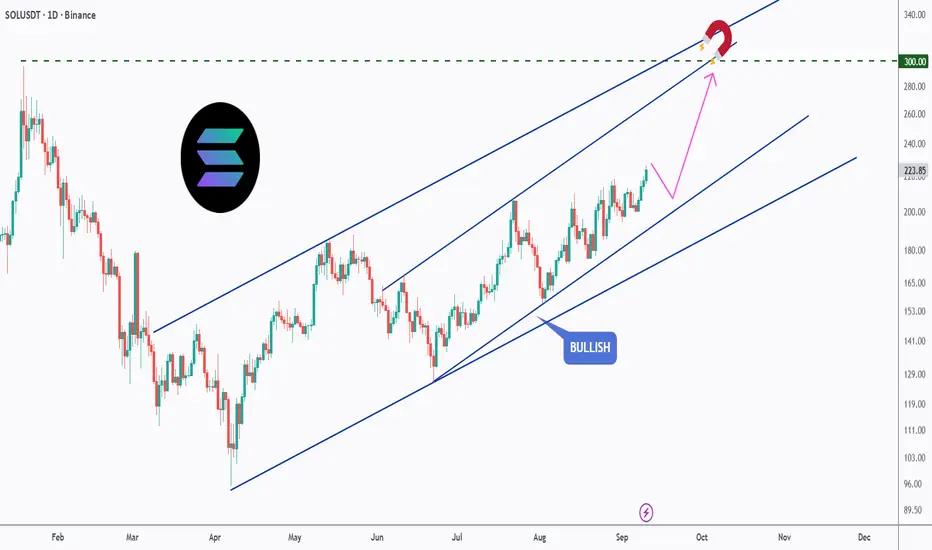
SOL’s Magnetic Path to $300!Solana has been steadily climbing inside a clean bullish channel, and the momentum is showing no signs of slowing down. The price action continues to respect higher highs and higher lows, keeping the bullish structure intact.
🟢 Bullish Channel: SOL is trading neatly within an ascending channel, confirming the trend’s strength.
🎯 Key Target: The $300 level acts as a magnet — a psychological resistance aligning with the channel’s upper boundary.
🔄 Healthy Pullbacks: Any short-term dips within the channel are being absorbed quickly, signaling strong buyer interest.
🚀 Upside Outlook: As long as SOL holds within the channel, the path of least resistance remains to the upside, with $300 as the next major milestone.
📌 Eyes remain on whether Solana can reach the $300 mark before the year’s end.
This is for educational purposes only, not financial advice. Always manage risk properly before trading.
📚 Stick to your trading plan regarding entries, risk management, and trade execution.
Good luck!
All Strategies Are Good; If Managed Properly!
~Richard Nasr
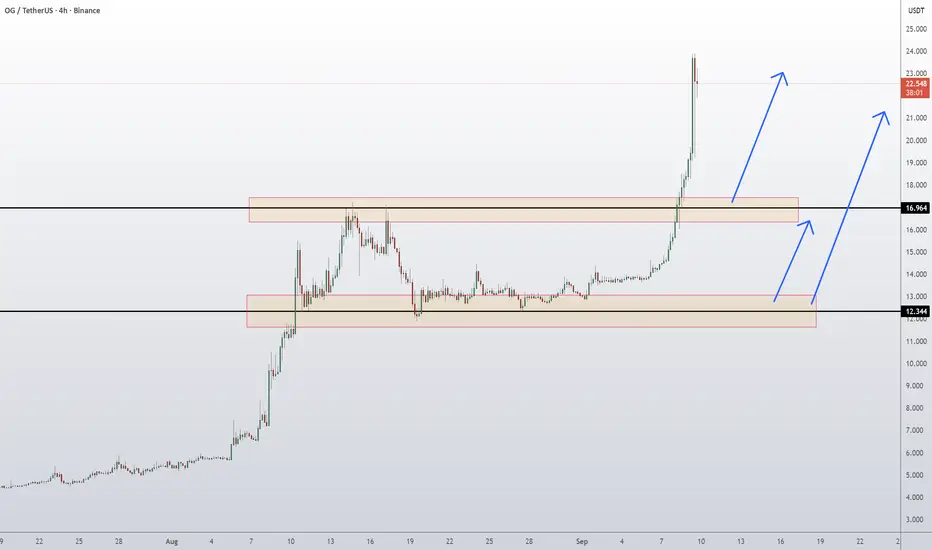
OG Fan Token Coin Price Prediction and Technical AnalysisOG/USDT has exploded higher with a parabolic move, surging from the consolidation range and breaking past the 16.964 resistance with strength. Price is now trading near 22.7, showing signs of possible short-term exhaustion after the steep rally. If buyers manage to hold above 16.964, continuation toward higher levels remains likely. However, if momentum cools, a retest of 16.964 or even the deeper 12.344 demand zone could occur before another bullish leg.
📈 Key Levels:
Buy trigger: Retest/hold above 16.964 support
Buy zone: 16.96 – 17.20 region (secondary at 12.34 if deeper pullback)
Target: 22.70+ continuation zone
Invalidation: Daily close below 12.344 (would signal weakening bullish momentum)
👉 Follow me for More Real Time Opportunities.
Share your Thoughts if you have any?
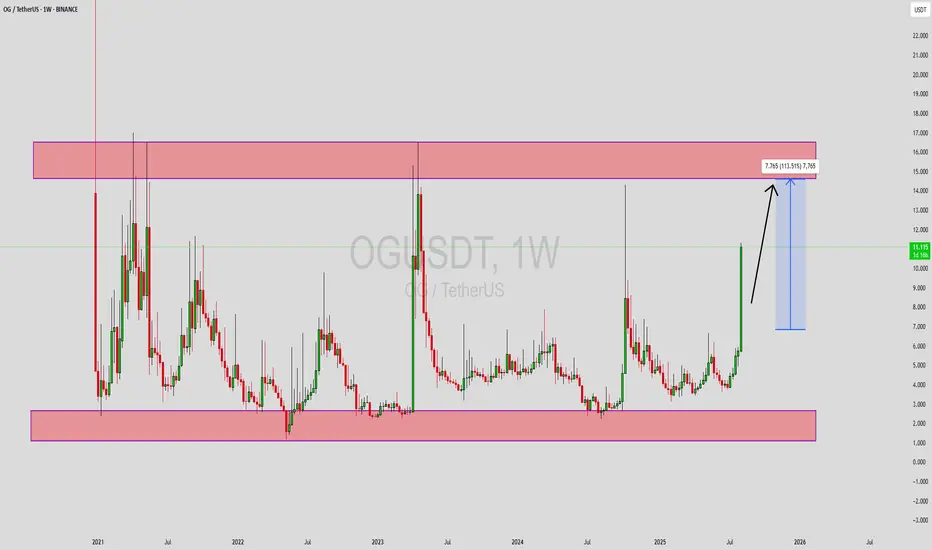
OG more than 4 years of accumulation!OG / USDT
Price is playing in long term accumulation between 2$ as support and 14$/16$ as resistance
Every time price hit resistance zone it rejected hard but once again we see another try to breakout with big volume
Breakout here and we will see fireworks
Keep an eye on it

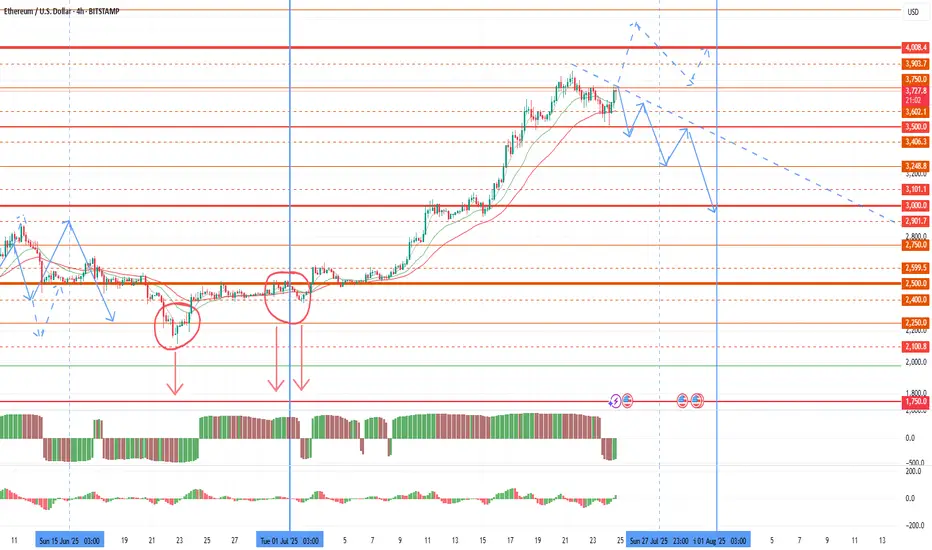
get readyget ready says btc
have you seen crossovers - up and down
not the ema crossing another ema
or sma crossing another sma
i'm talking about ema crossing its own sma
i've never seen checking or using these type of crossover analysis
here you will see that ema 50 crossing down sma 50 ( dotted orange crossed down blue )
as similar ema 100 crossing down sma 100 ( dotted red crossing down red )
now the ema 50 about to cross down sma 100
can you see that?
here we used 50, 100, 200 & 365
check it out & try it out !!

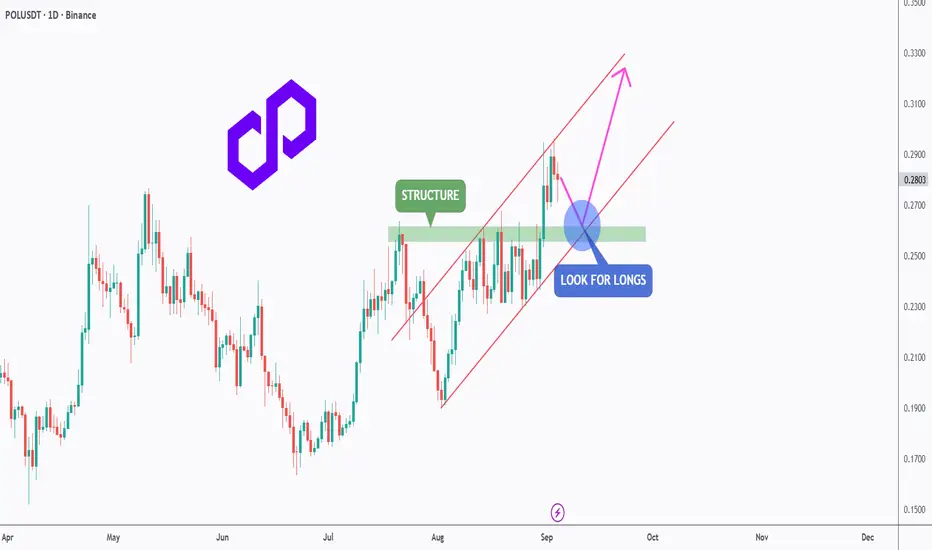
POL - Retest the Channel, Reload for the Next Leg!POLUSDT has been trading inside a clean ascending channel 📈, respecting both support and resistance levels.
After a strong push upward, price is now pulling back toward the previous structure zone around 0.26 – 0.27, which aligns perfectly with the lower bound of the channel.
This area forms a strong confluence (structure + channel support) 🔑, making it an ideal spot to look for long opportunities. As long as this zone holds, bulls 🐂 could regain control and push price toward the next resistance levels in the 0.32.
Patience here is key ⏳ — waiting for confirmation before entering can set up a high-probability continuation trade.
⚠️ Disclaimer: This is not financial advice. Always do your own research and manage risk properly.
📚 Always follow your trading plan regarding entry, risk management, and trade management.
Good luck!
All Strategies Are Good; If Managed Properly!
~Richard Nasr
OG Strong Chart Will Yield 888% Profits Within 6 MonthsI had to choose between this one and Milan's fan token. I went with this one because the chart is different. Milan (ACMUSDT) has the same chart as Atlético de Madrid (ATMUSDT). So you know what to look for there and you can also know now that ACMUSDT too is also bullish and coming out of major market bottom and low.
OG's chart is much more different though, the bottom was hit in May 2022 with a long-term higher low in August 2024 and another higher low on the 3rd of February 2025. This is a strong pair based on TA and guess what? It is ready now for a new wave of growth.
"Higher lows lead to higher highs," is a saying that I like to repeat over and over because it sounds nice. It doesn't necessarily have to be true but it will be true this time.
Most of the Altcoins produced a lower low in April compared to February or March, the fact that OGUSDT produced a higher low in April is a signal strength. This is enough to support a bullish wave.
The four weeks of bullish consolidation (prices moving slowly higher and the sessions closing green) supports the higher low signal.
Low volume in this instance —context is always needed for a signal to be interpreted correctly—means that the real action is yet to start. Not that the "growth is weak" but rather that there is no growth yet. So this is a positive signal. The fact that the market isn't dropping and is slowly growing and consolidating will lead to a strong bullish jump.
Ok. The technical analysis and signals are in place.
Now that we are done with the technological jargon we can move to the part we like most, take profits targets (TP for short).
Spoiler alert! I use the fibonacci tool to extract my targets against all other methods because this has been proven the most accurate over the years. Period.
» The purple target at ~$43 can yield 888% profits.
» The red target at $32 can yield 634% profits.
» The blue target at $21 can give an easy 380% profits if you were to buy at the current price and sell when this target hits.
Will these target hit or will they miss?
Just wait and see.
I can assure you that the market will turn green. That's all that matters to me.
It matters to me to give you a great entry price and great timing.
You are the one that should focus on securing your profits, it is a win-win-win.
Abundance, love, wealth, health and peace.
Thanks for being with me.
When I am gone, you will miss me.
Namaste.

OGUSDT Forming Bullish MomentumOGUSDT is staging a compelling breakout from a multi-year range, with price now pushing sharply higher and well above a key resistance zone. The weekly chart reveals a large rectangular range defined by significant long-term support below and supply above, and OG has decisively broken the upper band with strong volume and bullish candlestick confirmation.
Technical indicators align with this expansion: OG has risen rapidly—approaching a potential 112% upside to the next major resistance area. This move is reinforced by recent breakout patterns including a falling wedge and a broadening rising wedge, signaling a transition from accumulation to a strong bullish trend. Furthermore, market volume remains elevated, validating buyer conviction on the breakout
Adding to technical strength, institutional and retail attention has surged. Notable is the launch of the OGUSDT-margined perpetual futures contract on KuCoin, offering up to 30x leverage and likely increasing speculation and liquidity in the token. Bullish engulfing patterns and momentum indicators (RSI, MACD, etc.) in higher timeframes further attest to strong upside bias
OGUSDT has emerged from a prolonged multi-year consolidation and is now rallying with conviction. The sharp breakout above resistance, underpinned by high volume, breakout structures, and fresh derivative infrastructure, sets the stage for a strong mid-term move. The target zone near $16–17 USDT represents a potential 110%+ upside if momentum sustains.
Traders should monitor retests of the breakout level for entry opportunities—proof of support here could validate continuation toward the target range.
✅ Show your support by hitting the like button and
✅ Leaving a comment below! (What is your opinion about this Coin)
Your feedback and engagement keep me inspired to share more insightful market analysis with you!
Possible market drawdown before the end of the monthToday I want to review the market and give a warning on further purchases. Since the last review, as expected, volatility in the market began to grow with a flat of about 2500 on ether until the half-year change. The growth of the euro and oil gave rise to a 4k retest in the new half of the year. However, the half-year has opened below 2,500, which is a technical selling signal that bears will use at the end of each major period. A large volume of sales was also left before the half-year change, which can be retested up to 2100-2250. The first pullback is already possible for the current monthly candle, with its pinbar reversal up to 2750-2900 on ether. This pullback started yesterday and is likely to accelerate in the last weekly candle of the month. Further sales are highly likely to continue in the first half of the new month as part of the shadow drawing for the new monthly candle. In an optimistic scenario, the bulls will be able to take 4,000 by the end of the week, in which case the pullback on the current monthly candle will be compensated.
Given the increased likelihood of sales in the market, I recommend fixing profits by the end of the week and reducing the number of coins in operation. The current rollback for some coins will also end with the assignment of the monitoring tag at the beginning of the month and a further collapse, which puts pressure on the coins.
Most of the coins that I considered for work provided good opportunities for making money, especially the growth impulses of pivx and data with sharp breakouts stood out. Adx fio chess cos token also showed growth, but at a smoother pace. The most negative dynamics was given by slf, which eventually received the monitoring tag, and I will not consider it in the future.
Despite the pleasant impulses of 50%+ for individual fantokens, this group as a whole shows extremely negative dynamics relative to the market, and remains in the most oversold position, even relative to coins with the monitoring tag. In an optimistic scenario, fantokens will become interesting to speculators against the background of the general decline of altcoins that has begun, and we can expect a good bull run on them before the end of the month. In a negative scenario, binance may be preparing to assign the monitoring tag to some tokens of this group or chz. In this regard, I leave such tokens as atm acm city porto Lazio as the most undervalued in a small lot. But at the beginning of the month, I also recommend keeping short stops on them in the first half of the day of the first week of the new month to insure against assigning the monitoring tag. Or temporarily sell them for a given period.
In addition to fan tokens, I will choose new coins for operation after assigning the monitoring tag in the new month.
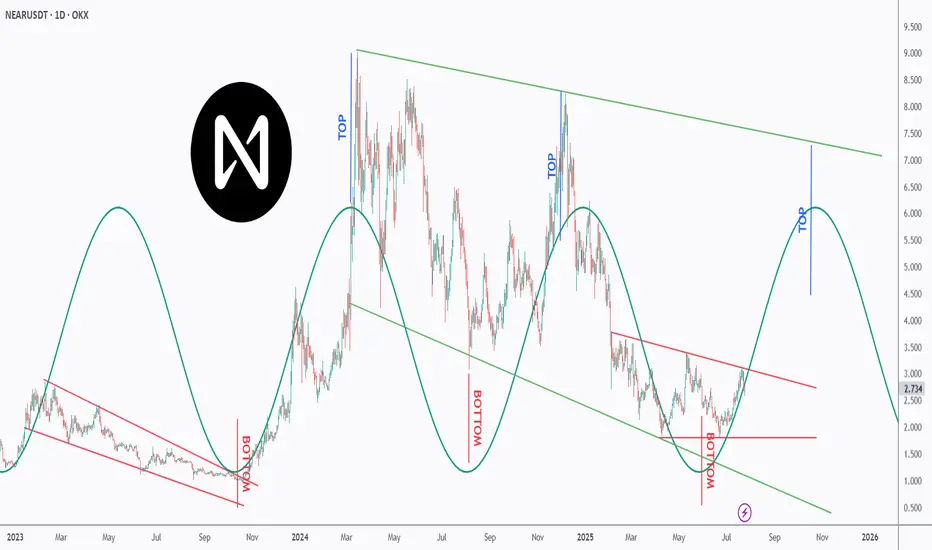
Is NEAR NEARing Its Next Explosion? Watch This Perfect Pattern!NEAR is dancing to a powerful rhythm — and it’s all in the cycles 🔁
This chart uncovers a repeating top-bottom cycle that has held since early 2023, with precise peaks and valleys emerging every few months 📉📈.
After bouncing off a major bottom at ~$2, NEAR is now approaching the mid-line of the descending red channel, suggesting a potential trend reversal is underway 🔄.
Each previous “BOTTOM” aligned with strong recovery waves 🚀, while the projected “TOP” now points toward the $6–7 zone — aligning perfectly with the upper green trendline resistance 🎯.
If the pattern continues, we could be looking at another macro push before year-end 2025 📆.
📊 Will NEAR ride this wave to new local highs — or is it just another lower high in the making? Either way, the rhythm of this chart is too clean to ignore.
📚 Always follow your trading plan regarding entry, risk management, and trade management.
Good luck!
All Strategies Are Good; If Managed Properly!
~Richard Nasr
ETH Hits $3K — Next Stop: Moon or Pause?ETH just tagged the psychological $3 000 barrier after a sharp impulse, printing a fresh higher high inside its rising channel.
🧠 Game plan:
1️⃣Pullback zone: The orange structure area at $2 550 – $2 700 aligns with the channel’s lower trend-line — a prime spot for bulls to reload.
2️⃣Continuation trigger: A clean 4H close back above $3 000 turns the level into support, unlocking the path toward $3 100 (first target) and potentially higher into the summer.
3️⃣Invalidation: A decisive break below the channel would neutralise the setup and shift focus back to the macro support near $2 400.
Until then, every dip toward the orange demand is a gift in this bullish structure. Trade the plan, not the noise.
📚 Always follow your trading plan regarding entry, risk management, and trade management.
Good luck!
All Strategies Are Good; If Managed Properly!
~Richard Nasr

XRP - Trade The Range!Hello TradingView Family / Fellow Traders. This is Richard, also known as theSignalyst.
📈XRP has been trading within a range between $2 and $2.35 in the shape of a flat rising broadening wedge pattern in red.
🏹 The highlighted blue circle is a strong area to look for buy setups as it is the intersection of the green support and lower red trendline acting as a non-horizontal support.
📚 As per my trading style:
As #XRP approaches the blue circle zone, I will be looking for bullish reversal setups (like a double bottom pattern, trendline break , and so on...)
📚 Always follow your trading plan regarding entry, risk management, and trade management.
Good luck!
All Strategies Are Good; If Managed Properly!
~Rich

LDO - Next Impulse Starting Soon!Hello TradingView Family / Fellow Traders. This is Richard, also known as theSignalyst.
After breaking above the $0.8 major high, LDO has shifted from bearish to bullish from a long-term perspective. 📈
This week, it has been undergoing a correction phase within a falling channel marked in red. 🔻
For the bulls to take over and kick off the next impulsive wave toward the $1.5 mark, a breakout above the upper red trendline is needed. 🚀
📚 Always follow your trading plan regarding entry, risk management, and trade management.
Good luck!
All Strategies Are Good; If Managed Properly!
~Rich

XRP is so BACK!Hello TradingView Family / Fellow Traders. This is Richard, also known as theSignalyst.
As per our last XRP idea, attached on the chart, it rejected the lower green structure and surged by over 25%.
📈XRP is now bullish long-term trading within the rising channel marked in blue.
Moreover, the upper green zone is a strong structure!
🏹 Thus, the highlighted blue circle is a strong area to look for buy setups as it is the intersection of structure and lower blue trendline acting as a non-horizontal support.
📚 As per my trading style:
As #XRP retests the blue circle zone, I will be looking for bullish reversal setups (like a double bottom pattern, trendline break , and so on...)
📚 Always follow your trading plan regarding entry, risk management, and trade management.
Good luck!
All Strategies Are Good; If Managed Properly!
~Rich

Continuation of the PORTO trendAccording to porto, the picture resembles alpine, the goal is also to try to take the level of 1.5 with the opening of the second half of the quarter higher, which will create the ground for a stable trend immediately to 2.5. The main medium-term goal is the range of 2.5-3.5, where large volumes of purchases were previously left. I would like to note that the level of 2.5 is the threshold for the growth of volatility, and in case of its breakdown, any growth wave can give an impulse up to 5 and 7.5. If there is insufficient volatility, there is a possibility of a rollback to a 0.9-1.0 retest and a second attempt to take 1.5 by the beginning of the new month.
Porto Lazio adm city acm does not have futures on finance yet and may be added in the near future, which will cause a wave of growth up to 100%+ for these tokens. Together with this group, I am considering alpine for work, while the rest of the fan tokens are still in a more overbought zone.

Bull run over the weekend amid strong signals for market growthTo date, the crypt has been given a number of positive factors and the basis for a very stormy weekend.
Binance monitoring did not give a new assignment of the tag, which was immediately responded to by pivx, which I recommended for work. I think the holidays in China had an impact. In the new rules for assigning the binance tag, it obviously means the first working week of the month. Apparently, the assignment of the tag can be expected from Tuesday with the start of the working week in China.
This week, almost all important statistics on the United States came out negative, in addition to last week. For oil, the same picture is for purchases.
The combination of these factors sets the stage for an attempt at an annual turnaround of the crypt with disruptions to the tops. It's too early to talk about the consolidation of such a scenario before the second half of the month, but the signal itself for a possible trend for bitcoin at 210k and ether at 5000k+ sets the stage for a bull run on altcoins.
Due to this picture, a very stormy weekend is likely ahead, followed by a correction in tag assignment and a new wave of growth in the second half of the coming week.
This weekend, first of all, we can expect bull runs on fantokens, which remained the most oversold instruments after another delisting, which makes them extremely attractive to speculators. First of all, I am considering atm city acm asr. Their breakout potential is up to 3-5X, depending on volatility.
Among altcoins, bifi fio chess retains a good potential for breakouts of similar pivx. A repeated pulse on pivx can be considered already in the case of the start of a bull run. According to these coins, growth impulses of up to 50-70% are likely. Koma is also in an interesting position on binance alpha, which can show growth up to 0.050-75.

Growth to 150-250% by pda in the coming week.As I wrote earlier, April is the most powerful seasonal growth period in the first half of the year. The first half of the month was under selling pressure against the background of the continuation of the trend of the previous month and quarter, but as we approach the middle of the month, the activity of buyers is likely to begin to increase and from the second half of this week we can expect breakouts in coins with a subsequent trend. To date, coins with the monitoring tag that are not included in the delisting announcement have a high probability of growth, because They are the most oversold due to concerns related to the announcement, but now they have time to wait for the next announcement. Wing was the first to react, and it retains the probability of a new wave of up to 50%+ this month. But today I want to focus on the pda, where the main goal is to retest the range of 0.021-25 at least and attempt a test of 0.035-50 with sufficient volatility. Even with growth towards the immediate goal, the profit will be up to 150%+. VIB and alpaca have similar potential.
More interesting assets for speculators are only the coins from the delisting announcement, because due to the minimal capitalization, even a small influx of buyers gives a large percentage of growth. In this regard, before the actual delisting, there is a possibility of powerful exit pumps this week, as it already was on vidt. In particular, according to uft, the momentum may reach several x's by the end of the week. Cream and troy have less potential, but they can also show profitable growth impulses in the event of increased customer activity in the market. I would like to note that uft and troy have very high non-closed targets on the retest of 0.21-25 and 0.0031-35, which may lead to growth after delisting from binance at the expense of other exchanges.
