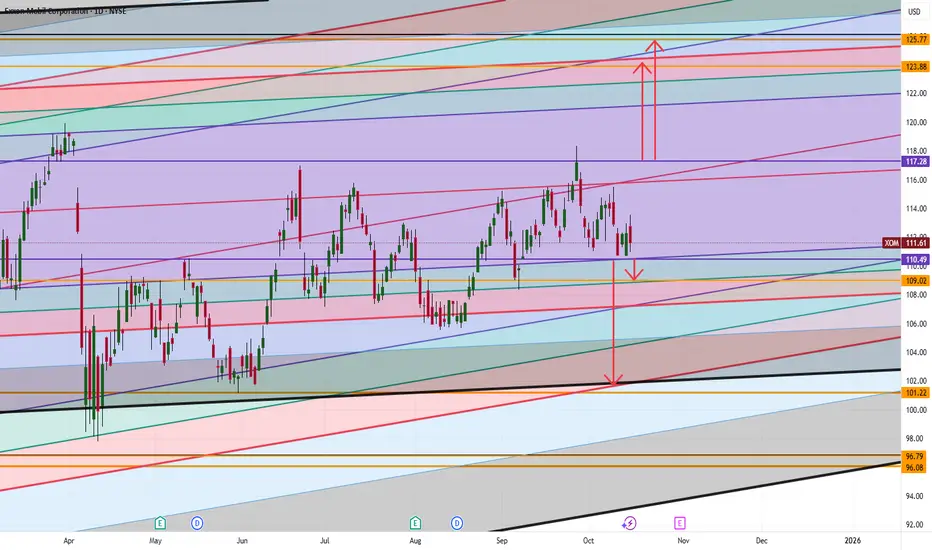
Exxon Mobil (XOM) Simple Market Breakdown!XOM’s sitting at a key level right now; momentum could go either way depending on the next breakout ⚡
Here’s what I’m watching:
📈 If we break above 117.28, that could open the door for a push up toward 123–125; that’s our next major target zone.
📉 But if we drop below 110.49, then we could see a move down toward 109, and possibly even 101 if selling pressure continues.
💡 So, short-term watch those breakout and breakdown levels closely.
Long-term ; whichever side breaks first will likely set the direction for the next big move.
Want to see how I’m tracking these levels and the signals I’m using to confirm the breakout?
💬 DM me “XOM” and I’ll share my private chart breakdown directly.
Oilstocks
US OilCrude Oil
- Completed " 12345 " Impulsive Waves
- Break of Structure
- RSI - Divergence
- Double Bottom as an corrective pattern in Short Time Frame
- Fibonacci Level - 61.80% / 78.60%

CHEVRON 53-year Channel Up for longterm investors can dazzle youChevron (CVX) has been trading within a 53-year Channel Up since January 1973. This is the epitome of long-term investing as the pattern has given excellent correction periods (Bear Cycles) to buy for the long-term and Higher Highs to sell and take profit.
During the first years, its Bull Cycles that ended in Higher Highs have been very aggressive, with all three reaching (and even exceeding) the 2.0 Fibonacci extension. In more recent years after the 2008 U.S. Housing Crisis, the two out of three major Bull Cycles (Bullish Legs for the Channel Up) merely reached the 1.382 Fib. All of the Bearish Legs, however, declined by around the same rate (-46.89%, -48.62% and -50.78%). The last two even hit the 1M MA200 (orange trend-line).
As a result, if we assume we will have the minimum of a Bear Cycle Chevron has seen inside this pattern which was the Dotcom's -41.55%, we can expect the current correction to marginally break below the 1M MA200 again to $112.00. However a Target on the 1M MA200 around $120.00 would perhaps be more fair.
The most efficient Buy Signal through this 53-year pattern, ha been when the 1M RSI hit 38.00. As you can see this has happened 7 times, providing the best level to enter for a long-term investor. Consequently, if the 1M RSI hits 38.00 before the stock hits $120.00, it is a good idea for long-term buyers to enter regardless.
The Target then is again the 1.382 Fibonacci extension at around $235.00.
---
** Please LIKE 👍, FOLLOW ✅, SHARE 🙌 and COMMENT ✍ if you enjoy this idea! Also share your ideas and charts in the comments section below! This is best way to keep it relevant, support us, keep the content here free and allow the idea to reach as many people as possible. **
---
💸💸💸💸💸💸
👇 👇 👇 👇 👇 👇

HAL (Halliburton) – Technical & Fundamental OverviewHalliburton NSE:HAL is a major oilfield services company, crucial to global energy infrastructure rebuilding and maintenance. It's well-positioned in any broad oil recovery cycle due to its scale and expertise.
📌 Geopolitical Catalyst (Optionality):
Halliburton is still owed millions by the Venezuelan government for prior services. Although unresolved, this presents optional upside should a settlement or regime change occur.
🧠 Technical Setup (Monthly/Weekly View):
Price set a higher low into HTF support in April 2025.
Currently accumulating above the Bull Market Support Band and consolidating around the 200-month level.
Major liquidity is stacked above, suggesting an 80%+ upside move is on the table if momentum continues.
📈 Trade Plan (Swing Idea):
Entry Zone: $28.00 – $32.00
Take Profit Levels:
• TP1: $41.00 – $44.00
• TP2: $54.00 – $57.00
Stop Loss: Monthly close below $25.00

Crude OilU.S Oil
- Sell Side Liquidity
- Break of Structure
- Bearish Channel as an corrective pattern in Short Time Frame
- Fair Value Gap
- IDM
- Order Block

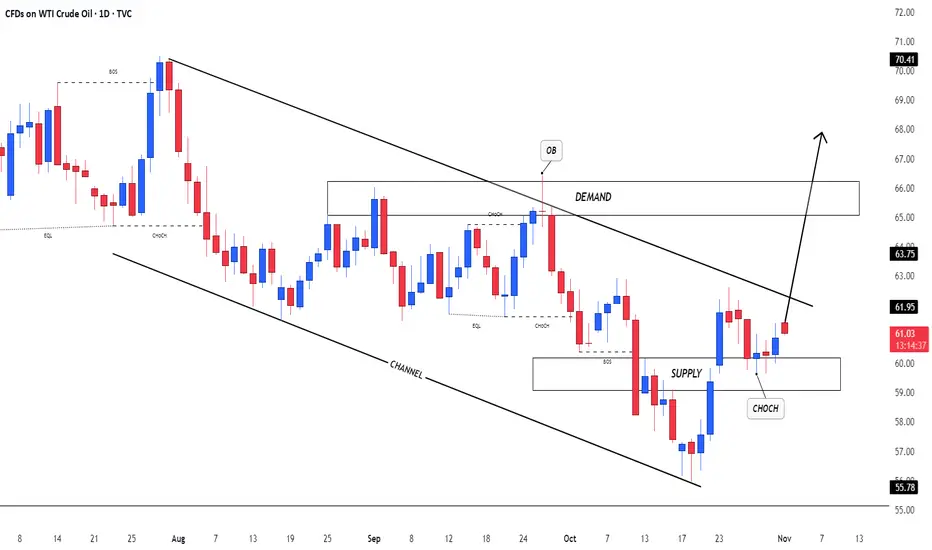
Crude OilU.S Oil
- Symmetrical Triangle as an corrective pattern in Long Time Frame
- Break of Structure
- Impulse Correction
- Demand Zone
- Change of Characteristics

CHEVRON 3-year Channel Down started new Bearish Leg to $132.Chevron (CVX) has been trading within a Channel Down since the November 14 2022 market High. Having currently broken below both its 1W MA50 (blue trend-line) and 1W MA200 (orange trend-line), with the two having formed a 1W Death Cross, the pattern has already started its new Bearish Leg.
There is a high symmetry between all 4 previous major Bearish Legs, which ranged from -18.71% to -21.83%, so based on the -18.71% minimum, we are expecting the stock to reach at least $132.00 by early Q2 2026. This would also make direct contact with the 1M MA100 (red trend-line), the market's next major Support level.
---
** Please LIKE 👍, FOLLOW ✅, SHARE 🙌 and COMMENT ✍ if you enjoy this idea! Also share your ideas and charts in the comments section below! This is best way to keep it relevant, support us, keep the content here free and allow the idea to reach as many people as possible. **
---
💸💸💸💸💸💸
👇 👇 👇 👇 👇 👇

Crude OilU.S Oil
- Completed " 13245 " Impulsive Waves
- Break of Structure
- RSI - Divergence
- Order Block
- Bearish Channel as an corrective pattern in Short Time Frame

US OilCrude Oil
- Double Bottom in Long Time Frame
- RSI - Divergence
- Fair Value Gap
- SSL
- Bearish Channel as an corrective pattern in Short Time Frame

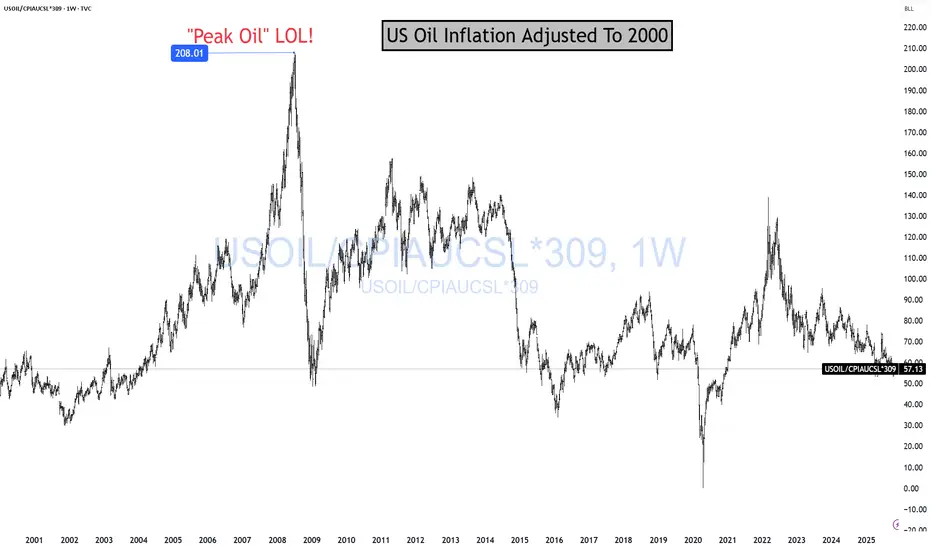
OIL Is Cheap For A ReasonOil is cheap because the global economy sucks! And it is "sucking" more and more every day. That's why Oil is on sale! Cheap! Cheap! And likely going to get more "cheap! cheap!" Me love you long time! Before I continue, story time.
In 2008, I could not convince anyone for the life of me that "PEAK OIL" was a scam! CNBC had T. Boone Pickens on twice a day, telling people we needed 238948735765374 barrels of oil to extract 1 barrel out of the ground.
Today, I can't convince anyone to skip EV, TSLA, AI, Crypto, the money has been made, GTFO. LOL!
As you can see, Oil is a much better long-term investment than all the hyped up trades pushed on to you daily.
Energy stocks make up about 3% of the S&P 500.
The Magnificent Seven circus? Roughly 36% of the entire index. LOL!
What are energy stocks going to do? Go to 1.5% of the SP500? Let it! Buy more!
BTW, you notice how they keep telling you AI will need all this energy? LOL! Wouldn't energy stocks reflect all that demand? LOL! SUCKA!
Anyway! Just look at the chart. If this makes sense to you and it fits your portfolio to BUILD a position long term, let me know in the comments. ;)
I have more on Oil here
THANK YOU for getting me to 5,000 followers! 🙏🔥
Let’s keep climbing.
If you enjoy the work:
👉 Drop a solid comment
Let’s push it to 6,000 and keep building a community grounded in truth, not hype.
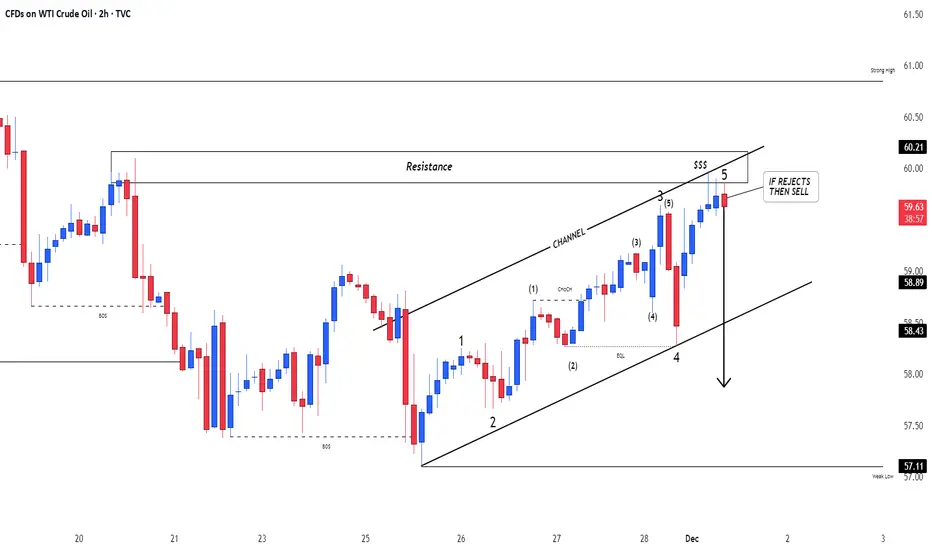
Crude OilU.S Oil
- Bullish Channel as an corrective pattern in Short Time Frame
- Resistance Level
- Change of Characteristics
- Completed " 12345 " Impulsive Waves
- Order Block
US OilCrude Oil
- Order Block
- Falling Wedge as an corrective pattern in Long Time Frame
- RSI -Divergence
- Demand Zone
- Completed " 1234 " Impulsive Waves

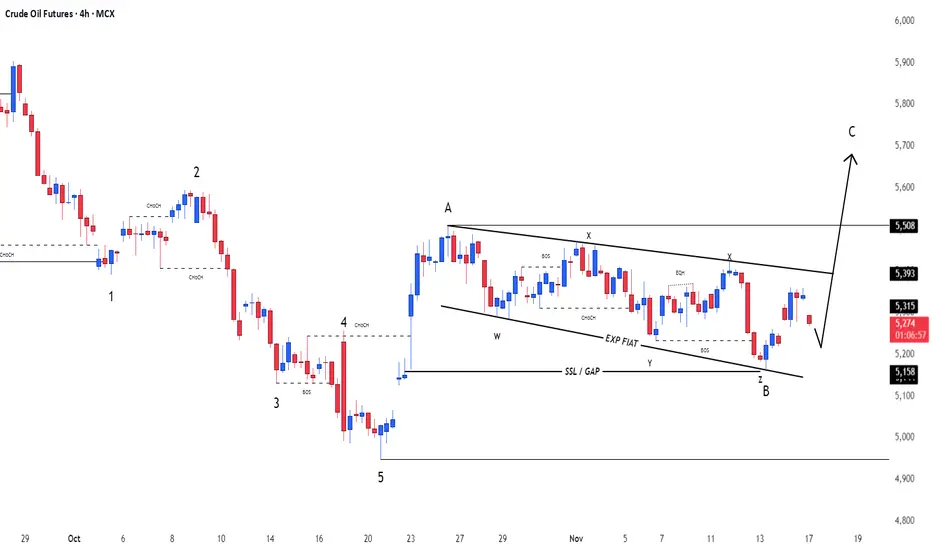
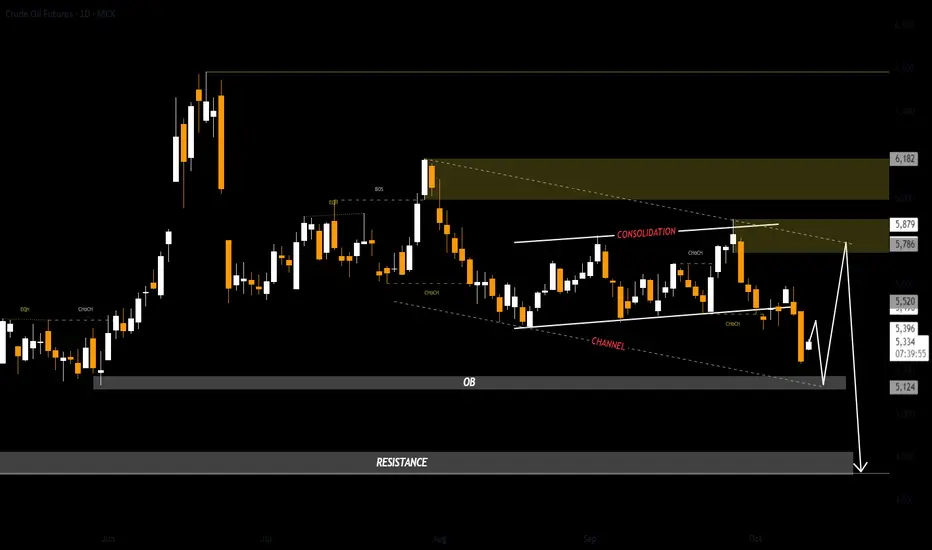
Crude OilU.S Oil Index
- Exp Fiat as an corrective pattern in Short Time Frame
- Break of Structure
- Completed " 12345 " Impulsive Waves and " AB " Corrective Waves
- Sell Side Liquidity
- Order Block
US OilCrude Oil Index
- Bearish Channel as an corrective pattern in Short Time Frame
- RSI - Divergence
- Supply Zone
- Change of Characteristics
- Order Block
US OilCrude Oil
- Consolidation Phase
- Break of Structure
- Bearish Channel as an corrective pattern in Short Time Frame
- Order Block
- Resistance Level
Devon Energy: A High-Dividend Setup Worth WatchingA shale specialist with big dividends, when the price is right.
Devon Energy is a U.S.-based oil and gas company focused on domestic shale production, particularly in the Delaware Basin, one of the most cost-efficient regions. It’s known for paying a “variable dividend”, meaning payouts rise when profits rise, and shrink when oil prices fall.
With its smaller size, Devon is more volatile than oil giants, but also more agile when prices are strong.
✅ Key Strengths:
- High dividends when oil prices are elevated.
- Efficient, low-cost production in the Delaware Basin.
- Strong upside when Brent crude rises.
⚠️ Potential Risks:
- Dividends decrease sharply if oil prices fall.
- More price swings due to smaller market cap and higher sensitivity.
📈 Technical View
As someone who appreciates structure in technical analysis, I have to say: this chart is a gem. Clean movements, clear tops and visually logical price behaviors.
Let me break it down:
From its all-time high in 2008, DVN went through a long downtrend — making a series of lower highs (LH) and lower lows (LL). For over a decade, buyers couldn’t gain control, even for short-term higher highs.
But that changed in 2020.
That rally brought a long-awaited structural shift: a higher high (HH), meaning buyers finally pushed the price above a previous high. The trend reversed, and the sentiment flipped.
Now what?
The stock has done a textbook pullback, a normal retracement after a strong move.
It currently sits at a critical technical confluence zone:
- The 61.8% Fibonacci retracement (often referred to as the “golden ratio”)
- A well-defined horizontal support level
- Structurally healthy trend
- Clear prior breakout
👉 Technically, this is a sound setup: structure + support + healthy trend. If buyers defend here, upside potential is strong.
Regards,
Vaido
This post is for educational purposes only and reflects my personal opinion, not investment advice.

EXXON MOBIL Critical crossroads.Exxon Mobil (XOM) has been trading within a Channel Down since the June 17 2024 Low and just recently on the July 11 2025 High, it made a Lower High pattern similar to November 22 2024.
As long as the price trades below the 1D MA200 (orange trend-line), we expect to start the new Bearish Leg and test at least Support 1 (97.85).
If however it breaks above the 1D MA200 it will invalidate all prior Lower High patterns, and will most likely follow the (blue) Channel Up to break above the Channel Down. In that case, we will be targeting Resistance 1 (120.00).
-------------------------------------------------------------------------------
** Please LIKE 👍, FOLLOW ✅, SHARE 🙌 and COMMENT ✍ if you enjoy this idea! Also share your ideas and charts in the comments section below! This is best way to keep it relevant, support us, keep the content here free and allow the idea to reach as many people as possible. **
-------------------------------------------------------------------------------
💸💸💸💸💸💸
👇 👇 👇 👇 👇 👇

CRUDE set to fire 82 $ 90 $ 104 $ ????Crude Daily Elliot waves count suggest big UP setup in progress right now
55 $ key level to watch for buyer Extension point
Due to amid middle-east war situation may trigger Up move impulse wave towards 82 $ to 104 $ range
EW count are keeping changing during different price action in different time frame & multiple forecast .
this educational based chart as per EW theory method

Oil Prices Up as Trump Delays EU Tariffs (Temporary Relief?) The global oil market, a sensitive barometer of economic health and geopolitical stability, registered a slight uptick in prices following the news that the Trump administration would extend the deadline for imposing new tariffs on a range of European Union goods. This minor rally, however, comes against a backdrop of a broader downtrend that has characterized the oil markets since mid-January. The persistent downward pressure has been largely attributed to the chilling effect of existing and threatened tariffs, not just between the US and the EU, but on a global scale, which have cast a long shadow over the outlook for global energy demand.
To understand the significance of this deadline extension and its nuanced impact on oil prices, it's crucial to first appreciate the environment in which it occurred. For several months, the dominant narrative surrounding oil has been one of demand-side anxiety. President Trump's "America First" trade policy, which has seen the imposition of sweeping tariffs on goods from various countries, most notably China, and the persistent threat of more to come against allies like the European Union, has injected a significant dose of uncertainty into the global economic system.
Tariffs, at their core, are taxes on imported goods. Their imposition typically leads to a cascade of negative economic consequences. Businesses that rely on imported components face higher input costs, which can either be absorbed, thereby reducing profit margins, or passed on to consumers in the form of higher prices. Higher consumer prices can dampen spending, a key driver of economic growth. Furthermore, the uncertainty created by an unpredictable trade policy environment often leads businesses to postpone investment decisions and hiring, further stagnating economic activity.
This economic slowdown, or even the fear of it, directly translates into weaker demand for oil. Manufacturing activity, a significant consumer of energy, tends to decline. Global shipping and freight, which rely heavily on bunker fuel and diesel, slow down as trade volumes shrink. Consumer demand for gasoline and jet fuel can also wane if economic hardship leads to reduced travel and leisure activities. The retaliatory measures often taken by targeted nations – imposing their own tariffs on US goods – only serve to exacerbate this negative feedback loop, creating a tit-for-tat escalation that further erodes business confidence and global trade flows.
It is this overarching concern about a tariff-induced global economic slowdown that has been weighing heavily on oil prices since the middle of January. Market participants, from large institutional investors to commodity traders, have been pricing in the potential for significantly reduced oil consumption in the months and years ahead if these trade disputes were to escalate or become entrenched. Every new tariff announcement or threat has typically sent ripples of concern through the market, often pushing oil prices lower.
Against this gloomy backdrop, the news of an extension to the tariff deadline on EU goods, while not a resolution, acts as a momentary pause button on further immediate escalation. It offers a temporary reprieve, a brief window where the worst-case scenario of new, damaging tariffs being instantly applied is averted. This is likely why oil prices "edged higher."
The market's reaction can be interpreted in several ways. Firstly, it reflects a slight easing of immediate downside risk to the European economy. The EU is a massive economic bloc and a significant consumer of oil. The imposition of new US tariffs on key European goods, such as automobiles or luxury products, would undoubtedly have a detrimental impact on European industries, potentially tipping already fragile economies closer to recession. An extension of the deadline pushes this immediate threat further down the road, offering a sliver of hope that a negotiated solution might yet be found, or at least that the economic pain is deferred. This deferral, however slight, can lead to a marginal upward revision of short-term oil demand expectations from the region.
Secondly, the extension can be seen as a signal, however faint, that dialogue and negotiation are still possible. In the fraught world of international trade diplomacy, any indication that parties are willing to continue talking rather than immediately resorting to punitive measures can be interpreted positively by markets. It reduces, fractionally, the "uncertainty premium" that has been built into asset prices, including oil.
However, it is crucial to temper any optimism. The fact that oil only "edged higher" rather than surged indicates the market's deep-seated caution. An extension is not a cancellation. The underlying threat of tariffs remains very much on the table. The fundamental disagreements that led to the tariff threats in the first place have not been resolved. Therefore, while the immediate pressure point has been alleviated, the chronic condition of trade uncertainty persists.
The oil market is acutely aware that this extension could simply be a tactical move, buying time for political reasons without altering the fundamental trajectory of trade policy. If, at the end of the extended period, no agreement is reached and tariffs are indeed imposed, the negative impact on oil demand expectations would likely resurface with renewed force. The market is therefore likely to adopt a "wait and see" approach, with traders hesitant to make significant bullish bets based solely on a deadline postponement.
Furthermore, the US-EU trade dynamic is just one piece of a larger global puzzle. The ongoing trade tensions with China, for instance, continue to be a major drag on global growth projections and, by extension, oil demand. Progress, or lack thereof, on that front often has a more substantial impact on oil prices than developments in the US-EU relationship, given the sheer scale of US-China trade and China's role as the world's largest oil importer.
The slight rise in oil prices also needs to be seen in the context of other market-moving factors. Supply-side dynamics, such as OPEC+ production decisions, geopolitical events in major oil-producing regions like the Middle East, and fluctuations in US shale output, constantly interact with demand-side sentiment. A deadline extension on EU tariffs might provide a small boost, but it can be easily overshadowed by a surprise inventory build, an unexpected increase in OPEC production, or signs of weakening economic data from other major economies.
In conclusion, the decision by the Trump administration to extend the tariff deadline on EU goods offered a moment of temporary relief to an oil market that has been under duress from trade war anxieties. This relief manifested as a marginal increase in oil prices, reflecting a slight reduction in immediate perceived risk to global economic activity and oil demand, particularly from Europe. However, this should not be mistaken for a fundamental shift in market sentiment or a resolution to the underlying trade disputes. The threat of tariffs remains, and the broader concerns about a global economic slowdown fueled by protectionist policies continue to loom large. The oil market's cautious reaction underscores the prevailing uncertainty, suggesting that while this extension provides a brief breathing space, the path ahead for oil prices will continue to be heavily influenced by the unpredictable currents of international trade policy.

Crude oil---Buy near 70.60, target 71.90-76.00Crude oil market analysis:
Today's crude oil is still bought at a low price, and short-term bulls have started. Yesterday, gold fell in the US market, but did not fall in the Asian market, but repaired at a high level. The strong support of the daily line has reached 70.00, and the small support is 70.50. Today's idea is to find buying opportunities above 71.50. The daily moving average of crude oil is lined up, and there is still a lot of room for growth.
Fundamental analysis:
This week is a data week. Today, pay attention to the ADP employment data, which is the pre-agricultural data.
Operation suggestions:
Crude oil---Buy near 70.60, target 71.90-76.00

USOil Sell 70.000Crude oil has been fluctuating and rising recently, reaching a three-week high. From a fundamental perspective:
Supply: The United States has intensified its energy sanctions against Iran. Attacks on Saudi facilities have affected their performance. The OPEC+ will gradually lift the voluntary production cuts starting from April and may increase production for the second time in May. The 30-day ceasefire agreement between Russia and Ukraine has not been effectively implemented in substance. However, recently, the United States, Russia, and Ukraine have reached some consensus on Black Sea navigation and the protection of energy facilities.
Inventory: According to API data, for the week ending March 25, U.S. crude oil inventories dropped significantly by nearly 9 million barrels. However, commercial crude oil inventories have been increasing continuously for several weeks, and the overall inventory remains at a high level.
Geopolitics: The U.S. airstrikes against the Houthi armed group in Yemen and Israel's military operations in the Gaza Strip have heightened concerns about the disruption of crude oil supplies in the Middle East. The United States' continuous strengthening of sanctions against Iran and Venezuela also includes a plan to impose a 25% tariff on countries importing Venezuelan crude oil.
Production Increase Pressure: The daily supply increments of non-OPEC countries (such as the United States and Brazil) far exceed the global demand growth rate, which has long-term downward pressure on the oil price center.
💎💎💎 USOIL 💎💎💎
🎁 Sell@70.000 - 70.200
🎁 TP 68.5 68.0 67.5
The market has been extremely volatile lately. If you can't figure out the market's direction, you'll only be a cash dispenser for others. If you also want to succeed,Follow the link below to get my daily strategy updates

OIL Today's strategyIn the short term, there is a simultaneous advance of the long positions in crude oil. The price has tested the vicinity of $68.5 several times but encountered resistance. Moreover, after reaching around $65.2 at the lower level, it rebounded rapidly. The market still needs further testing. In the short term, it is advisable to sell high and buy low within the range of $68.5 to $65.2.
OIL Today's strategy
sell@67.5-67.9
buy:65.7-66.2
If you don't know how to do it, you can refer to my transaction.

OilU.S Oil - Crude Oil
Completed " 12345 " Impulsive Waves
Break of Structure
RSI - Divergence
Symmetrical Triangle as an Corrective Pattern in Short Time Frame
Fibonacci Level - 78.60%
