Bear Flag Formation — Downside Continuation Toward 91–88A clear bear flag has formed after a strong impulsive bearish move. Price is currently consolidating inside an ascending corrective channel, which typically represents a pause before trend continuation rather than a reversal.
After this corrective bounce, I expect a breakdown below the lower boundary of the flag and continuation of the bearish trend. The measured move of the pattern suggests a downside target in the 91–88 zone, which also aligns with a potential demand/support area.
The bearish scenario remains valid as long as price stays below the upper boundary of the flag. A decisive breakdown with momentum would confirm the setup.
Okb

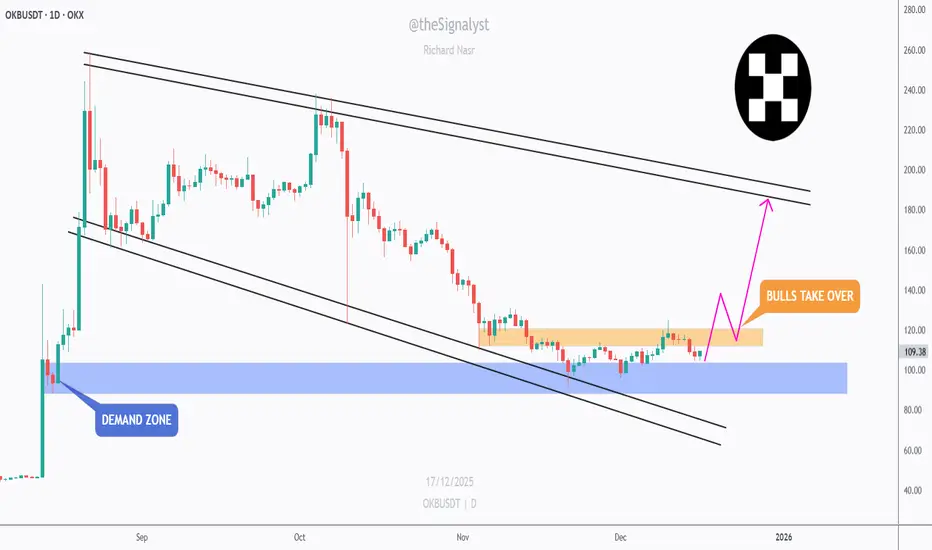
OKB - Are Bulls About to Flip the Script?📉After a prolonged corrective phase, OKB is starting to show early signs of structural stabilization. Price has respected the major demand zone, where selling pressure slowed down and downside momentum clearly weakened.
⚔️What stands out now is the tight consolidation above demand, combined with a gradual reclaim of higher levels. This type of behavior often signals a shift from distribution to accumulation, especially after a long bearish channel.
📍The key focus is the orange resistance band. A clean break and hold above this area would be a strong confirmation that bulls are taking control, opening the door for a larger recovery move toward the upper bounds of the broader structure.🏹
Until that breakout happens, patience is key. Let price prove strength before committing aggressively. But structurally, this is one of those zones where risk starts favoring the upside, not the downside.
Is this the quiet phase before expansion? 🤔
⚠️ Disclaimer: This is not financial advice. Always do your own research and manage risk properly.
📚 Stick to your trading plan regarding entries, risk, and management.
Good luck! 🍀
All Strategies Are Good; If Managed Properly!
~Richard Nasr
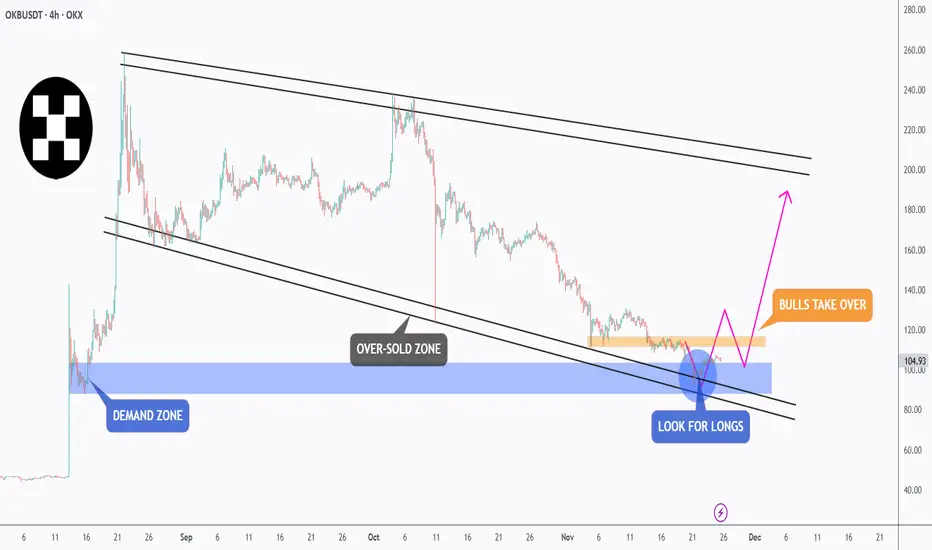
OKB - Demand Holding Strong… Correction on the Horizon?📉OKB is currently trading inside a broad falling channel , but price has just reacted from a major demand zone, which also aligns with the lower bound of the black channel. This confluence creates a strong oversold area where buyers typically step in.
⚔️As long as this demand zone continues to hold, we will be looking for bullish correction setups toward the upper bound of the falling channel. This would be the natural corrective wave after an extended sell-off.
🏹However, for the bulls to fully confirm control, price must break and hold above the orange high. A breakout above that structure would signal a shift in momentum and open the way for a larger trend reversal.
For now, demand is holding, the channel is intact, and the market is positioned for a potential rebound… will OKB deliver the correction we’re waiting for? 🤔
⚠️ Disclaimer: This is not financial advice. Always do your own research and manage risk properly.
📚 Stick to your trading plan regarding entries, risk, and management.
Good luck! 🍀
All Strategies Are Good; If Managed Properly!
~Richard Nasr
OKB - Entering the Oversold Zone!📉OKB has been steadily correcting within a descending channel , but the price is now approaching a massive confluence area, the intersection of the blue demand zone, lower black trendline, and the oversold region.
⚔️This area has historically acted as a strong accumulation zone, where buyers tend to step back in and drive the next impulsive wave. From here, I’ll be looking for long opportunities, ideally after a clear bullish confirmation or a break above the short-term red channel.
🏹If the bulls manage to defend this zone, we could see a strong push toward the upper bound of the black channel, around the $200 mark.
⚠️ Disclaimer: This is not financial advice. Always do your own research and manage risk properly.
📊All Strategies Are Good; If Managed Properly!
~Richard Nasr

OKB a Perfect example of a successful analysis Dear all;
today I have OKB, this the first time a pay attention for this coin and guess what?
when I did analysis it using my tools it did respect my analysis pretty good so far, and I expect it
to hit all the target very easily.
I did notice another opportunity within the current one as you see in the chart and the all current target (T1) is almost matching with the new one (T2).
Good Luck.

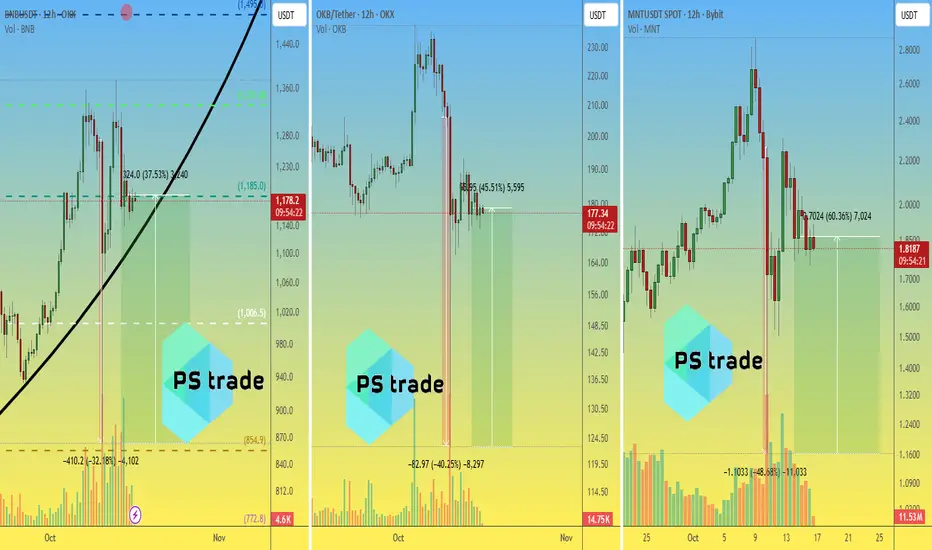
BNB (Binance) vs OKB (OKX) vs MNT (Bybit)🔥 While the whole market is trembling again ahead of Trump’s highly anticipated evening speech (19:00 UTC)…
Let’s take a look at how the tokens of the TOP-3 CEX exchanges by trading volume behaved during the “night of 10.10” — and how much they’ve bounced back 5 days later 👇
📉 Drop → 📈 Rebound (as of now):
OKX:BNBUSDT –32.2% (–$410) → +37.5% (+$324)
OKX:OKBUSDT –40.2% (–$83) → +45.5% (+$56)
BYBIT:MNTUSDT –48.7% (–$1.1) → +60.4% (+$0.7)
Seems like the market still hasn’t decided which exchange token deserves more love 💥
🤔 Who’s your favorite right now — #BNB, #OKB or #MNT ?
______________
◆ Follow us ❤️ for daily crypto insights & updates!
🚀 Don’t miss out on important market moves
🧠 DYOR | This is not financial advice, just thinking out loud
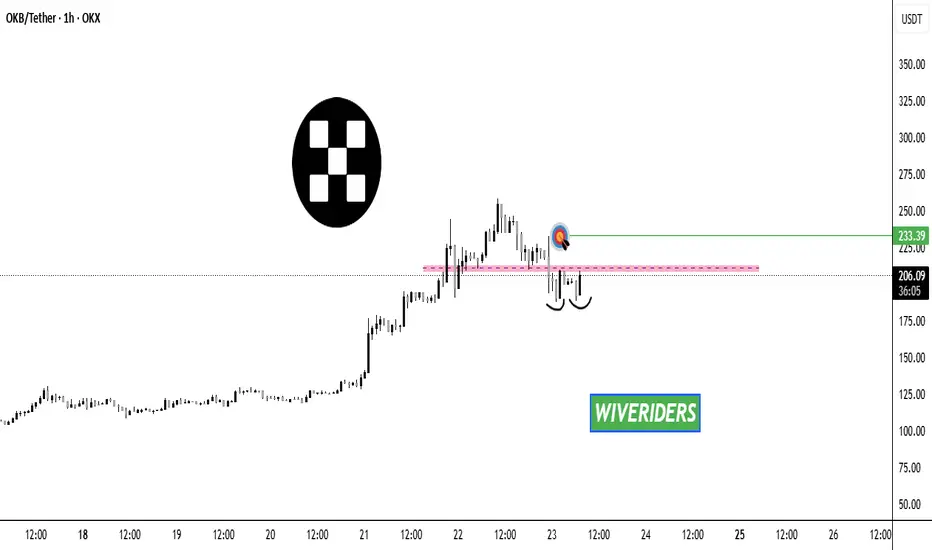
OKB Update📈 CRYPTOCAP:OKB Update
CRYPTOCAP:OKB is testing the red resistance zone — if it breaks out, the first target will be the green line level.

OKB Breakout Alert! 🚨 CRYPTOCAP:OKB Breakout Alert! 🚨
CRYPTOCAP:OKB is currently testing the red resistance zone 🔴
At the same time, price is showing a potential Double Bottom formation — a bullish reversal signal ✅
If price breaks out, the first target will be the green line level 🎯
This setup could confirm strong bullish continuation if buyers hold momentum.
#OKB Explodes +200% After Major OKX Announcements🎉 Today, the #OKX exchange threw a real party for #OKB holders!
📢 Announced & implemented:
◆ New ecosystem development strategy
◆ Network integrations & upgrades
◆ Tokenomics change — now max supply is just 21M #OKB, same as $BTC!
🚀 Result — OKX:OKBUSDT skyrocketed by +200%!
Now the price needs to "digest" the news, possibly pull back a bit (main thing — stay above $65) and find balance for further trading.
🤖 In the $65–$130 range, trading bots will definitely be accumulating positions at a "tasty" average price before the next push upward.
🎯 Targets for #OKBUSDC:
1️⃣ $180
2️⃣ $280
________________
◆ Follow us ❤️ for daily crypto insights & updates!
🚀 Don’t miss out on important market moves

OKBComprehensive OKB/USDT Analysis
🟢 Introduction:
The OKB token, native to the OKX exchange, is currently moving within a well-defined ascending channel. This analysis examines the price behavior within the channel and highlights Fibonacci targets. Precision in decision-making is crucial at this key juncture.
🔍 Technical Analysis:
1️⃣ Ascending Channel Status:
Current Movement:
The price, after hitting the midline of the ascending channel, has entered a correction phase and reached the daily support zone at $42.85 - $44.53.
Channel Significance:
The ascending channel is a critical structure for OKB. A breakout to the upside will face resistance but could trigger a strong bullish move if successful.
2️⃣ Possible Scenarios:
A. Bullish Scenario (Resistance Breakout):
Key Resistance Zone: $59.52 - $68.95
Fibonacci Targets in the Ascending Channel:
1.618 Level: $95.15 - $113.84
2.272 Level: $145.12 - $173.63
2.618 Level: $192.96 - $230.87
Sharp Movement:
A breakout above the channel could lead to a rapid and powerful move toward higher targets.
B. Bearish Scenario (Resistance Rejection):
If the price fails to break the red resistance zone, a decline toward the channel bottom and the gray support zone ($32.07 - $35.57) becomes likely.
3️⃣ Relative Strength Index (RSI):
Current Position: RSI is within a descending channel, sitting near its midline.
Bullish Potential: Support at this level could strengthen the move toward the channel’s top and higher targets.
📌 Recommended Entry Points:
Safest Entry: After a breakout above the red resistance zone ($59.52 - $68.95) and price consolidation above it.
Stop Loss: Below the gray support zone ($32.07 - $35.57).
Volume Confirmation: A valid breakout must be accompanied by an increase in buying volume. Breakouts without volume confirmation are likely to be false.
⚠️ Key Risk Management Tips:
Stop Loss: Ensure stop-loss orders are placed within the suggested zones.
Confirmation: Wait for a valid breakout and price stabilization before entering a trade.
Capital Management: Adjust trade size based on the sensitivity of the analysis to effectively manage risk.
✨ Final Conclusion:
Bullish Scenario:
If RSI support holds and buying volume increases during the resistance breakout, the price may move toward higher Fibonacci targets.
Bearish Scenario:
Failure to break the resistance could lead to a price drop toward the channel’s bottom and the gray support zone.
📊 Recommendation:
To minimize risk, only enter trades after observing a valid breakout and price stabilization in key zones. Decisions based on volume confirmation and breakout validations are crucial in this analysis.
🌟 Note:
This analysis is based on current market data and requires continuous monitoring for updates.

TradeCityPro | OKB: Uptrend in HWC with Fresh Bullish Momentum👋 Welcome to TradeCityPro!
In this analysis, I want to examine the coin OKB, the official cryptocurrency of the OKX exchange, one of the world's largest exchanges. Currently, with $4 billion in daily spot trading volume and $34 billion in futures, it ranks fourth among crypto exchanges globally.
📅 Weekly Timeframe: Long-Term Ascending Structure
In the weekly timeframe, we are witnessing a long-term uptrend in a High Wave Cycle (HWC), which has been evident since the coin's launch, moving within an ascending channel. Initially, the price moved to a resistance at $33.45, and after breaking this level, it created a new high at $67.87 and has pulled back to $33.45 once.
🔍 Currently, the price is in a range between $33.45 and $67.87. After reaching $33.45, this area aligned with the channel's lower trend line, and considering the proximity to the 0.382 Fibonacci level, it formed a very strong Potential Reversal Zone (PRZ), propelling the price upward again. The price is now moving towards $67.87, a strong supply area and the coin's all-time high (ATH) resistance.
🚀 If this area is broken, the price could potentially move towards $110 and $230, targets based on Fibonacci levels. With a market cap of $3.5 billion, if this project enters the top 20 and pushes its market cap above $10 billion, these targets could be easily reached. Entry into overbuy conditions on the RSI could assist in reaching these targets.
🔽 If the price corrects further and breaks below $33.45, the next areas would be the 0.618 and 0.786 Fibonacci levels. However, if $33.45 is broken, it could introduce a strong bearish momentum into the market, possibly turning the HWC into a bearish trend.
📅 Daily Timeframe: Reintroduction of Bullish Momentum
In the daily timeframe, we are observing a momentum shift starting from the price reaction at $33.45. After breaking $43.33, more volume and momentum entered the market, and the price has since pulled back to the SMA99 twice.
👀 Today’s candle is a large green one, approximately 20% in size, reaching up to resistance at $62.01. If the RSI enters overbuy conditions and $62.01 is broken, the price could move towards $72.68. If this resistance is also broken, as mentioned, the price could register new ATHs. In addition to the targets outlined in the weekly timeframe, the middle line of the ascending channel could serve as a new target.
🧩 For now, I see no signs of a trend reversal and suggest if you hold this coin and are in profit, keep it as long as the price stays above the channel's lower line. A break below 50 on the RSI could increase the likelihood of this scenario unfolding.
⏳ 4-Hour Timeframe: Futures Triggers
I've discussed various scenarios in higher timeframes, and in this timeframe, I want to outline just the futures triggers.
🔼 For long positions, first, I must note that since the RSI is in overbuy territory, I personally prefer not to open a long position and wait until this oscillator returns to a normal range. Then, wait for the price to stabilize above $60.67 before opening your position, with a potential target of $72.68.
🔽 For short positions, I recommend not opening a short on this coin due to the clearly bullish trend seen in the weekly and daily timeframes. If you insist on shorting, breaking supports at $51.30 and $45.21 could serve as triggers, but as mentioned, I will not be joining you in this as it goes against the main market trend.
📝 Final Thoughts
This analysis reflects our opinions and is not financial advice.
Share your thoughts in the comments, and don’t forget to share this analysis with your friends! ❤️

OKB | The Best Crypto Exchange token The price of OKB is 53 today with a 24hour trading volume of 144 million dollar . This represents a 13% price increase in the last 24 hours and 170% since last year
bear market is the best time to assessment and judge crypto projects and exchanges now lets look at Performance of cryptocurrency exchange platform coins in the past 360 days
OKB -8%
BNB -20%
HT -58%
CRO -82%
FTT -95%
OKB is a cryptocurrency released by the OK Blockchain Foundation and Maltese crypto exchange, OKEx.The OKB token plays an important role in the OKEx ecosystem, It allows users to receive up to a 40% discount on transactions The OK Exchange is one of the largest in the world and currently ranks third in liquidity, fourth in trading volume, and provides a wide selection of trading pairs. OKEx has become a world-leading trading floor since its launch in 2017.Jay Hao joined OKEx as CEO from the beginning, and he still holds the position. long story short the team and founders are pros.
the daily vol and most indicators are bullish and positives and Okb is ready for higher targets like 55 and 57$

Approaching the resistance levelsThe price of OKB is around $42, approaching the resistance levels of $43 and $43.50. If the $43.50 resistance level is sustainably broken, it is expected that the upward trend will continue to higher levels.
Otherwise, there is a likelihood of the price retracing to the support levels of $42 and $41.50.

OKBokb technical analysis basically on elliott waves Principls and priceaction strategies
okb can be make a sharp wave to 90$
wait and watch

Formation of the TriangleOKB has recently formed a triangular pattern, where the upper side of the triangle is highlighted with black lines and has successfully broken upwards.
Based on this breakout, new price targets have been determined. Additionally, the lower side of the triangle is considered as an ascending trendline, serving a supportive role.
Currently, the price is moving according to the analysis performed.
However, the continuation of reaching the set targets depends on maintaining the ascending trendline. If, for any reason, this trendline breaks, the upward trend could halt, and the price might fall to the red line, which serves as another support line. Maintaining this trendline is crucial to prevent significant changes in the price trend.

OKB/BTC - Relative Strength & an upcoming opportunity What Altcoin has outperformed BTC by 1000% since February 2021? CRYPTOCAP:OKB Token from the OKX Exchange.
Potential Set Up in coming months
- Break out of the falling wedge
- Bounce from the lower diagonal support
Both to me offer entry points with defined stop loss's under the both trend lines. Lets keep an eye.
OKX is one of the few exchanges that also operates from Malta in Europe under MICA regulations and is possibly one of the only alts/exchange alts demonstrating relative strength against BTC.
PUKA

Key Support LevelOKB has recently reached its peak on February 13th, indicating a possible trend reversal or correction.
The overall trend remains bullish, supported by an ascending trend line. Current price corrections could extend to the ascending trend line and the 0.786 Fibonacci support level.
This analysis is for guidance only and shouldn't be taken as direct trading advice.

OKB (OKB) OKB is a cryptocurrency released by the OK Blockchain Foundation and Maltese crypto exchange, OKEx. The exchange is one of the largest in the world and currently ranks third in liquidity, fourth in trading volume, and provides a wide selection of trading pairs. OKEx is similar in many aspects to the cryptocurrency exchange giant Binance, but there are a few key differences. The OKEx platform has its own cloud mining service, and the company has a more focused reach in providing options trading for users. Meanwhile, Binance strives to offer a broad range of crypto services globally
After Ht , OKB is another exchanges token were green for three weeks and trying to breaks its down trend but as you can see it moves in couple of arcs, the first big resistance for okb is 23
tp 17.9 , 18.3 , 18.9 , 20 , 21
sl 14.5 , 14
which exchange token got the biggest gain potential in a long term and why?

OKB: $28 | Gateway to Metaverse with Facebook Re Branding Oct 28Binance re positioned itself as a Platform instead of being a Broker
FTX as underwiter packager and handler of next big thing in the space
OKB is focused to corner and rule the metaverse gaming and nft sector with the CEO taking the lead

OKBUSDT Fibonacci RevelationOKBUSDT is currently showcasing a promising bounce from the 78.6% Fibonacci support level, aligning perfectly with the downtrend trendline's breakout point.
The overarching sentiment leans bullish, and it appears the continuation of the uptrend is on the horizon.
Given the current price dynamics, this might present a favorable risk-reward buying scenario. However, we're approaching this with a touch of caution.
In terms of upward aspirations, we're eyeing a peak close to the extended ascending channel's upper edge.

OKBUSDTOKX:OKBUSDT SHORT
⚠️Note:
In this type of signals, only the entry point and trade direction are specified, and stop loss and target are not determined.
If you are interested in entering these signals, please provide a stop loss and a logical market-based target.
⛔"Daily crypto market analyses I provide are personal opinions & not financial advice. Trading carries risks, so do your own research & seek advisor's help.#DYOR"
Don't forget to like and comment

OKBUSDTHello
I don't want to talk about everything but everything is obvious on the other hand the market needs rest and waiting for other new traders!

OKBUSDT's Breakout Navigating the Potential for 90% UpswingBullish Transition:
💎The #OKX Exchange's utility token made a decisive break above its long-standing supply zone in February, firmly positioning itself in bullish territory ever since. This wasn't just a fleeting moment; it marked a significant shift in its trading dynamics.
Navigating the Zones:
💎Over the past six months, #OKBUSDT has been navigating between a $57 resistance and a $38 support. Intriguingly, what was once a supply zone has transformed into a demand zone, evidenced by two prominent rebounds.
Recent Price Movements:
💎Recent price movements respect the upward trendline on the logarithmic 3Day chart, overcoming a minor resistance with bullish determination. This pattern increasingly suggests we're on the cusp of a pivotal moment, potentially leaning towards an upward breakout.
Potential Upward Trend:
💎However, all eyes are on the descending trendline and the price behavior around it. If the bulls manage to breach this barrier, we could anticipate a continuation of the upward trend, aiming for the $73 dual Fibonacci resistance level. This scenario would represent a nearly 90% price ascent from the current demand zone.
Bearish Possibilities:
💎For any bearish undertones to emerge, the demand zone needs to be decisively compromised. Until such a shift, the narrative remains predominantly bullish. As of now, our focus is on the minor support around the $47 mark. Stay vigilant, Paradisers, and keep pace with the ever-evolving crypto landscape!
