OMUSDT Forming Falling WedgeOMUSDT is forming a clear falling wedge pattern, a classic bullish reversal signal that often indicates an upcoming breakout. The price has been consolidating within a narrowing range, suggesting that selling pressure is weakening while buyers are beginning to regain control. With consistent volume confirming accumulation at lower levels, the setup hints at a potential bullish breakout soon. The projected move could lead to an impressive gain of around 90% to 100% once the price breaks above the wedge resistance.
This falling wedge pattern is typically seen at the end of downtrends or corrective phases, and it represents a potential shift in market sentiment from bearish to bullish. Traders closely watching OMUSDT are noting the strengthening momentum as it nears a breakout zone. The good trading volume adds confidence to this pattern, showing that market participants are positioning early in anticipation of a reversal.
Investors’ growing interest in OMUSDT reflects rising confidence in the project’s long-term fundamentals and current technical strength. If the breakout confirms with sustained volume, this could mark the start of a fresh bullish leg. Traders might find this a valuable setup for medium-term gains, especially as the wedge pattern completes and buying momentum accelerates.
✅ Show your support by hitting the like button and
✅ Leaving a comment below! (What is your opinion about this Coin?)
Your feedback and engagement keep me inspired to share more insightful market analysis with you!
OMUSDT

$OM MANTRA coin analysis Hi 👋🏻 it's me your " Raj_crypt0 " ..... 💚
will BINANCE:OMUSDT next KRAKEN:LUNAUSD
" Yes , I hope so - 90% new High not possible
I hope it's not possible "
coin already got squeezed at $5/5.5 in weekly to 3 month time frame as weakness we can observe
Upcoming downtrend 📉 target 🎯 is - $0.1
$0.1 / 0.0875 ...... 🎯 Support 💪🏻 let me meet u there 😂
" U have a question ⁉️ does ' alts season ' & ' BULL RUN ' completed - obviously 🙄 ' NO ' "
CRYPTOCAP:TOTAL haven't reached 5T 🎯 - still season was around corner
" Some coins complete early bull , some late _&_ some on time " nothing much ✔️

Where Can We Rebuy OM? (1W)After the heavy drop, it became evident that a bearish trend had started, and the price is now seeking high-liquidity (buy) zones.
Based on the chart, the green zone stands out as the best area for a potential rebuy — it could launch the price upward by 100% to 500%.
Reaching this zone may take several weeks or even months.
A weekly candle closing below the invalidation level would invalidate this outlook.
For risk management, please don't forget stop loss and capital management
Comment if you have any questions
Thank You

700% Potential: $OMUSDT at Key Support.The NASDAQ:OM chart shows price testing a key support zone around 0.2195, with a huge upside potential if it holds.
A 700% gain could be possible, targeting 1.6165.
Watch for confirmation above this level before jumping in.
DYOR, NFA

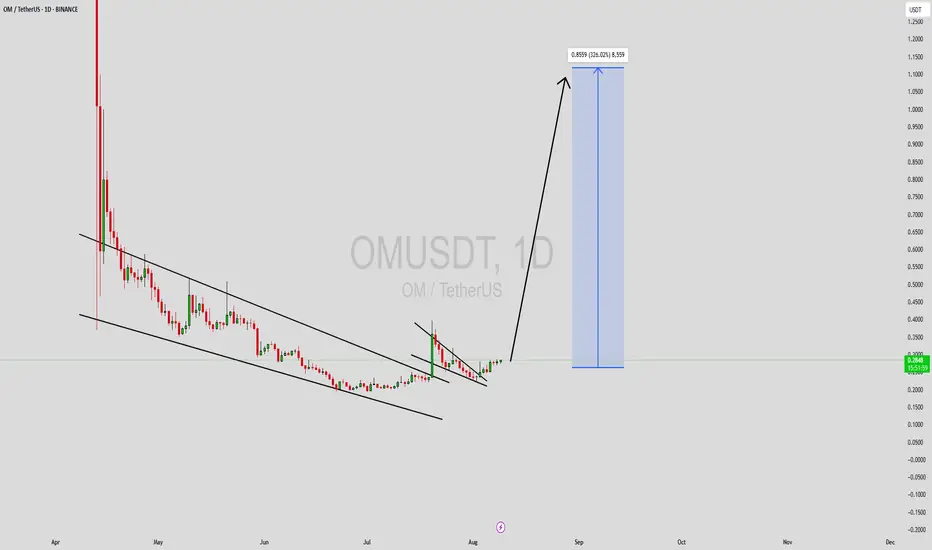
OMUSDT Forming Descending ChannelOMUSDT (OM / TetherUS) is currently showing a textbook descending channel breakout on the daily chart. After a steep downtrend, price has formed a tightening channel and is now pushing upward—signalling a potential major reversal. The breakout is supported by solid volume, suggesting accumulation and renewed investor confidence.
This technical foundation comes amid an asset that has suffered a deep correction—down over 90% from its all-time high. Despite this, OM still maintains interest thanks to ongoing development and a committed team working toward recovery. In that context, the current wave of momentum offers a compelling high-reward opportunity.
Analysts tracking the setup note that a confirmed channel breakout could lead to an explosive move—potentially targeting 290% to 300% gains from current levels, given the absence of nearby resistance and the strength of the impulse wave already in motion.
In summary:
* A descending channel has broken, signaling a potential trend reversal.
* Good volume validates the strength behind this move.
* OM remains a speculative but high-upside candidate—as long as investors are cautious of its volatile history.
This setup is ideal for breakout-focused traders with high risk tolerance and a structured plan.
✅ Show your support by hitting the like button and
✅ Leaving a comment below! (What is Your opinion about this Coin)
Your feedback and engagement keep me inspired to share more insightful market analysis with you!
OM / USDT : Breaking out from Trendline resistanceOMUSDT has broken above a descending trendline on the 4H timeframe after multiple rejections in recent weeks. This breakout could signal a shift in momentum from bearish to bullish.
If price holds above the breakout level around 0.262, the next potential target lies near 0.31, representing an estimated 19% upside from current levels.
Key points:
Timeframe: 4H
Setup: Descending trendline breakout
Breakout level: ~0.262
Target: ~0.31 (+19%)
Stop loss: Below breakout level to manage risk
As always, wait for confirmation and manage risk appropriately before entering a trade.

OM Prepares Recovery Catastrophic Crash · 2,000% Easy PotentialMantraDAO (OM) performed a catastrophic crash in April and the bottom was hit in June. Keep in mind that it doesn't matter how hard a project crashes, it tends always to recover.
Once upon a time Solana produced a major, major crash and people started to run away. I saw this as an amazing opportunity and recommend buy for Solana when it was below $20 and guess what happened next? Solana is today one of the top performers.
When a project produces a very strong crash, for one reason or the other, it tends to recover strongly at the next market cycle. The action tends to move back to the previous high or the baseline.
OMUSDT found support exactly where there was a stop in February 2024. The launchpad for the final leg-up of the previous bullish cycle. When I saw this same level activated perfectly, it called my attention. What do you see?
Resistance (the last high) turns into support. Support (February 2024) stays support. Long-term support tends to work over and over and here we have a long-term one.
The action short-term has already many of the classic reversal signals. After the main drop in April we had some lower lows as an ending diagonal. Then the main low is followed by a higher low, rising volume and marketwide action heating up.
It is here...
We are here...
It is happening now...
Crypto is going up.
Prepare for the ride, prepare for the profits and prepare for the fun.
It will be wild... You will be extremely happy with the results.
MantraDAO is set to grow.
Buy when prices are low.
Namaste.

OM (SPOT)BINANCE:OMUSDT
#OM/ USDT
Entry range (0.2360- 0.2460)
SL 4H close below 0.02287
T1 0.32
_______________________________________________________
Golden Advices.
********************
* collect the coin slowly in the entry range.
* Please calculate your losses before the entry.
* Do not enter any trade you find it not suitable for you.
* No FOMO - No Rush , it is a long journey.

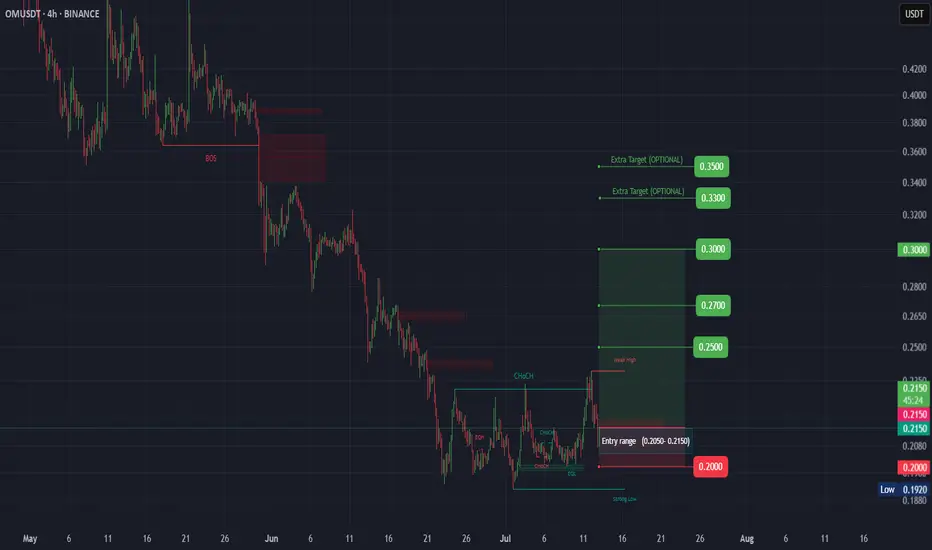
OM (SPOT)BINANCE:OMUSDT
#OM/ USDT
Entry range (0.2050- 0.2150)
SL 4H close below 0.02000
T1 0.25
T2 0.27
T3 0.30
_______________________________________________________
Golden Advices.
********************
* collect the coin slowly in the entry range.
* Please calculate your losses before the entry.
* Do not enter any trade you find it not suitable for you.
* No FOMO - No Rush , it is a long journey.
$OM/USDT Ready for Breakout?BINANCE:OMUSDT has been stuck in a downtrend for weeks, but things are getting interesting.
It’s now forming a falling wedge, a pattern that often signals a strong bounce is coming.
If it breaks out with good volume, we could see a sharp move up toward the $0.59–$0.65 zone, which is nearly 180% from here.
But if it drops below the wedge, that setup gets invalidated.
DYRO, NFA

$BTC/USDT 1D UpdateBitcoin Aescending broke out above the key $104k, $110k zone, flipping it into support.
With strong bullish momentum, the next target is around $152k.
As long as it holds this level, upside remains in play.
DYRO, NFA

MantraDAO Easy 810% Target —Sell High, Buy Low!Just as selling and profit taking happens naturally when prices trade high near a new All-Time High, buying also happens naturally at support.
OMUSDT was trading at a new All-Time High in February 2025 and smart traders and holders took profits. This taking profits results in a long-term higher low and a new buy-opportunity.
Always remember, never buy when prices are high up or after a strong bullish wave. Why? Because whales tend to sell when prices are high. Only buy when prices are low.
OMUSDT is trading pretty low right now compared to February 2025. We had 96% correction, but the correction bottom is still a very strong higher low compared to the start of the bullish cycle and wave. After the correction is over, which in this case is early May, we will have a new growth wave.
Easy target can be seen on the chart as 810%.
It can go higher and this is a new All-Time High. We are going with the easy target for this one. An easy trade.
Namaste.

$CHILL/USDT Trade SetupPrice is bouncing off a key demand zone + ascending trendline on the 1H chart, showing strong bullish structure. 📈
- Entry Zone: CMP
- Stop Loss: $0.09114
- Targets:
• TP1: $0.1070
• TP2: $0.1150
• TP3: $0.1187
As long as price holds above the trendline and demand zone, upside targets stay valid. Break below SL kills the setup.
DYOR, NFA

$XRP Breakout Alert!CRYPTOCAP:XRP Breakout Alert!
XRP has broken out of a long-term falling wedge on the daily chart
This classic bullish reversal pattern could drive price toward the $4.50 zone, nearly +89% upside from here! 👀
As long as it holds above the breakout zone, momentum looks strong

$LINK 6H Chart AnalysisBIST:LINK 6H Chart Analysis
LINK is retesting the breakout zone from the ascending triangle.
Price is holding above key support around $16.20.
A bounce here could ignite a move toward the $22.85 target.
- Entry: CMP
- TP: $22.85/ $19.23 / 21.32
- SL: $15.26
Bullish continuation likely if support holds!
DYRO, NFA

$XLM BREAKOUT ALERTCRYPTOCAP:XLM BREAKOUT ALERT 🚀
XLMUSDT just broke out of its multi-month descending channel on the 2D chart!
A clean close above resistance opens the door to a potential 150 %+ move toward the $0.77 zone 📈
The chart structure looks bullish, and momentum is picking up fast.
Watch for continuation 👀
DYRO, NFA

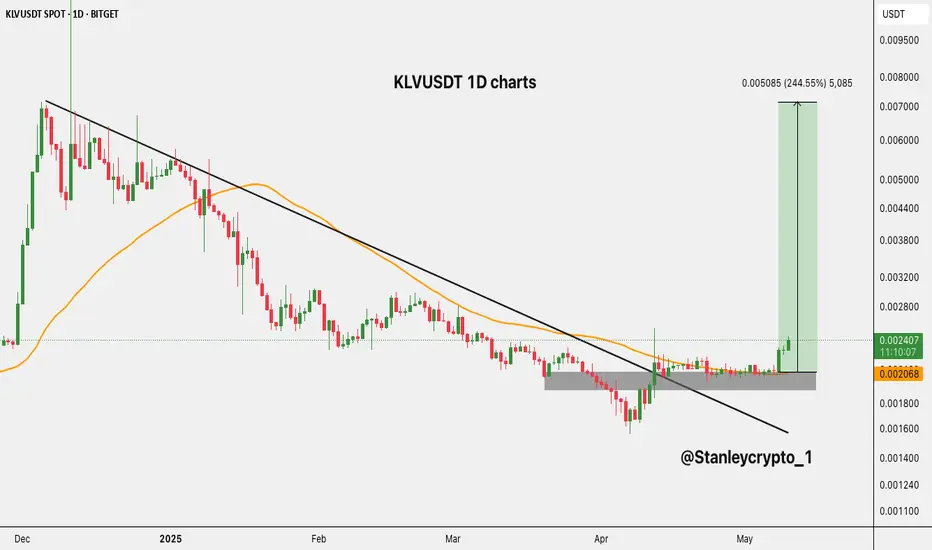
$KLV Breakout Alert!$KLV Breakout Alert!
Klever $KLV has officially broken out of its long-term downtrend line on the daily chart!
After months of consolidation in a tight accumulation zone, bulls have stepped in hard.
- Clean breakout from descending resistance
- Strong base formed around $0.00195–$0.00206
- Potential upside target: $0.007500 +244%
This move looks explosive.
Watch closely for continuation! DYRO, NFA
$Ethereum Weekly Outlook Ethereum Weekly Outlook 🔥
CRYPTOCAP:ETH just bounced hard from the macro trendline key demand zone
- Now reclaiming the $2,350 level is a strong bullish signal.
- The next major resistance sits at $4,800.
- The path looks bullish if we hold this zone.
Accumulate smart.

$BTC support zoneCRYPTOCAP:BTC has broken out of a falling wedge and is now consolidating above the key $91K support zone.
- Eyes are now on the All-Time High at $ 109 K.
- Once that breaks, a price discovery rally toward $ 120k+
It is highly likely. 🧠
- The chart looks.
DYRO, NFA

$INJ Breakout Alert!CRYPTOCAP:INJ breakout alert!
-It finally broke above the downtrend line after months of
consolidation.
-Retest and holding the key support zone around $8.50–
$9.00.
-Now, we are aiming for the next leg toward $26, a
Potential 184% move.
-Trend shift confirmed. Watch closely!🚀
DYRO, NFA

FINAL LEG OF THE ZIGZAG CORRECTION ?Yello, Paradisers! Are we about to see the end of this correction, or is there still one more shakeout coming? Let’s break it down.
💎The market is currently unfolding within a Zigzag Correction (A-B-C) pattern, and we appear to be in Wave C the final leg of this structure. Wave A has already played out with a sharp downward move, followed by Wave B, which acted as a countertrend rally. Now, Wave C is in progress, forming the last phase of this corrective cycle.
💎Since this is a 5-3-5 Zigzag Correction, the third wave of Wave C has already developed, meaning the market is nearing a critical Demand Zone at 4.0283. This level is a strong support zone where a potential reversal could occur. If the price reacts positively from this area, it could mark the end of the correction and signal the beginning of a new bullish phase, starting Wave 1 of the next uptrend.
💎However, if the price remains trapped between the Moderate Support and Moderate Resistance zones, we may see an extended period of sideways consolidation before any decisive move. A key confirmation to watch is the RSI approaching oversold conditions, which would indicate that downward pressure is weakening and the probability of a bullish reversal is increasing.
As always, Paradisers, the key to profiting in this market is waiting for high-probability setups. If this correction is indeed ending, the next move could be explosive. Stay sharp, stay disciplined, and trade smart!
MyCryptoParadise
iFeel the success🌴

omIt's weekly
It can be checked here but be careful
Because it can't hold itself, the blue lines are the next point

After a -90% Dump, MANTRA(OM) Finds Support!!!Today, I want to analyze the MANTRA ( BINANCE:OMUSDT ) projec t for you, which fell by more than -90% on April 13 .
What is MANTRA(OM)?
MANTRA (OM) is a DeFi + RWA (Real World Assets) focused project aiming to bring real-world assets like real estate and bonds on-chain. Built with the Cosmos SDK, it’s developing a purpose-built layer-1 chain to facilitate tokenization and institutional adoption of RWAs.
The main crash reasons:
Massive forced liquidations on exchanges
90% of the token supply reportedly held in a single wallet
Rumors of a rug pull (which the team denied)
Team Response:
MANTRA’s team has launched an internal investigation
Plans for buybacks and token burns are underway
They reassured the community that team tokens remain locked and untouched
-----------------------------------
Technical Analysis:
Now let's take a look at the MANTRA(OM) chart on the 1-hour timeframe .
After the fall on April 13, MANTRA(OM) reacted to the Heavy Support zone($0.45-$0.20) and started to rise again (upward correction) .
From the perspective of Elliott Wave theory , MANTRA(OM)'s big fall can be considered as a main wave 3 , and it seems that MANTRA(OM) is completing a main wave 4 . The main wave 4 could be a Double Three Correction(WXY) . Since the momentum of the main wave 3 was high, there is a possibility that main wave 5 will be a Truncated type .
I expect MANTRA(OM) to start rising from the Potential Reversal Zone(PRZ) and rise to at least $0.76(+30%) ( First Target ) and then attack the Resistance zone($1.10-$0.84) ( Second Target(+60%) ).
Do you think the MANTRA(OM) project can return to its good days?
Note: If the MANTRA(OM) falls below $0.500(Round Number), we can expect further declines.
Please respect each other's ideas and express them politely if you agree or disagree.
MANTRA Analyze (OMUSDT), 1-hour time frame.
Be sure to follow the updated ideas.
Do not forget to put a Stop loss for your positions (For every position you want to open).
Please follow your strategy and updates; this is just my Idea, and I will gladly see your ideas in this post.
Please do not forget the ✅' like '✅ button 🙏😊 & Share it with your friends; thanks, and Trade safe.
