Bitcoin Playbook: 115k Reclaim or 110.8k Breakdown__________________________________________________________________________________
Market Overview
__________________________________________________________________________________
Bitcoin is consolidating after a leverage flush, basing near 110.8–111.3k while rallies stall below 114.8–115k.
Momentum: 📉 Mild bearish intraday tone within a broader range; sellers capping under 115k as 111k still absorbs.
Key levels:
• Resistances (1D/12H): 113.8–115k, 118k, 123–126k
• Supports (1D/12H): 110.8–111.3k, 108–109k, 100k
Volumes: MODERATE across TFs; look for spikes to validate any break.
Multi-timeframe signals: 1D/12H = neutral→down; only 6H shows a tactical buy; intradays (4H/2H/1H) lean lower within the range.
Risk On / Risk Off Indicator: neutral buy — a light tailwind that aligns with range context but stops short of a strong buy.
__________________________________________________________________________________
Trading Playbook
__________________________________________________________________________________
Strategic stance: post-reset range; stay tactical and level-driven, with a cautious bias until 115k is reclaimed.
Global bias: Neutral-to-cautious below 115k; invalidate on clean acceptance/daily close above 114.8–115k.
Opportunities:
• Confirmed long: Reclaim/hold 114.8–115k → target 118k, then 123–126k on volume confirmation.
• Defensive long: Hold 110.8–111.3k with bullish close → target 113.5–115k.
• Tactical short: Fade 114.8–115k or short breakdown <110.8k → target 109k/108k.
Risk zones / invalidations:
• Acceptance below 110.8k → invalidates defensive longs, opens 109k then 108k/100k.
• Acceptance above 115k → invalidates range fades, opens 118k.
Macro catalysts (Twitter, Perplexity, news):
• Fed “higher for longer” and data dependence → caps upside momentum.
• U.S.–China tension chatter; firmer Treasuries and bid gold → caution.
• Spot ETF 7d inflows positive → tailwind if 111k holds.
Action plan:
• Long (reclaim 115k): Entry ~115.0k / Stop ~113.5k / TP1 118k, TP2 123k, TP3 126k / R:R ~1:2–1:3.
• Long (111k hold): Entry ~111.1k / Stop ~110.4k / TP1 113.5k, TP2 115k, TP3 118k / R:R ~1:2.
• Short (break <110.8k): Entry ~110.6k / Stop ~111.6k / TP1 109k, TP2 108k, TP3 105k / R:R ~1:1.5–1:2.
__________________________________________________________________________________
Multi-Timeframe Insights
__________________________________________________________________________________
Higher timeframes stay range-bound and cautious while intradays lean bearish until 115k is reclaimed.
1D/12H: Base at 110.8–111.3k capped by 113.8–115k; a daily close above 115k would unlock 118k. Volumes are moderate → need confirmation.
6H: Active demand at 110.8–111.3k with a tactical buy read; room to rotate toward 113.5–115k if support holds.
4H/2H/1H/30m/15m: Lower‑timeframe sellers fade rallies; best risk points are fades under 113.5–115k or contrarian buys on sweeps/holds at 111k.
Key divergences: Risk-on tailwind vs cautious higher‑TF filters; this tempers conviction and emphasizes strict invalidations.
__________________________________________________________________________________
Macro & On-Chain Drivers
__________________________________________________________________________________
Macro is mixed (hawkish Fed, geopolitics) while spot ETF flows add a modest tailwind; on-chain suggests a post‑flush reset regime.
Macro events: Fed “higher for longer” with data dependence; renewed U.S.–China tension; firmer Treasuries and bid gold — a cautious mix for risk.
Bitcoin analysis: BTC underperforms broader risk despite visible absorption at support; key zones align at 110.8–111.3k and 114.8–115k/118k.
On-chain data: Large deleverage behind, funding normalized; sustained recovery needs spot demand and persistent ETF inflows.
Expected impact: Neutral bias with a slight tailwind; technical confirmation above 115k is needed to unlock 118k+.
__________________________________________________________________________________
Key Takeaways
__________________________________________________________________________________
BTC is consolidating on higher‑timeframe support while 115k caps rallies.
- Trend: neutral to mildly bearish until 115k is reclaimed.
- Top setup: confirmed reclaim of 114.8–115k → 118k, then 123–126k if volume expands.
- Macro driver: positive 7d spot ETF inflows cushioning downside amid a hawkish Fed.
Stay patient and disciplined: let price confirm above 115k or below 110.8k before pressing risk.
Onchain

BTC: 120.6k under pressure — Reclaim 121.5k or 120k next?__________________________________________________________________________________
Market Overview
__________________________________________________________________________________
BTC is cooling below 124.5k–126.2k after the ATH, ranging inside 120.6k–124.5k. The HTF structure remains bullish while intraday dips toward a key execution pivot.
Momentum: 📉 Intraday corrective move within an HTF uptrend, probing the 120.6k pivot that will decide the next leg.
Key levels:
- Resistances (4H–W): 121.5k (4H/1H pivot), 124.5k–126.2k (W/ATH).
- Supports (1H–D): 120.6k (240 pivot), 120.0k (intraday psych), 117.0k (D pivot/high turned support).
Volumes: HTF normal; 4H–1H moderate; 30m–15m very high (execution catalysts).
Multi-timeframe signals: 1D/12H/6H in Up; 4H→1H correcting into 120.6k; 15m shows a tactical BUY, only valid if the pivot holds.
Risk On / Risk Off Indicator: Overall NEUTRE ACHAT — daily constructive, intraday neutral/contrarian — aligns with the HTF uptrend but requires reclaim above 121.5k to confirm.
__________________________________________________________________________________
Trading Playbook
__________________________________________________________________________________
Dominant trend is up but in a pullback: favor buys on reclaim above pivots; treat shorts as tactical with tight risk.
Global bias: NEUTRE ACHAT while holding/reclaiming 120.6k; major invalidation on a D close < 117k.
Opportunities:
- Buy the reclaim > 121.5k and hold, targeting 122.7k then 124.5k.
- Confirmed breakout above 124.5k (retest holds) toward 126.2k and beyond.
- Tactical sell on break/retest-fail of 120.6k or clean rejection at 124.5k–126.2k.
Risk zones / invalidations:
- Confirmed loss of 120.6k opens 120k then 117k (invalidates intraday longs).
- Break and hold > 126.2k invalidates tactical shorts.
Macro catalysts (Twitter, Perplexity, news):
- Record T-bill issuance (“Treasury Twist”) → potential liquidity headwind.
- Strengthening USD (DXY) → near-term cap on BTC topside.
- Bitcoin ETFs: sustained inflow streak (8 straight days) → tailwind for clean breakouts.
Action plan:
- Long (reclaim pivot): Entry 120.8k–121.2k after close > 121.5k / Stop < 120.6k / TP1 122.7k, TP2 124.5k, TP3 126.2k / R:R ~1.8–2.5.
- Short (counter-bias): Entry on close < 120.6k + failed retest / Stop > 121.5k / TP1 120.0k, TP2 118.8k, TP3 117.0k / R:R ~1.6–2.2.
__________________________________________________________________________________
Multi-Timeframe Insights
__________________________________________________________________________________
Overall higher timeframes remain constructive, while lower timeframes correct into a high-volume pivot.
1D/12H/6H: Uptrend above 117k; consolidation beneath 124.5k–126.2k. A clean daily close above 124.5k unlocks a run at the ATH.
4H/2H/1H: Corrective drift into 120.6k with moderate volumes; reclaiming 121.5k would be the first tell for a push to 122.7k then 124.5k.
30m/15m: Very high volumes at 120.6k; micro BUY (15m) only actionable if the pivot holds and 121.2k/121.5k are reclaimed on rising volume.
Divergences/confluences: Bullish confluence if 120.6k holds + daily Risk On / Risk Off Indicator stays supportive; bearish if strong sell volume appears below 120.6k without responsive bids.
__________________________________________________________________________________
Macro & On-Chain Drivers
__________________________________________________________________________________
Macro remains broadly risk-on, yet USD strength and liquidity headwinds could cap upside until technical reclaims materialize.
Macro events: Dovish-leaning FOMC minutes (cut bias), data delays (shutdown) → lower visibility; record T-bill issuance and a stronger USD → near-term headwinds.
Bitcoin analysis: Post-ATH consolidation 120k–124k; 117k holds as HTF support; BTC dominance elevated — consistent with “debasement” hedges.
On-chain data: Sustained spot ETF inflows (8-day streak); high share of supply in profit with contained realized profits; rising IV, neutral skew, call-tilt — constructive but more sensitive to shocks.
Expected impact: Institutional flows support the NEUTRE ACHAT bias if 120.6k holds and 121.5k is reclaimed; otherwise, USD + “Treasury Twist” favor a probe of 120k/117k on technical weakness.
__________________________________________________________________________________
Key Takeaways
__________________________________________________________________________________
Structurally bullish market, testing the 120.6k pivot with amplified intraday volume.
- Trend: bullish HTF; corrective intraday until 121.5k is reclaimed.
- Top setup: buy the reclaim above 121.5k toward 122.7k/124.5k; plan B is a tactical short below 120.6k toward 120k/117k.
- Macro: ETF inflows are a tailwind, while USD strength and the “Treasury Twist” temper upside without clean confirmations.
Be patient and let 120.6k/121.5k decide the next leg. 🔍

Breakout watch: buy >124,227, protect 121,585__________________________________________________________________________________
Market Overview
__________________________________________________________________________________
The market keeps a bullish drive but stalls beneath a dense HTF resistance band at 124,227–125,650, with intraday digestion. Buyers hold the advantage above 121,585; the next leg needs acceptance above 124,227.
Momentum: Bullish 📈, capped by 124,227–125,650; shallow pullbacks while 121,585 holds.
Key levels:
• Resistances (W/240): 124,227–125,650 (must clear)
• Supports (1H–1D): 123,300–123,000 (intra) • 121,585 (4H/12H pivot) • 117,971 (1D pivot)
Volumes: HTF normal; 6H/4H moderate; very high on 15m during 124.2k–125.6k tests (catalyst).
Multi-timeframe signals: MTF trend filter is up (1D/12H/6H/4H), but a confirmed acceptance >124,227 is required; intraday (2H/1H/30m/15m) ranging tight under R with volume spikes.
Risk On / Risk Off Indicator: NEUTRAL BUY — no directional thrust, consistent with a cautious bullish bias; breakout confirmation still needed.
__________________________________________________________________________________
Trading Playbook
__________________________________________________________________________________
Strategic stance: dominant uptrend into heavy resistance; favor “buy breakout / buy the dip” and only fade tactically on clean rejection.
Global bias: Cautious bullish above 121,585; key invalidation on a close below 121,585.
Opportunities:
• Breakout buy: Enter on acceptance >124,227 with rising volume; aim for 125,650.
• Dip buy: Buy 121,700–121,200 (around 121,585) if HTF structure holds.
• Tactical short: Fade 124.2k–125.6k on rejection wick + sell-volume expansion.
Risk zones / invalidations:
• A decisive break below 121,585 invalidates the bullish bias and opens 117,971.
• A 12H/1D close >125,800 invalidates rejection shorts.
Macro catalysts (Twitter, Perplexity, news):
• Strong US spot BTC ETF inflows — supportive of dip absorption.
• Near-term macro tape is light; gold firm and oil up keep the backdrop mixed.
• FOMC Minutes (Oct 8) could tilt the risk-on/off regime near 124,227.
Action plan:
• Breakout long: Entry 124,250–124,450 / Stop: close <124,200–123,650 / TP1 125,000, TP2 125,650, TP3 runner; R/R ~1.8–2.2.
• Dip long: Entry 121,700–121,200 / Stop: close below 121,585 / TP1 124,000, TP2 124,900, TP3 125,650; R/R ~2.0–2.5 on clean bounce.
• Fade short: Entry 124,200–124,700 / Stop: >125,800 / TP1 123,300, TP2 121,585, TP3 117,971; R/R ~1.5–2.0 on swift rejection.
__________________________________________________________________________________
Multi-Timeframe Insights
__________________________________________________________________________________
Higher timeframes stay bullish overall, while intraday frames consolidate beneath resistance with volume spikes acting as catalysts.
1D/12H/6H/4H: Uptrend off 108,709, pausing under 124,227–125,650; above 121,585, digestion favors continuation to 125,650 if acceptance above 124,227 materializes.
2H/1H/30m/15m: Tight range 123,000–124,300; very high volume on attempts into 124.2k–125.6k — a validated break with volume likely carries toward 125k/125,650.
Major divergences/confluences: Strong support confluence at 123,300–123,000 and 121,585; HTF volumes neutral vs. intraday high at R — the breakout needs flow confirmation to avoid a fake-out.
__________________________________________________________________________________
Macro & On-Chain Drivers
__________________________________________________________________________________
US spot BTC ETF flows remain the dominant driver, while the immediate macro calendar is light and the broader backdrop stays nuanced.
Macro events: Solid ETF inflows (ongoing streak), gold firm and oil higher suggest a mixed backdrop; BOJ cautious, EU eyeing looser fiscal rules, US housing softer; FOMC Minutes upcoming.
Bitcoin analysis: Institutional/ETP flows described as sticky, supporting dips and trend resilience; technically, validation above 124,227 is required.
On-chain data: STH cost basis ~111.6k defended; LTH distribution cooling; options OI reset with softer IV and more neutral skew — constructive backdrop.
Expected impact: Bullish bias maintained if a confirmed breakout above 124,227 occurs; otherwise, expect a 123,000/121,585 range.
__________________________________________________________________________________
Key Takeaways
__________________________________________________________________________________
The market is bullish yet compressed beneath 124,227–125,650, requiring a confirmed breakout to re-ignite momentum.
- Overall trend: bullish/constructive above 121,585.
- Most relevant setup: confirmed break >124,227 with volume toward 125,650; alternatively, buy the dip at 121,585 on rejection.
- Key macro factor: strong US spot ETF inflows aiding dip absorption.
Stay nimble: demand breakout confirmation via closes and volume; otherwise, manage the range and protect risk. ✍️

119.6–120k: key supply wall before 123.6–124.5k__________________________________________________________________________________
Market Overview
__________________________________________________________________________________
Price is pressing into a major HTF supply zone after a strong advance while holding the reclaimed daily pivot. The backdrop stays constructive as long as key supports hold, but we’re knocking on a heavy resistance.
Momentum: 📈 Bullish but cautious — price is testing 119.6k–120.0k (HTF supply) after reclaiming 117.9k.
Key levels:
• Resistances (HTF): 119.6k–120.0k; 123.6k–124.47k.
• Supports (MTF): 117.9k; 116.3k–114.8k; 111.04k–110.3k.
Volumes: Normal to moderate (slight pick-up on 1H/30m), no extreme signal.
Multi-timeframe signals: 1D/12H/6H/4H trend up; 2H/30m flag tactical overextension under 119.6–120k — consistent with supply test.
Risk On / Risk Off Indicator: Neutral Buy — confirms the constructive bias without overheating; aligned with current momentum.
__________________________________________________________________________________
Trading Playbook
__________________________________________________________________________________
Dominant trend is up into HTF supply; favor buy-the-dip or confirmed breakouts, with strict invalidations.
Global bias: Cautiously bullish while 117.9k holds on a closing basis; primary invalidation on a daily close < 117.9k.
Opportunities:
• Breakout buy: Buy 30m–4H closes/acceptance above 119.6k; aim for 120.2k then 123.6k–124.47k.
• Pullback buy: Buy 117.9k if defended with a bullish signal; target 119.2k then 119.6k–120.0k.
• Tactical sell: Fade 119.6–120.0k only on clean rejection (wicks + sell pressure) toward 118.3k then 116.3k–114.8k (reduced size).
Risk zones / invalidations:
• A break below 117.9k invalidates near-term longs (risk opens toward 116.3–114.8k).
• Sustained acceptance above 120.2k invalidates fade shorts.
Macro catalysts (Twitter, Perplexity, news):
• Positive US spot BTC ETF inflows (recent impulse) — supports dips.
• Gold near highs and firmer oil — mixed inflation/risk backdrop but not outright risk-off.
• Softer US housing — cooling growth, often supportive if real rates compress.
Action plan:
• Entry: 119.65k–119.80k (breakout confirmed by 2×30m) / Stop: < 119.05k / TP1: 120.20k, TP2: 123.60k, TP3: 124.47k / R/R ≈ 1.8–2.5R depending on execution.
__________________________________________________________________________________
Multi-Timeframe Insights
__________________________________________________________________________________
Higher timeframes lean long, while lower timeframes ask for tactical patience at supply.
1D/12H/6H/4H: Uptrend with higher highs/lows; 117.9k is a key pivot; continuation setup on break/acceptance > 119.6k toward 123.6k–124.47k.
2H/1H: Compression under 119.6–120k; some overextension risk — prefer validated dips over chasing.
30m/15m: Noisier; repeated rejections below 119.6–120k can whipsaw. Major confluence: 117.9k (defense) vs 119.6k (trigger).
__________________________________________________________________________________
Macro & On-Chain Drivers
__________________________________________________________________________________
Macro/on-chain is constructive without being euphoric; ETF flows are supportive while the macro mix is mixed but not outright risk-off.
Macro events: Gold near highs (policy/risk hedging), oil firmer (Russia supply), US housing softer — a cocktail of cooler growth + mixed price pressure, often friendly to scarcity assets.
Bitcoin analysis: Institutional demand via spot ETFs is backstopping dips; technicians watch for a clean breakout; derivatives positioning is bullish, hence the need for confirmation.
On-chain data: Repeated defense around STH cost basis (~111.6k); dense overhead supply easing; options IV softens with balanced skew — good conditions for clean breakouts.
Expected impact: Positive ETF flows and a non–risk-off macro validate a Neutral Buy bias while acknowledging the 119.6–120k supply wall.
__________________________________________________________________________________
Key Takeaways
__________________________________________________________________________________
Bullish market pressing a major supply shelf.
- Trend: 📈 Bullish/Neutral Buy; a clean break above 119.6k is needed to open 123.6–124.5k.
- Top setup: Buy defended pullbacks at 117.9k or confirmed breakout > 119.6k; tactical shorts only on clear rejection.
- Macro: US spot ETF inflows turned positive — structural support for dips and validated breakouts.
Stay opportunistic but disciplined: demand confirmation, watch volumes, and manage risk tightly.

BTC Tests Range Highs Below 120k: Wait for Confirmation __________________________________________________________________________________
Market Overview
__________________________________________________________________________________
BTC is back at the top of its range, pressing 116.8k–117.97k just beneath the 120k barrier. Higher timeframes (12H/1D) lean bullish, while mid-TFs still push back — confirmation is key before chasing strength.
Momentum: 📈 Cautiously bullish; above 115.2k, a clean close >117.97k would likely unlock 120k.
Key levels: Resistances: 116.8k–117.97k; 120k; 124.3k. Supports: 115.2k; 114k; 112.4k–111.1k.
Volumes: Very high on 6H→30m (mostly under resistance), normal on 1D.
Multi-timeframe signals: 1D/12H Up; 6H/4H/2H Down; 1H/30m/15m Up.
Risk On / Risk Off Indicator context: NEUTRE VENTE — slight risk-off, contradicting daily momentum.
__________________________________________________________________________________
Trading Playbook
__________________________________________________________________________________
With range highs overhead, stay constructive but disciplined: lean cautiously bullish while 115.2k holds and wait for confirmed breaks to avoid traps.
Global bias: Cautious bullish while 115.2k holds; major invalidation on a 1D close <114k.
Opportunities:
• Pullback buy if 115.2k holds, then confirm >116.8k.
• Breakout long on 1D close >117.97k; add if 120k flips to support.
• Tactical sell on rejection at 116.8k–117.97k toward 115.2k then 114k.
Risk zones / invalidations: Loss of 115.2k opens 114k/112.4k; a 1D close >120.6k invalidates top-shorts.
Macro catalysts: Fed −25 bps (supports risk), potential US data timing shifts (ISM/NFP) that can cluster volatility, and positive BTC spot ETF flows (Day +$430M) reinforcing dips.
Action plan: Entry >117.97k (≥2 closes + retest) / Stop <115.8k / TP1 120k, TP2 122.5k, TP3 124.3k / R:R ~1.8–2.5.
__________________________________________________________________________________
Multi-Timeframe Insights
__________________________________________________________________________________
Higher timeframes point up, but mid-TF supply still caps price near the range highs; intraday strength needs follow-through to avoid bull traps.
1D/12H: Holding above 115.2k preserves upside bias; convert 117.97k to open 120k then 124.3k.
6H/4H/2H: Seller pressure below 116.8k–117.5k; beware fake breaks without volume follow-through.
1H/30m/15m: Impulsive bounce is constructive, but requires break/hold (≥2 bars) to confirm trend continuation.
__________________________________________________________________________________
Macro & On-Chain Drivers
__________________________________________________________________________________
A supportive macro backdrop and improving flows help, but timing risks keep volatility elevated around resistance.
Macro events: Fed easing (−25 bps) underpins risk appetite; shifting ISM/NFP timing may concentrate moves around data windows.
Bitcoin analysis: 114k–115.2k defended; highest quarterly close; weekly ETF inflows turned positive.
On-chain data: STH cost basis ~111k; ETF inflows resumed; recent deleveraging cleans positioning.
Expected impact: Slight bullish tilt if 115.2k holds and 117.97k flips to support; otherwise risk of 114k/112.4k retests.
__________________________________________________________________________________
Key Takeaways
__________________________________________________________________________________
BTC is pressing range highs with active supply below 120k. The cleaner long is a confirmed breakout >117.97k with 120k turning into support; otherwise, fading rejections back into 115.2k remains valid. Macro support (−25 bps + positive ETF flows) helps, but confirmation at resistance matters most. Stay patient and execute only on validated signals.

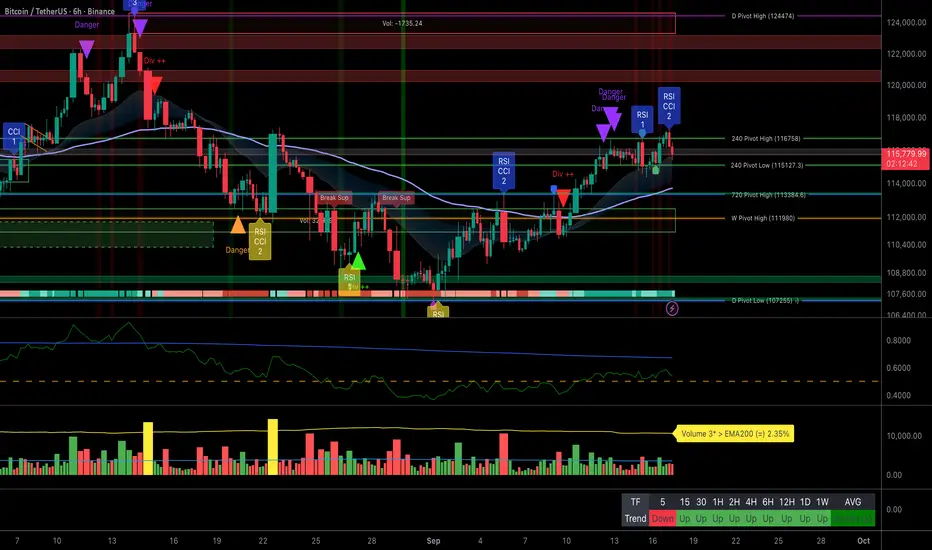
Bitcoin capped below 115k: plan and invalidations__________________________________________________________________________________
Market Overview
__________________________________________________________________________________
BTC is staging a controlled recovery above 111k while stalling beneath a heavy 113.8k–116k supply zone ahead of the 117.97k pivot. The backdrop is constructive, but intraday timeframes still show profit-taking.
Momentum: Bullish 📈 on 1D/12H, with active consolidation on 2H–6H after the 114.6k–114.8k rejection.
Key levels:
• Resistances (HTF): 114.8k–116k (1D/12H), 117.97k (1D), 124.3k (W).
• Supports (HTF): 112.4k–111.5k (12H), 110.4k (pivot), 109.3k (6H).
Volumes: Normal on 1D, very high intraday on the 114.6k–114.8k fade, moderate on 6H.
Multi-timeframe signals: 1D/12H Up; 2H/4H/6H Down (pullback within HTF trend); 1H/30m/15m tactical rebounds at 112.6k–112.9k. Elevated offer-side volumes argue for clear validations before breakout.
Risk On / Risk Off Indicator: NEUTRAL BUY → mild risk-on bias, aligned with HTF momentum; occasional intraday spikes to STRONG BUY, but not persistent.
__________________________________________________________________________________
Trading Playbook
__________________________________________________________________________________
Context: HTF trend is bullish; favor disciplined dip-buys at supports with confirmation, be cautious below 114.8k–116k.
Global bias: Moderately bullish while > 111k; primary invalidation below 110.4k (structure loss).
Opportunities:
• Buy-the-dip: Buy 112.7k–112.2k on reversal signal; target 114.6k then 115.3k/117.0k.
• Breakout: Buy break & hold > 114.8k (30m–1H) aiming for 117.97k.
• Tactical sell: Fade clean rejection at 114.6k–115.3k (wick + volume) toward 113.7k then 112.9k.
Risk zones / invalidations: A firm break < 112.2k reopens 111.5k–110.4k; a 1D close > 118k invalidates tactical shorts.
Macro catalysts (Twitter, Perplexity, news):
• Fed: initial 25 bp cut and gradual easing path → gentle risk-on.
• Softer USD, gold at highs, oil lower (OPEC+) → supportive tailwind for BTC.
• US shutdown risk + CPI/ISM/NFP week → elevated volatility near key levels.
Action plan:
• Entry: 112.7k–112.2k (candle reversal + intraday momentum rebuild).
• Stop: below 111.8k (aggressive) or below 110.4k (conservative).
• TP: 114.6k (TP1) / 115.3k (TP2) / 117.0k (TP3).
• R/R guide: ~1.8R (tight stop) up to ~2.5–3R (wide stop) depending on execution/trailing.
__________________________________________________________________________________
Multi-Timeframe Insights
__________________________________________________________________________________
Overall HTF is bullish, MTF is breathing, and LTF is rebounding at demand.
1D/12H: Bullish structure above 111k–112k; compression below 114.8k–116k. A daily close > 114k strengthens odds for 117.97k.
6H/4H/2H: Orderly pullback after 109k→114k impulse; buyer pivot 112.4k–111.9k; sustained upside needs > 113.8k then > 114.6k.
1H/30m/15m: Tactical bid active at 112.6k–112.9k; very high offer-side volumes → wait for confirmations, avoid late chases under 114.8k.
Confluences/divergences: Strong confluence 112.4k–111.5k; recent intraday divergences suggest shallow but jumpy pullbacks.
__________________________________________________________________________________
Macro & On-Chain Drivers
__________________________________________________________________________________
Macro is mildly supportive (more dovish Fed, softer USD), while on-chain and ETF signals are positive but uneven.
Macro events: Fed started easing (−25 bp) with a cautious tone; USD softer, gold at highs, oil lower (OPEC+); US shutdown risk and CPI/ISM/NFP in focus.
Bitcoin analysis: ETF inflows turned positive on the day but 7D trend is fragile → tactical support to dip-buys; technical structure reclaimed with firm BTC dominance.
On-chain data: STH cost basis near ~111k is pivotal; LTH realized sizable profits; derivatives deleveraging and elevated put skew → respect downside shock risk.
Expected impact: Supportive yet not euphoric, fitting a “buy dips” approach while 110.4k holds; above 114.8k, macro could help extend toward 117.97k.
__________________________________________________________________________________
Key Takeaways
__________________________________________________________________________________
BTC is recovering above 111k but sellers defend 114.8k–116k.
- Overall trend: Constructively bullish on HTF, with a breathing MTF.
- Best setup: Disciplined buy at 112.7k–112.2k with confirmations; extend if break & hold > 114.8k toward 117.97k.
- Key macro: Gradual Fed easing + softer USD provide a tailwind.
Stay selective: demand confirmations at offers and watch 110.4k as the key line in the sand.
BTC: Reclaim 110.4–111.1k or lose 108.7k — the pivot__________________________________________________________________________________
Market Overview
__________________________________________________________________________________
BTC is in a corrective phase after the 117–124k top, still holding the HTF demand at 108,713–107,286. Price is highly level‑driven, with a mild risk‑off tone capping rebounds near 110.4–111.1k.
Momentum: 📉 Slightly bearish below 110,402–111,135, with a low‑range structure holding above 108,713.
Key levels:
• Resistances (1H/4H/1D) : 110,402–111,135 (major lid), 114,471, 117,971.
• Supports (12H/1D/1W) : 108,713–107,286 (demand zone), 98,330 (weekly base).
Volumes: Very high on the sell‑leg in 4H/2H/1H; normal to moderate on 1D.
Multi-timeframe signals: 1D/12H filters stay up, while 6H/4H/2H lean down; 1H/30m/15m show tactical long windows on support. A reclaim of 110.4–111.1k would align TFs higher.
Risk On / Risk Off Indicator: Reading NEUTRAL SELL → confirms capped rebounds and slightly contradicts the HTF up filter.
__________________________________________________________________________________
Trading Playbook
__________________________________________________________________________________
Strategic stance: HTF trend still up but fading; stay opportunistic and disciplined around key levels.
Global bias: Neutral‑bearish below 110,402–111,135; bias invalidated if a daily close above 111,135 holds.
Opportunities:
• Reclaim buy: Go long on breakout + held retest of 110,402 toward 111,135, targeting 114,471 next.
• Tactical sell: Fade clean rejections at 110,402/111,135 if risk‑off persists, targeting 109.0k then 108,713.
• Breakdown sell: Short confirmed loss of 108,713 (≥2 closes + failed retest) toward 107,286.
Risk zones / invalidations:
• A break of 108,713 likely opens 107,286 and raises downside momentum risk.
• Reclaim of 111,135 invalidates tactical shorts and unlocks 114,471.
Macro catalysts (Twitter, Perplexity, news):
• PCE in line: supports “higher‑for‑longer” and a firm USD → mild headwind.
• Fed “data‑dependent”: restrictive but flexible; market guided by levels.
• Spot ETFs: negative daily flow, 7‑day near neutral → cautious near term, MT adoption intact.
Action plan:
• Long (reclaim): Entry 110,450–110,650 / Stop < 108,713 / TP1 111,135, TP2 114,471, TP3 117,971 / R:R ~2–3.
• Short (rejection): Entry 110,100–110,300 / Stop > 111,135 / TP1 109,000, TP2 108,713, TP3 107,286 / R:R ~1.8–2.5.
__________________________________________________________________________________
Multi-Timeframe Insights
__________________________________________________________________________________
Overall, HTFs remain constructive while MTF/intraday manage a base‑building range under nearby resistance.
1D/12H: Up filters softening; 108,713–107,286 defended; a reclaim above 111,135 would target 114,471.
6H/4H/2H: Down sequences with notable sell volume; 110,402 caps rebounds; loss of 108,713 likely opens 107,286.
1H/30m/15m: Tactical long windows on support (absorption/wicks), yet need a sustained push >110,402; otherwise the low range persists.
Major divergences/confluences: HTF support confluence (108,713–107,286) vs mild risk‑off impulse; clearing 110.4–111.1k aligns TFs higher.
__________________________________________________________________________________
Macro & On-Chain Drivers
__________________________________________________________________________________
Macro is slightly constraining but not shocking, while on‑chain/flows set the tactical pivot.
Macro events:
• PCE in line and firm USD: reinforce “higher‑for‑longer” → mild risk‑off bias.
• Fed data‑dependent: restrictive yet flexible; elevated sensitivity to levels.
• New US tariffs: potential near‑term inflation impulse → possible risk‑off spillovers.
Bitcoin analysis:
• STH Cost Basis ~109.5–111k: a key psychological/technical pivot; fast regain fits bull‑market behavior if held.
• Options/futures: post‑expiry “cleanup” and positioning reset; snapbacks likely if levels are reclaimed.
• ETFs: daily outflows, 7‑day near neutral; MT adoption intact, but caution short term.
On-chain data:
• Sentiment washed out (low Fear & Greed) with improving hashrate: structurally supportive backdrop.
• Stablecoins: recent issuance indicates “dry powder,” not guaranteed to deploy.
Expected impact: Without a reclaim of 110.4–111.1k, mild risk‑off weighs; above it, MT/flow confluence favors a squeeze toward ~114.5k.
__________________________________________________________________________________
Key Takeaways
__________________________________________________________________________________
BTC is basing in a low range atop HTF supports, with a mild macro headwind.
- Overall trend: neutral‑bearish below 110.4–111.1k, yet 12H/1D filters remain up.
- Most relevant setup: reclaim buy above 110.4–111.1k toward 114.5k; conversely, loss of 108.7k targets 107.3k.
- One key macro: PCE in line and a data‑dependent Fed keep a mild risk‑off tone.
Let the levels lead: wait for a confirmed reclaim above 110.4–111.1k or a breakdown of 108.7k before committing risk. ⚖️

BTC: Defend 111.6k, confirm > 113,050 → 114,472__________________________________________________________________________________
Market Overview
__________________________________________________________________________________
BTC sits on a defended HTF support while an intraday ceiling caps any extension. The bias stays cautiously bullish as long as 111,800–111,600 holds, but a confirmed reclaim above 113,050 is still needed.
Momentum: Fragile bullish range 📈 — buyers hold 111,800–111,600, yet 113,050 keeps a lid on price.
Key levels:
- Resistances (2H–1D): 113,050 (intra cap), 114,472 (HTF pivot), 116,200–117,300 (extension).
- Supports (HTF→intra): 111,800–111,600 (major 240 PL), 111,150 (intra), 107,286 (D PL).
Volumes: Very high on 30m/15m (potential reversal fuel), normal on 4H–1D.
Multi-timeframe signals: 1D/12H/6H/4H/2H trend Up; 1H still Down; 30m/15m trying to turn — reclaim of 113,050 with persistence is the key.
Risk On / Risk Off Indicator: NEUTRAL BUY (moderate risk-on) — supportive but not decisive; on very short TFs (15m) it tilts toward STRONG BUY if the breakout confirms.
__________________________________________________________________________________
Trading Playbook
__________________________________________________________________________________
Core stance: favor defensive buys at support or strength buys on confirmed breakouts, with a clear invalidation below 111,600.
Global bias: Moderately bullish (NEUTRAL BUY) while 111,600 holds; invalidation on a confirmed close < 111,600.
Opportunities:
- Buy-the-dip: Buy 111,800–111,600 on clean rejection + confirmation; target 114,000 then 114,472.
- Breakout buy: Buy a reclaim > 113,050 with a held retest; add > 114,472 if volume expands.
- Tactical sell: Fade clean rejections at 113,050–114,472 or a confirmed break < 111,600.
Risk zones / invalidations: A loss of 111,600 opens 111,150 then 107,286; failure to reclaim 113,050 over 2–3 bars weakens the bullish case.
Macro catalysts:
- Fed (25 bps cut, dovish tilt): supportive backdrop, but price must confirm.
- Spot ETF flows softening: headwind for breakouts near resistance.
- Geopolitics (Ukraine/Syria): headline risk — demand confirmation before sizing up.
Action plan:
- Entry: 111,850–111,600 (confirmed rejection) or > 113,050 (break & retest).
- Stop: below 111,150 (dip-buy) or below 112,400 (post-break).
- TP1/TP2/TP3: 114,000, 114,472, 116,217 (leave a runner toward 117.9k if momentum builds).
- R/R: ~1.8–2.5R depending on entry and breakout validation.
__________________________________________________________________________________
Multi-Timeframe Insights
__________________________________________________________________________________
Higher timeframes remain constructive while execution TFs need a reclaim of 113,050 to realign.
1D/12H/6H/4H/2H: Bullish structure while 111,800–111,600 holds; a reclaim of 113,050 unlocks 114,472 then 116,200–117,300.
1H: Still capped under 113,050/114,472; needs a close above to neutralize local supply.
30m/15m: Very strong volumes and intraday risk-on support a bounce attempt; confirmation requires a persistent hold above 113,050.
Confluences/divergences: Bullish confluence = HTF support + MTF Up + moderate risk-on; key divergence = 1H still Down, raising fake-break risks without persistence.
__________________________________________________________________________________
Macro & On-Chain Drivers
__________________________________________________________________________________
Macro is slightly supportive (more accommodative Fed) but tempered by soft spot flows and elevated geopolitics — hence the need for technical confirmation.
Macro events:
- Fed: 25 bps cut with a data‑dependent tone — structurally supportive, not an automatic upside trigger.
- Geopolitics: elevated risks (Ukraine/Syria) that can boost volatility and cap rallies at resistance.
- Spot ETFs: recent soft flows — a tactical headwind into nearby ceilings.
Bitcoin analysis:
- Supply remains active under 113k; demand is defended at 111,800–111,600 (HTF), with a broader demand area near 109k/107,286 if it breaks.
- Derivatives: elevated options OI into the 26/09 expiry; “max pain” near 110k — can magnetize price if breakouts fail.
On-chain data:
- Comfort threshold ~115.2k (~95% of supply in profit): above it momentum sustains; below it risks an oscillation inside 105.5k–115.2k.
Expected impact:
- Slight rebound edge (NEUTRAL BUY), but proof via price is required: above 113,050/114,472 the macro tailwind can play; otherwise expect range and head-fakes.
__________________________________________________________________________________
Key Takeaways
__________________________________________________________________________________
Range-bound but constructive above a key HTF support.
- Overall trend: conditionally bullish with a 113,050–114,472 ceiling.
- Most relevant setup: defensive buys at 111,800–111,600 or strength buys only after a confirmed reclaim > 113,050.
- Key macro factor: the recent Fed cut improves the risk backdrop, but soft flows/headlines require price confirmation.
Be patient: demand a clean signal (break + retest + volume) before sizing up. 👀

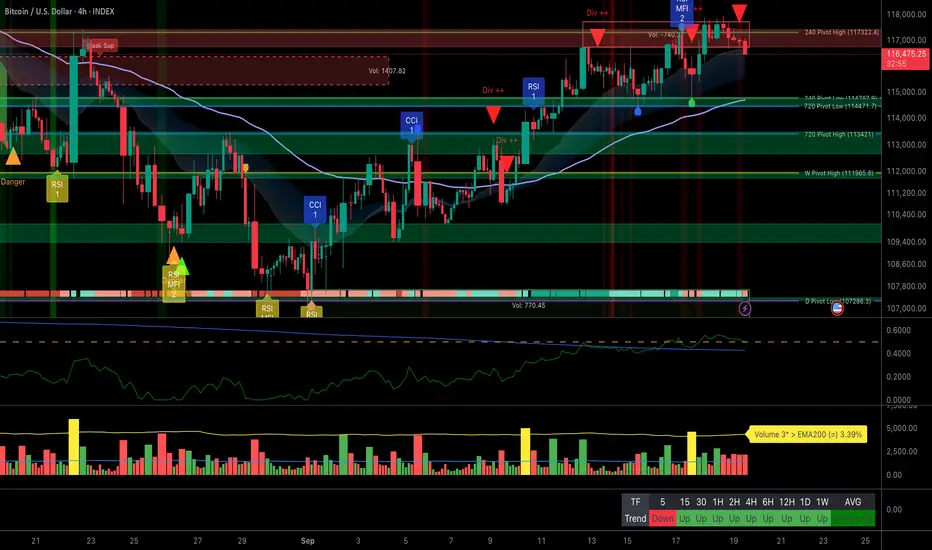
BTC: Bullish range below 114,472, 111,809 remains key__________________________________________________________________________________
Market Overview
__________________________________________________________________________________
BTC is holding a constructive 110k–115k range after rejection below 117k, with buyers defending 111,809 and supply capping under 114,472–116,217. The HTF trend remains intact, but breakouts need volume confirmation.
Momentum: 📈 Bullish-in-range — building above 111,809, but capped until 114,472 breaks.
Key levels:
- Resistances (4H/12H): 114,472; 116,217–117,966; 124,278 (W).
- Supports (4H/1D): 111,809; 110,000; 107,286–107,299 (1D).
Volumes: Very high on 1H/30m (pivot validation), normal on 1D — acts as a breakout catalyst.
Multi-timeframe signals: 1D/12H trend up; 6H/4H “neutral buy” below 114,472; 2H/1H recovering; 30m/15m impulsive but close to resistance.
Risk On / Risk Off Indicator: NEUTRAL BUY (STRONG BUY on 15m) → moderate long bias, consistent with momentum while 111,809 holds.
__________________________________________________________________________________
Trading Playbook
__________________________________________________________________________________
Strategy context: HTF trend is bullish, range in play; favor tactical longs while 111,809 holds and fade clean rejections below 116,217.
Global bias: NEUTRAL BUY above 111,809; invalidation if daily close < 111,809.
Opportunities:
- Range long: re-accumulate 112.05k–112.3k if 111,809 holds cleanly; add on break & hold > 114,472.
- Breakout: buy the close and successful retest > 114,472 targeting 116,217 then 117,966.
- Tactical short: sell a clear rejection at 114,472/116,217 (wick + volume), manage tight and take profits fast.
Risk zones / invalidations: A confirmed loss of 111,809 reopens 110k then 107,286 (bull bias invalid). A 12H/1D close > 116,217 invalidates fade shorts.
Macro catalysts (Twitter, Perplexity, news):
- Powell’s speech: potential trigger for break or fakeout.
- US PMIs: can spark the 114,472 break or a rejection.
- Hard assets strong (gold at records) and oil lower: mixed “inflation/sentiment” that shapes risk appetite.
Action plan:
- Long (range/break): Entry 112.05k–112.3k or > 114,472 / Stop 111,650 / TP1 114,472, TP2 116,217, TP3 117,966 / R:R ~2–3.
- Short (tactical): Entry 114.3k–114.5k (rejection) / Stop 114,800 / TP1 113.1k, TP2 111,809 / R:R ~1.5–2 (reduced size).
__________________________________________________________________________________
Multi-Timeframe Insights
__________________________________________________________________________________
Overall, HTFs (1D/12H) stay bullish, while LTFs rebound but still face nearby resistance.
1D/12H: Uptrend above 111,809 and 107,286 pivots; reclaim of 114,472 would open 116,217 then 117,966 with volume confirmation.
6H/4H: “Neutral buy” below 114,472; active range 111,809–114,472; a close > 114,472 should target 116,217.
2H/1H: Ongoing rebound, strong 1H volumes at the pivot; need a close > 114,472 to convert into impulse.
30m/15m: Intraday impulse (strong risk-on on 15m) but immediate friction at 114,472; beware fake breaks without a successful retest.
__________________________________________________________________________________
Macro & On-Chain Drivers
__________________________________________________________________________________
Macro is mixed: Fed speak and PMIs are in focus, hard assets strong and oil easing — likely to polarize breaks on the key technical levels.
Macro events: Powell can trigger a break/reversion; US PMIs may add volatility; record gold and softer oil adjust the “inflation/sentiment” lens.
Bitcoin analysis: 110k–115k range with 117–117.5k rejection; the 112k–110k support cluster is pivotal to preserve the structural bull bias.
On-chain data: Not provided here — no actionable on-chain extremes mentioned in this set.
Expected impact: If Powell/PMIs validate risk-on, a close > 114,472 should extend to 116,217–117,966; otherwise, expect a return to 111,809 then 110k.
__________________________________________________________________________________
Key Takeaways
__________________________________________________________________________________
BTC trades a bullish range above a key pivot while dense resistance sits overhead.
- Trend: moderately bullish while 111,809 holds; need a close > 114,472 to re-ignite upside.
- Prime setup: buy the defense of 111,809 or the break & hold > 114,472, aiming 116,217 then 117,966.
- Macro: Powell/PMIs can trigger the break or produce intraday traps.
Stay disciplined: wait for close-and-retest confirmations to size up, and de-risk quickly if macro flow contradicts the signal.

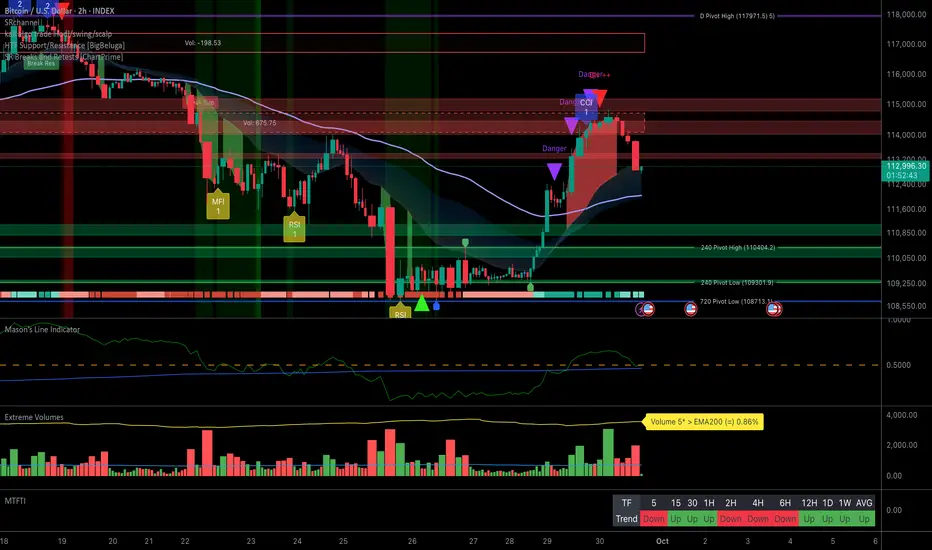
Macro Stress Test for Bitcoin: Short-Term Scalps or Swing Awaits__________________________________________________________________________________
Market Overview
__________________________________________________________________________________
Bitcoin just experienced a violent flush toward its structural support (111,900–112,000) amid extreme intraday volatility. Downside has been aggressive, but core trend signals and volume dynamics hint at a potential technical reversal.
Momentum : Neutral-bullish 📈 — Price action is anchored above 112,000, despite recent capitulation, with MTFTI remaining "Up" across all relevant timeframes.
Key Levels :
Resistances :
— 116,200/117,000 (1D/12H), major cluster/weekly pivot
— 114,200/114,400 (12H/6H/4H), tactical zone for initial rebounds
Supports :
— 111,900–112,000 (all TFs), structurally central platform
— 110,900/111,200 (4H/2H), secondary defense to watch if breakdown occurs
Volumes : Very high on 1H/30min/15min ⚡️— Clear signs of capitulation at support, technical bounce potential (short squeeze) activated.
Multi-Timeframe signals : MTFTI reads "Up" from 1H to 1D, IGV/SPY (Risk On / Risk Off Indicator) is "Neutral Buy" (moderately positive), all confirming strength of support at 112,000. Only high-level macro dashboard signals remain defensive.
Risk On / Risk Off Indicator : Neutral Buy bias — Recent stabilisation and moderate equity outperformance warrant a constructive view for tactical longs, though macro caution persists.
__________________________________________________________________________________
Trading Playbook
__________________________________________________________________________________
Current conditions are defined by a sharp flush but a directional "buy the dip" bias persists while MTFTI aligns positively.
Global bias : Neutral-long — valid as long as 111,900–112,000 holds; invalidation on clean breakdown with sustained volume.
Opportunities :
— Tactical long/scalp on a confirmed bounce >112,000, add if 112,800 breaks, TP1 = 112,800, TP2 = 113,500.
— Small short only if explosive breakdown <111,900 with confirming volume; TP1 = 111,500, TP2 = 111,200.
Risk zones / invalidations : Any close below 111,900 without rapid buying flips the bias bearish; failed bullish engulfing/test nullifies the long tactic.
Macro catalysts :
— Fed begins an easing cycle as US jobs deteriorate/geopolitical risk rises; global liquidity (M2) still provides a tailwind.
— Institutional BTC flows ("whale withdrawals", ETFs/funds) build above 115.2k, as long as on-chain base holds.
— No major top signal; backdrop remains “risk-on/risk-off” but favors a tactical bounce.
Action plan :
Enter partial size above 112,000 on valid signal; stop <111,800; TP1 = 112,800, TP2 = 113,500; R/R ≈ 2.5 – scale out at resistance, manage dynamically on confirmation/failure.
__________________________________________________________________________________
Multi-Timeframe Insights
__________________________________________________________________________________
Price reacts tightly at 111,900/112,000, with core structure defended on all major time frames.
1D/12H/6H: Higher timeframes hold structure above 112,000, with liquidations targeting this support. "Buy the dip" playbook intact if level is defended.
4H/2H/1H: Extreme volume concentration and volatility, sellers pressured to exhaust; favor a quick bounce if buying appears immediately.
30min/15min: IGV/SPY (Risk On / Risk Off Indicator) prints "STRONG BUY" and ISPD DIV "BUY" — strong micro support for scalps/short-term longs.
Divergences: Confidence for a swing long only resumes after a confirmed reclaim of 112,800; clean break of 111,900 exposes further downside risk.
__________________________________________________________________________________
Macro & On-Chain Drivers
__________________________________________________________________________________
Macro context remains tense despite strong global liquidity; absence of massive on-chain outflows remains key.
Macro events : US jobs data weaken, geopolitical risks (NATO/Ukraine/Syria) rise, Fed kicks off easing, but all-time high global M2 supports risk assets.
Bitcoin institutional flows : Strategic accumulation is visible (whale withdrawals, ETF inflow), no signs of euphoria/top; 115.2k–116k base is the critical pivot for breakout or renewed correction.
On-chain data : With 95% of supply in profit >115.2k, on-chain resilience persists unless 111,900 breaks; major vulnerability accompanies loss of this support.
Expected impact : 111,900–112,000 offers a prime tactical entry if macro liquidity endures and on-chain flows stay supportive; a fast bounce is plausible.
__________________________________________________________________________________
Key Takeaways
__________________________________________________________________________________
The market is caught between violent short-term capitulation and persistent bullish undertones.
Despite the intense technical flush, the higher timeframe trend (MTFTI) still favors a tactical long/scalp stance while 111,900–112,000 is defended. The most actionable setup is a rapid rebound from extreme signals, while swing longs require confirmation above 112,800 and macro risk remains high. Robust on-chain support plus global liquidity create a narrow but real window for technical opportunity — but any significant breakdown should prompt defensive positioning.
Stay nimble and ready to react to confirmation or risk escalation.

BTC Playbook: Buy Dips >115.2k, Trigger >116,217_________________________________________________________________________________
Market Overview
__________________________________________________________________________________
BTC is coiling just below 116,217 with an underlying uptrend, but nearby supply is capping advances. Buyers keep defending 115,200–115,300, where a rebound printed on very high volumes.
Momentum: Moderately bullish 📈 — higher‑timeframe uptrend, but stalled under 116,217 (trigger pivot).
Key levels:
• Resistances (4H–1D) : 116,217 (240 PH); 117,500–118,000 (6H supply); 124,176 (ATH/720 PH).
• Supports (2H–1D) : 115,200–115,300 (240 PL); 114,471 (720 PL); 111,966 (W PH turned support).
Volumes: Very high on 30m at 115,208 (absorption), moderate on 1H, normal elsewhere.
Multi-timeframe signals: 1D/12H/6H/4H/2H/1H are Up ; 30m rebounding, 15m a bit hesitant — constructive while 115,200–115,300 holds; acceptance above 116,217 opens 117,500–118,000.
Risk On / Risk Off Indicator context: NEUTRAL BUY (mild risk‑on), yet it contrasts with a cautious 1D macro regime — warrants smaller size and confirmation.
__________________________________________________________________________________
Trading Playbook
__________________________________________________________________________________
Strategic stance: primary uptrend intact, but adopt a patient, selective approach until 116,217 is accepted.
Global bias: NEUTRAL BUY above 115,200–115,300; key invalidation on confirmed breaks below 114,471 (H1–H2).
Opportunities:
• Buy the dip : tactical longs at 115,200–115,300 on signal, targeting 115,900/116,217 then 117,500–118,000.
• Breakout buy : long on 4H/12H acceptance above 116,217, aiming 117,500–118,000 then 124,176.
• Tactical sell : only on repeated failures under 116,217 + loss of 115,208, targeting 114,471 then 113,421 (reduced size, counter‑trend).
Risk zones / invalidations:
• Below 115,208 : risk of acceleration toward 114,471 (structural damage).
• > 116,217 : momentum flips in favor of 117,500–118,000.
Macro catalysts (Twitter, Perplexity, news):
• Loose financial conditions and equities at/near ATHs — liquidity tailwind.
• BLS CPI methodology report delay — near‑term uncertainty.
• US spot ETF net inflows slightly positive + fresh USDT issuance — constructive liquidity.
Action plan:
• Plan A (Breakout) : Entry 116,250–116,350 (retest), Stop 115,900, TP1 116,900, TP2 117,800, TP3 124,000–124,200, R/R ≈ 1:2–1:3.
• Plan B (Dip buy) : Entry 115,260–115,360, Stop 115,080–115,100, TP1 115,900, TP2 116,217, TP3 117,500–118,000, R/R ≈ 1:2+.
• Plan C (Tactical sell) : Entry 115,150–115,250 (2H < 115,208 + failed pullback), Stop 115,550, TP1 114,480, TP2 113,420, R/R ≈ 1:2.5.
__________________________________________________________________________________
Multi-Timeframe Insights
__________________________________________________________________________________
HTFs remain bullish while LTFs work a tight range just below the trigger.
1D/12H/6H: Up trend with higher lows; 116,217 is the key trigger toward 117,500–118,000 and 124,176.
4H/2H/1H: compression between 115,200–115,300 and 116,217; buy‑the‑dip valid while 115,200 holds and volume confirms.
30m/15m: 30m backed by Very High Volume at 115,208; 15m still cautious — require swift confirmation above 116,000/116,217.
Divergences/confluences: risk‑on tilt (Indicator = NEUTRAL BUY) vs cautious 1D macro regime — argues for smaller initial size and persistence on breaks.
__________________________________________________________________________________
Macro & On-Chain Drivers
__________________________________________________________________________________
Macro is broadly supportive for risk, yet near‑term uncertainty is rising and may dictate the breakout timing.
Macro events:
• Fed: loose financial conditions; equities (growth, S&P 500) at/near ATHs — liquidity tailwind.
• Labor: unemployment at 4.3% with signs of softening — potential macro volatility.
• BLS: key CPI methodology report delayed — added near‑term uncertainty.
• ECB/BOJ: mixed ECB messaging; BOJ mulls partial ETF unwind — liquidity watchpoint.
Bitcoin analysis:
• Price/structure: coil below 124k; post‑FOMC volatility compressed (<3%) — expansion likely on catalyst/flow.
• Flows: US ETF volumes back, net flows modestly positive; fresh USDT issuance — constructive backdrop.
• Larger holders: accumulation by 100–1,000 BTC wallets; alt rotation debated.
On-chain data:
• Majority of supply in profit above ~115.2k (key line); elevated option OI into Sept 26 expiry (gamma risk).
• Derivatives: squeeze then flush — market re‑balanced.
Expected impact:
• Liquidity/flows support a constructive bias; above 116,217, odds improve for 117,500–118,000. Sustained loss of 115,208 re‑opens 114,471/113,421.
__________________________________________________________________________________
Key Takeaways
__________________________________________________________________________________
Bullish coil under a nearby trigger.
- Trend: bullish/NEUTRAL BUY , but requires confirmation above 116,217.
- Prime setup: confirmed breakout > 116,217 after firm defenses at 115,200–115,300, targeting 117,500–118,000 then 124,176.
- Macro: loose financial conditions but higher uncertainty (BLS, labor) — flow‑driven timing.
Focus on acceptance above 116,217 and defense of 115,200–115,300 to calibrate position size. 🧭

Bullish compression below 117k: game plan and risks__________________________________________________________________________________
Market Overview
__________________________________________________________________________________
The trend stays bullish but capped by a multi‑TF supply zone, with higher lows supporting the structure. Event‑driven flow (options/witching) may trigger fakeouts around key levels.
Momentum: Bullish 📈 yet constrained below 116.9k–117,322; buyers control as long as 116.2k–116.3k holds.
Key levels:
- Resistances (HTF/ITF): 116,900–117,322 (multi‑TF decision zone); 117,950–118,000 (intraday liquidity); 120,000 (psychological shelf).
- Supports (ITF/HTF): 116,200–116,300 (intraday floor); 114,500–114,800 (240/720 pivot cluster); 111,965.8 (weekly support).
Volumes: Overall normal; 4H moderate (watch for a volume spike on breakout).
Multi-timeframe signals: 1D/12H bullish (MTFTI filter), 6H/4H tactically supportive below 117,322; 15m micro risk‑off → prefer confirmed breakout or buy on support.
Risk On / Risk Off Indicator: Neutral buy — aligns with momentum, but the 1D macro dashboard remains risk‑off, arguing for patience.
__________________________________________________________________________________
Trading Playbook
__________________________________________________________________________________
The dominant stance is cautious‑bullish below resistance; favor pro‑trend executions on confirmed signals.
Global bias: Buy‑the‑dip while 116.2k–116.3k holds; key invalidation below 114,787.9.
Opportunities:
- Breakout buy: daily/4H “break & hold” above 117,322 aiming 118k then 120k.
- Pullback buy: 116.2k–116.3k with 1H/2H bullish reaction, add above 117.0k.
- Tactical sell (counter‑trend): fade a clean rejection at 116.9k–117.3k, tight stop > 117.6k, targets 116.2k then 114.5k.
Risk zones / invalidations:
- A break below 114,787.9 invalidates the bullish bias and opens 114,471.7 then 111,965.8.
- No close > 117,322 over 2 bars (4H/1D) reduces breakout odds.
Macro catalysts (Twitter, Perplexity, news):
- Fed: −25 bps; USD still firm → whipsaw risk around witching/rebalancing.
- BoJ accommodative and softer oil → lighter inflation pressure, tactical risk support.
- Large options expiries ahead → gamma/hedging flows can amplify false breaks.
Action plan:
- Entry: Buy 116,200–116,350 (confirmed 1H/2H bullish reaction).
- Stop: Below 115,950 (1H close).
- TP1/TP2/TP3: 117,000 / 117,950–118,000 / 120,000.
- R/R approx: ~2.5R / ~5–6R / >10R from a 116.25k core entry.
__________________________________________________________________________________
Multi-Timeframe Insights
__________________________________________________________________________________
HTFs are bullish while LTFs manage a compression under 117,322; the key trigger is a confirmed, high‑volume breakout.
1D/12H/6H: Uptrend compressing below 117,322; 114.5k–114.8k is the buy zone; best setups are clean breakout or controlled dip buys.
4H: Strong if triggered; “break & hold” > 117,322 with rising volume unlocks 118k then 120k.
2H/1H/30m: Range 116.2k–117.3k; watch reactions at 116.2k; 4H moderate volume could catalyze the move.
15m: Mild sell pressure; risk of a support sweep before any trigger — avoid anticipating without confirmation.
Major confluence/divergence: Single resistance 116.9k–117,322 across TFs; macro 1D risk‑off vs 4H/6H tailwinds → demand confirmation and volume.
__________________________________________________________________________________
Macro & On-Chain Drivers
__________________________________________________________________________________
Macro is mixed: tactical support post‑Fed contrasts with a 1D risk‑off backdrop, while options flows may dominate near‑term action.
Macro events: Fed −25 bps (tactically risk‑on), USD still firm (headwind for BTC), cluster of events (quad‑witching, rebalancing, expiries) fosters whipsaws; BoJ easy stance and softer oil ease inflation; persistent geopolitical noise.
Bitcoin analysis: Positive ETF inflows and high IBIT volumes back demand; whale withdrawals from institutional venues reduce immediate spot supply — supportive if breakout confirms.
On-chain data: ~95% of supply in profit with a key line near ~115.2k; record options OI (~500k BTC) and max pain ~110k for 26 Sep → potential magnets; perp OI stabilized.
Expected impact: Setup aligns with a cautious‑long bias, but a move > 117,322 needs a volume spike to avoid a head‑fake.
__________________________________________________________________________________
Key Takeaways
__________________________________________________________________________________
BTC is bullish but stuck beneath a key multi‑TF resistance. Trend is positive; the most relevant setup is a “break & hold” above 117,322 (or a controlled dip buy at 116.2k–116.3k) with confirming volume. On the macro side, the Fed’s rate cut helps, but options expiries can blur signals. Be patient, trade confirmed triggers, and defend invalidations.
Compression Below Resistance: Prepare for Post-FOMC BTC Plays__________________________________________________________________________________
Market Overview
__________________________________________________________________________________
Bitcoin is trapped in a volatility compression zone, trading just below key resistance and awaiting the high-stakes FOMC catalyst. The broader context shows contained flows and limited directional momentum: the market is on standby.
Momentum: Short-term momentum is neutral to slightly bearish 📉, with price tightly range-bound and no strong buying impulse. All eyes on the macro trigger.
Key levels:
— Resistances (clustered):
• 116,800–116,814 (240 Pivot High, dominant multi-TF resistance)
• 124,277 (ATH/Daily Pivot High)
— Supports :
• 114,800–114,809 (240 Pivot, primary short-term support)
• 113,421 (720 Pivot)
• 111,965 (Weekly Pivot High)
Volumes: Volumes are normal across all timeframes, with only a small bump on short-term down moves (30m/15m) — no signs of extreme positioning.
Multi-timeframe signals: Medium-term trend remains bullish (MTFTI "Strong Up" on daily/12H), but short-term timeframes (1H–4H–12H) show downward momentum and lack of a decisive volume trigger.
Risk On / Risk Off Indicator context: Neutral to sell bias , confirming the absence of strong risk-on flows and supporting a cautious tactical approach.
__________________________________________________________________________________
Trading Playbook
__________________________________________________________________________________
The dominant tone is cautious sideways compression — only act on clear breakout or rejection signals at range extremes.
Global bias: Short-term neutral to bearish ; invalidated by a clear reclaim and hold above 116,814.
Opportunities:
• Buy “breakout” only if price clearly breaks and sustains >116,814 with strong volume (first target 117,300, then 118,400+); invalidate below 114,809.
• Sell on firm break and hold <114,809, adding size if volume rises, targeting 114,000–113,000; invalidate on swift rebound >115,700.
Risk zones / invalidations:
• Reclaim and hold >116,814 (with volume) invalidates short bias.
• Breakdown and hold <114,809 across several TFs activates downside.
Macro catalysts (Twitter, Perplexity, news):
• Imminent FOMC decision — options market, volatility compression, and max defensive positioning are the primary drivers.
• ETF flows cooling, Bitcoin dominance declining, risk rotations likely post-FOMC — no strong risk-on evidence yet.
• UK/EU inflation and dovish central banks are background noise, not immediate BTC movers.
Action plan:
• on breakout or clean rejection of technical pivots (116,814/114,809).
• below indicated risk line.
• 117,300, 118,400+ in long; 114,000, 113,000 in short.
• R/R ~1.8–2; max initial exposure 12.5%, only scale in with confirmed multi-TF momentum.
__________________________________________________________________________________
Multi-Timeframe Insights
__________________________________________________________________________________
All timeframes show a tense coil: no timeframe provides a clear trend for now, reinforcing a "wait and see" approach.
1D/12H: Medium-term uptrend filter persists (MTFTI “Strong Up”), but near-term momentum repeatedly stalls below 116,814–116,800, with no volume breakthrough.
6H/4H/2H/1H: Tightly coiled range, anchored at 114,809; loss would open up liquidity tests down to 113,421–114,000.
30m/15m: Volume picks up on short-term declines; only a fleeting “risk-on” flash on 15m (no follow-through to higher TFs).
Major divergences: Isolated 6H “Strong Buy” on equity isn’t confirmed at the market level, making any bounce fragile. 15m “risk-on” flashes lack multi-TF confirmation.
Key invalidation/pivot levels are well aligned across TFs — critical for reactivity when the move comes.
__________________________________________________________________________________
Macro & On-Chain Drivers
__________________________________________________________________________________
Macro and on-chain forces both encourage patience, with the FOMC outcome set to trigger the next major move.
Macro events:
• in focus, strong rate cut expectations and options market tension dominate — clear primary driver.
• BoC goes dovish, UK/EU inflation tensions, but no direct “risk-on” signals across global macro.
• ETF flows tepid, specific post-FOMC asset rotation will be key.
Bitcoin analysis:
• Bitcoin consolidates ~6.8% below ATH, inside technical “cloud” — price activity is all about risk management (options, ETF).
• On-chain support ~110k–114k solid, resistance 115.8k–116.8k, tightly aligned with technical levels.
On-chain data:
• ETF inflows dormant, derivatives lead price action, no clear sign of euphoria or capitulation; on-chain support >108k remains robust.
• Overall attitude is defensive, “wait for the catalyst” mode.
Expected impact:
• The FOMC’s reaction will drive the technical breakout or breakdown; only a clear confirmation will unlock decisive follow-through beyond the current coil.
__________________________________________________________________________________
Key Takeaways
__________________________________________________________________________________
Bitcoin remains trapped in a compression phase under key resistance, on high alert going into the FOMC.
The overall trend is short-term neutral to bearish, with all bullish setups hinged on a confirmed pivot breakout above 116,814. The highest-conviction play is to let the FOMC be the trigger: position with the move, not before. Macro dominance means no reason to anticipate a risk-on rotation until confirmation.
Keep your edge: wait for multi-TF signals and volume confluence, and manage exposure tightly — false breakouts and volatility traps are the enemy heading into this macro event!
BTC: All eyes on 116,814.5 into the FOMC__________________________________________________________________________________
Market Overview
__________________________________________________________________________________
BTC is coiling below the 116.6–116.8k supply zone, keeping the higher-timeframe uptrend intact but capped by the daily pivot at 116,814.5. With the FOMC ahead, volumes remain normal, favoring “break & hold” confirmation over anticipation.
Momentum: Mild bullish bias 📈 but capped under 116,814.5 → high-range 115.0–116.8k.
Key levels:
- Resistances : 116,600–116,814.5 (D/4H pivot), 117,600–118,000 (local liquidity), 124,277.5 (major D pivot).
- Supports : 115,100–114,900 (1H/30m), 114,447.7–113,421 (4H/12H confluence), 111,965.8 (weekly pivot).
Volumes: Normal across TFs; a volume spike is needed to validate the 116.8k breakout.
Multi-timeframe signals: 1D/12H Up (MTFTI filter), 6H/4H/2H NEUTRAL BUY with stair-step structure; notable exception: 1D Dashboard at STRONG SELL, tempering extensions.
Risk On / Risk Off Indicator: NEUTRE VENTE (slight risk-off tilt) — this contradicts the tactical bullish momentum, so demand robust breakout confirmation.
__________________________________________________________________________________
Trading Playbook
__________________________________________________________________________________
Strategic stance: primary uptrend intact but locked by 116,814.5; favor confirmed breakouts and clean retests.
Global bias: Neutral-bullish while 113,421 holds; key invalidation on a close < 113,421 (HTF).
Opportunities:
- Breakout long: Buy a break & hold > 116,814.5 (≥2 closes 4H/12H), target 117.6–118.0k then 120k.
- Buy the dip: Tactical bids at 115,100–114,900 with tight stop below 114,447.7, targeting 116.2 then 116.8k.
- Tactical sell: Fade 116.6–116.8k if 115.1k/114,447.7 breaks, target 113.42k.
Risk zones / invalidations:
- A loss of 113,421 unlocks 111,97k and invalidates the bullish bias.
- Failed hold above 116,814.5 (fast rejection) = bull trap risk; wait for a “break & hold”.
Macro catalysts (Twitter, Perplexity, news):
- FOMC: 25 bp cut expected; Powell’s guidance/dot plot will steer risk.
- Softer USD, record gold and strong equities = conditional tailwind.
- Elevated post-Fed whipsaw risk; avoid impulsive entries.
Action plan:
- Plan A (Breakout long) : Entry 116.9–116.4k (retest), Stop 114.9k, TP1 117.6–118.0k, TP2 120k, TP3 124,277.5, R/R ~1.8–2.5x.
- Plan B (Buy the dip) : Entry 115.10–114.90k, Stop 114.40k, TP1 116.20k, TP2 116.80k, TP3 117.6–118.0k, R/R ~1.5–2.0x.
- Plan C (Tactical sell) : Entry on 116.6–116.8k rejection confirmed by a 115.1k break, Stop > 116,814.5, TP1 114.45k, TP2 113.42k, TP3 111.97k, R/R ~1.8–2.2x.
__________________________________________________________________________________
Multi-Timeframe Insights
__________________________________________________________________________________
Higher TFs remain constructive but constrained by a single overhead pivot, while tactical TFs lean bullish provided a confirmed breakout.
1D/12H: Up with higher highs/lows; 116,814.5 is the decision pivot. Holding above unlocks 118–120k; below it, high-range 114.9–116.8k persists.
6H/4H/2H: NEUTRAL BUY; stair-step advance with bids near 114.4–115.1k. The Dashboard (4H = STRONG BUY) supports a clean breakout if volumes expand.
1H/30m: NEUTRAL; compression 115.1–116.0k with supply 115.6–115.9k. Validation requires > 116.20k then > 116,814.5.
15m: NEUTRAL BUY; micro higher lows but intraday cap intact. Key confluence: single 116,814.5 resistance + normal volumes → need a catalyst.
__________________________________________________________________________________
Macro & On-Chain Drivers
__________________________________________________________________________________
Macro is FOMC-driven (cut expected) with a softer USD and record gold aiding risk, yet event risk is elevated.
Macro events: A 25 bp cut is widely anticipated; Powell/dot plot to guide risk. DXY pullback and equity momentum are tailwinds; whipsaw risk post-Fed remains high.
Bitcoin analysis: Price compressed under ~116.8–118k; 115k acts as intraday pivot. The 114.45–113.42k cluster is critical; losing it invites 111.97k.
On-chain data: Spot/ETFs flows tempered; derivatives more influential with moderate leverage — a durable breakout needs spot volume and multi-bar holds above 116.8k.
Expected impact: A dovish Fed improves odds of a break & hold > 116,814.5; a hawkish tilt risks a slide toward 114.45–113.42k.
__________________________________________________________________________________
Key Takeaways
__________________________________________________________________________________
BTC is in a high-range under a single daily pivot, with an intact uptrend but macro headwinds.
- Overall trend: neutral-bullish while 113,421 holds; a clean break of 116,814.5 is needed to target 118–120k.
- Top setup: confirmed breakout > 116,814.5 with a successful retest and rising volume.
- Macro factor: FOMC ahead; softer USD and record gold support risk but heighten whipsaw potential.
Stay patient: wait for “break & hold” or buy the manageable dip — discipline around major pivots is key.

BTC vs 116.7k–118k: breakout or FOMC rejection?__________________________________________________________________________________
Market Overview
__________________________________________________________________________________
BTC is pinned below the 116.2k–118k supply after rebounding from ~107k, defending the 115.16k pivot. It’s a range-to-break with elevated intraday volumes against a cautious macro backdrop.
Momentum: Range with a mild bullish tilt 📈 while 115.16k holds; a clean breakout needs > 116.74k.
Key levels:
- Resistances (4H/12H/D) : 116.18k–116.74k · 118.0k–118.8k · 124.28k (D).
- Supports (2H/4H/W) : 115.16k–115.20k · 114.16k · 111.97k.
Volumes: Normal on 1D; very high on 1H/30m/15m — a catalyst for a box breakout from 115.2k–116.2k.
Multi-timeframe signals: 1D/12H = Up; 6H/4H/1H = NEUTRAL BUY above 115.16k; 2H = NEUTRAL SELL — a close above 116.74k adds upside conviction; losing 114.16k reopens 111.97k.
Risk On / Risk Off Indicator: NEUTRE VENTE — a slight risk-off stance that contradicts the tactical bullish momentum; demand confirmations and smaller size.
__________________________________________________________________________________
Trading Playbook
__________________________________________________________________________________
Strategic context: Higher-timeframe uptrend (12H/1D) but facing a tight 116.2k–118k supply wall — favor staged execution and confirmed breakouts.
Global bias: Slight long bias while 115.16k holds; higher-timeframe invalidation on a clean daily close < 111.97k.
Opportunities:
- Long on breakout: Close/retest held > 116.74k aiming 118k/120k.
- Tactical “buy-the-dip”: Reclaim of 115.20k after a sweep, stop below 114.16k.
- Tactical short: Rejection at 116.7k–118k OR 30m/1H breakdown < 114.75k targeting 114.16k then 111.97k.
Risk zones / invalidations:
- Break below 114.16k invalidates intraday longs and opens 111.97k.
- Strong reclaim > 116.40k–116.74k invalidates rejection shorts.
Macro catalysts (Twitter, Perplexity, news):
- FOMC: 25 bps cut widely expected; dot-plot and presser = volatility triggers; “sell-the-news” risk.
- US Retail Sales (pre-Fed): could tilt the box breakout.
- Softer China data: growth headwind; keeps risk appetite uneven.
Action plan:
- Long Plan : Entry 115.30–115.90 (reclaim/breakout) · Stop 114.16 · TP1 116.18 · TP2 116.74 · TP3 118.00 · R/R ≈ 1.5–3.0.
- Short Plan : Entry 116.10–116.70 (rejection) or < 114.75 (breakdown) · Stop 116.90–117.00 (rejection) / 115.17 (breakdown) · TP1 115.16 · TP2 114.16 · TP3 111.97 · R/R ≈ 1.5–2.5.
__________________________________________________________________________________
Multi-Timeframe Insights
__________________________________________________________________________________
Higher timeframes lean up, but the supply band at 116.2k–118k caps momentum.
1D/12H: Uptrend, compressing below 116.7k; a daily close > 118k would open 120k.
6H/4H/1H: Active range 115.16k ↔ 116.18/116.74k; buy-the-dip works above 115.16k if volumes confirm; intraday is whip-prone.
2H/30m/15m: 115.16k is the hinge; very high volumes create wicks — wait for clean retests; ISPD/MTFTI favor scalps while 115.16k is defended.
Key divergence: Risk On / Risk Off Indicator = NEUTRE VENTE vs MTFTI Up — keep size modest and demand follow-through post-break.
__________________________________________________________________________________
Macro & On-Chain Drivers
__________________________________________________________________________________
FOMC is the key macro catalyst in a hesitant risk-on regime, while on-chain/flows remain more subdued than euphoric phases.
Macro events: 25 bps cut expected; dot-plot and Powell Q&A as triggers; “sell-the-news” possible. US Retail Sales can pre-position flows; softer China data is a growth headwind.
Bitcoin analysis: Pressing the upper band (116.4k) and 116.7k–118k supply; a clean close above 118k opens >120k; a decisive loss of 115k reopens 114.16k → 111.97k.
On-chain data: ETF flows declining, derivatives more influential; range 110k–116k — sustained holds above 114k attract flows; below 108k raises HTF downside risk.
Expected impact: Macro/on-chain mix argues for “confirmation first, size second”; it supports a cautious bias until > 116.74k breaks with volume.
__________________________________________________________________________________
Key Takeaways
__________________________________________________________________________________
BTC is coiling just below 116.7k–118k into FOMC week.
- Trend: Higher-timeframe bullish but capped; slight risk-off background (Risk On / Risk Off Indicator = NEUTRE VENTE).
- Prime setup: Confirmed breakout > 116.74k (retest held) toward 118k/120k; alternatively, a break < 114.16k puts 111.97k back in play.
- Macro: FOMC is well priced — first move can be a head fake.
Stay disciplined: seek confirmations and retests, scale in tranches, and let the market show persistence. ⚖️

BTC Tactical Plan: buy retests, validate breakouts__________________________________________________________________________________
Market Overview
__________________________________________________________________________________
BTC is pinned beneath the 115.8k–116.8k supply after a clean rebound off 107.8k, with dense HTF supports just below. Intraday momentum is constructive but capped by overhead supply and a mild risk‑off backdrop.
Momentum: Bullish 📈 but capped under 116k–117k; 6H/4H trend is up while daily stalls at supply.
Key levels:
• Resistances (D/12H) : 115.8k–116.8k (active supply), 118.6k–118.8k (former supply), 124.3k (D high).
• Supports (4H/12H/W) : 114.9k–114.3k (demand block), 113.4k (12H pivot), 112.0k–110.1k (W/240 zone).
Volumes: Intraday elevated (1H/2H VERY HIGH), 4H moderate, Daily normal — enough to power a breakout if 116k gives.
Multi-timeframe signals: 12H/1D filters “Up”; 6H/4H bullish with a flag below 116k; micro‑TFs split (30m neutral‑sell vs 15m neutral‑buy).
Risk On / Risk Off Indicator context: NEUTRE VENTE — mild risk‑off that contradicts price momentum; demand confirmation before adding risk.
__________________________________________________________________________________
Trading Playbook
__________________________________________________________________________________
Dominant trend is up on 6H→1D but capped by HTF supply; favor disciplined buy‑the‑dip or confirmed breakouts with tight invalidations.
Global bias: Slightly bullish as long as 113.4k holds on closes; key invalidation if D < 113.4k.
Opportunities:
• Tactical buy on 114.9k–114.3k retest with lower‑wick rejection and close > 114.8k (2H/4H).
• Breakout buy on close ≥ 116.0k then ≥ 116.7k with rising volume.
• Tactical sell on 115.8k–116.3k rejection confirmed by close < 114.8k (2H/4H), targeting 113.4k.
Risk zones / invalidations: A break of 113.4k opens 112.0k–110.1k (invalidates the long bias). A daily close > 116.8k invalidates counter‑trend shorts.
Macro catalysts (Twitter, Perplexity, news):
• Fed rate‑cut expectations → liquidity support, aiding breakouts above 116.7k.
• Crypto flows: spot ETF inflows and a fresh USDT mint support buy‑the‑dip behavior.
• Tariff/sanctions headlines and geopolitics → risk‑off triggers that fit a NEUTRE VENTE Risk On / Risk Off Indicator.
Action plan:
• Long plan : Entry 114.9k–114.6k or close ≥ 116.0k; Stop 113.9k; TP1 115.6k, TP2 116.7k, TP3 118.6k → R/R ~1.4–2.5x.
• Short plan : Entry 115.8k–116.0k (rejection), Stop 116.8k; TP1 114.4k, TP2 113.4k, TP3 112.0k → R/R ~1.5–2.2x.
__________________________________________________________________________________
Multi-Timeframe Insights
__________________________________________________________________________________
Overall, HTFs are bullish but pressed under daily supply, while LTFs carry the volume to decide the break.
1D/12H: “Up” filters with 113.4k and 110.1k–112.0k supports; upside validation requires firm acceptance above 116.8k.
6H/4H: Ascending structure with a flag below 116k; breakout 116.0k→116.7k unlocks 118.6k.
2H/1H: Very high volumes near 116k; 114.9k–114.3k retests remain buy zones while 113.4k holds.
Major divergences/confluences: Price momentum vs Risk On / Risk Off Indicator at NEUTRE VENTE — demand confirmed closes/volume on breakouts are essential.
__________________________________________________________________________________
Macro & On-Chain Drivers
__________________________________________________________________________________
Macro/liquidity is broadly supportive but offset by headline risk and seasonality.
Macro events:
• Market expects multiple 25‑bp Fed cuts — supportive for BTC’s liquidity beta.
• ECB messaging is mixed; gold’s strength aids risk appetite but Europe’s tone stays cautious.
• Tariffs/sanctions (G7/EU) and Eastern Europe tensions — potential risk‑off shocks.
Bitcoin analysis: Supply 115.8k–116.8k; supports 114.9k–114.3k and 113.4k. Recent spot ETF inflows and a 1B USDT mint are constructive; whale flows remain mixed.
On-chain data: ETF netflows moderate; derivatives more influential (basis <10%, elevated options OI, softening IV) — healthier structure but still spot‑dependent.
Expected impact: Liquidity and rate‑cut hopes favor a clean break above 116.7k; otherwise, headlines can accelerate price toward 113.4k/112.0k.
__________________________________________________________________________________
Key Takeaways
__________________________________________________________________________________
BTC sits in a high range beneath 116k–117k with strong HTF supports just below.
- Trend: constructive/bullish but capped; confirmation needed above 116.8k.
- Top setup: buy 114.9k–114.3k retests or 116.0k→116.7k breakout with volume.
- Macro: dovish Fed expectations support; tariffs/sanctions headlines remain the wild card.
Stay disciplined: let price confirm above 116.7k… or pivot to plan B below 113.4k. 🎯

BTC: 114.2k–116k Decision Zone into CPI__________________________________________________________________________________
Market Overview
__________________________________________________________________________________
BTC is consolidating just below 114k after reclaiming 112k–112.5k, sitting in a 113.5k–114.5k decision zone. Intraday drives higher, while HTF remains cautious into CPI.
Momentum: Tactical bullish 📈 — higher highs/lows on 4H→1H, but capped below 114.2k–116k.
Key levels:
• Resistances (4H/1H): 114.2k–114.6k | (6H/12H): 115.5k–116.0k | (12H): 117.0k
• Supports (2H): 113.0k–113.2k | (W/4H): 111.9k–112.3k | (4H): 110.8k
Volumes: Normal on 1D/12H, Moderate on 4H/2H, Very high on 1H/30m/15m during impulses.
Multi-timeframe signals: 1D/12H MTFTI Up but broader caution; 4H/2H/1H in NEUTRE ACHAT with rising volumes; short‑term divergence as 12H is still hesitant.
Risk On / Risk Off Indicator: NEUTRE VENTE — a mild risk‑off backdrop that contradicts intraday momentum; watch for a flip to NEUTRE ACHAT to validate continuation.
__________________________________________________________________________________
Trading Playbook
__________________________________________________________________________________
Approach: favor continuation buys on breakout with quick invalidations while HTF remains mixed.
Global bias: Tactical NEUTRE ACHAT above 113.6k; swing invalidation if 111.9k then 110.8k break.
Opportunities:
• Breakout buy: 2H/4H close > 114.6k → aim 115.6k then 117k; stop 113.6k.
• Pullback buy: 112.2k–112.3k with absorption/volume → 114.6k / 115.8k / 117k; stop 111.5k.
• Tactical sell: failure below 114.3k + close < 113.0k → 111.9k then 110.8k; stop 113.6k.
Risk zones / invalidations: Repeated rejection below 114.3k followed by a 113.6k loss opens 112k; losing 111.9k then 110.8k invalidates the tactical bullish bias.
Macro catalysts (Twitter, Perplexity, news):
• US CPI Thursday: benign print supports a 114.6k break; hot CPI favors a fade under 114.3k.
• US labor softening: bolsters rate‑cut odds (tailwind if CPI undershoots).
• Pro‑crypto policy tone (SEC/HK): marginally improves regime if levels confirm.
Action plan:
• Entry: 114.65k (2H/4H close) / Stop: 113.60k / TP1: 115.60k, TP2: 117.00k, TP3: 118.50k
• Approx R/R: ~1.5R to TP1, ~3R to TP2; scale size if volumes stay Very high and Risk On / Risk Off Indicator flips ≥ NEUTRE ACHAT.
__________________________________________________________________________________
Multi-Timeframe Insights
__________________________________________________________________________________
Intraday risk‑on, HTF cautious: continuation is possible but needs regime confirmation.
1D/12H: MTFTI Up, yet backdrop “NEUTRE VENTE”; bounded between 111.9k–110.8k base and 114.2k–116k cap; daily HH above 113.5k needs confirmation.
6H: Ascending sequence from 110.8k; resistances 114.2k–114.6k then 115.5k–116k; pullback 112.2k–112.3k is attractive if volume confirms.
4H/2H/1H/30m/15m: NEUTRE ACHAT with rising volumes; breakout > 114.6k is primary setup; key divergence: Risk On / Risk Off Indicator still NEUTRE VENTE outside 15m → wait for confirmation.
__________________________________________________________________________________
Macro & On-Chain Drivers
__________________________________________________________________________________
Macro is the referee: CPI and weak labor frame risk, while on‑chain/crypto flows are constructive but demand confirmation.
Macro events: CPI in focus (moderate consensus); very weak US labor supports rate‑cut narrative; selective global risk‑on (Japan ATH, China recovery); pro‑crypto policy signals (SEC/HK) add a marginal tailwind.
Bitcoin analysis: Daily trend reclaimed >113.5k; immediate resistance 114.2k; acceptance >117k would open 124.3k extension; strong alt rotation can cap BTC’s relative upside; short clusters imply squeeze risk if breakout validates.
On-chain data: Accumulation 108k–116k (URPD); STH ~60% in profit = fragile neutral state; neutral funding (compression risk); slower spot ETF inflows — need a firm close >114.2k–116k to convert.
Expected impact: “Cool” CPI + pro‑crypto tone backs a breakout >114.6k; “hot” CPI favors a move back to 112k/110.8k.
__________________________________________________________________________________
Key Takeaways
__________________________________________________________________________________
Market at an inflection into CPI: intraday bullish, HTF cautious.
- Trend: tactically bullish, but needs confirmation above 114.6k (then 117k).
- Top setup: validated 2H/4H breakout > 114.6k with volume → 115.6k/117k; alternative pullback buy at 112.2k.
- Key macro: CPI and weak labor steer near‑term risk‑on/off.
Stay disciplined: wait for the signal or de‑risk pre‑event — invalidations are close, use them. 🚦

BTC capped at 113.2k–115.2k: fade rallies, watch CPI__________________________________________________________________________________
Market Overview
__________________________________________________________________________________
BTC is chopping in the low-110k, capped by a stacked 113.2k–115.2k supply zone, with macro headline risk elevated into CPI.
Momentum: 📉 Range with bearish tilt — upside attempts fail below 113.2k–114k while HTF pressure remains risk-off.
Key levels:
• Resistances (HTF/LTF) : 113.2k–113.4k (LTF/240 PH) · 114.5k–115.3k (HTF/720 PH) · 116.6k (recent high, HTF).
• Supports (HTF) : 111.9k–112.0k (W pivot) · 110.8k (240 PL) · 107.8k (D PL).
Volumes: Normal on HTF; “moderate” upticks on 1H–30m during failed breakouts.
Multi-timeframe signals: 1D/12H/6H trend down; 4H–1H mixed with a hard cap at 113.2k–114k; 15m micro-bullish while 111.96k holds. Strong confluence at 113.2k → 115.2k resistance and 111.96k/110.77k/107.8k supports.
Risk On / Risk Off Indicator: NEUTRAL SELL ; Global Risk Regime stays STRONG SELL — confirms the bearish bias and fades micro-rallies.
__________________________________________________________________________________
Trading Playbook
__________________________________________________________________________________
As long as 113.2k–115.2k caps price, favor “sell the rip” and only buy on confirmed signals.
Global bias: SELL while below 115.24k; major short invalidation on daily > 116.6k.
Opportunities:
• Tactical short on 113.2k–114.0k rejection toward 112.0k/111.0k; inval. above 115.3k.
• Breakout long only on H1/H4 acceptance > 113.3k (retest holds) toward 114.6k/115.24k; inval. below 111.9k.
• Defensive long on clean reaction at 110.8k or 107.8k if risk blocks improve (≥ NEUTRAL BUY on LTF).
Risk zones / invalidations: Break < 110,77k voids defensive longs (opens 107.8k); H4/D12 close > 115.24k voids range shorts (opens squeeze to 116.6k).
Macro catalysts (Twitter, Perplexity, news): CPI next (direct vol around 111k–112k pivot) · Geopolitics (NATO Article 4; Middle East) supports risk-off · US tariff path (SCOTUS) preserves trade-policy uncertainty.
Action plan:
• Fade-rally short : Entry 113.2k–114.0k / Stop 115.3k / TP1 112.0k · TP2 111.0k · TP3 110.8k / R:R ~1.8–2.5.
• Breakout long : Entry > 113.3k (confirmed retest) / Stop 111.9k / TP1 114.6k · TP2 115.24k · TP3 116.6k / R:R ~1.6–2.2.
__________________________________________________________________________________
Multi-Timeframe Insights
__________________________________________________________________________________
HTFs remain bearish while LTFs attempt extensions under a dense overhead supply.
1D/12H/6H: Downtrend, rallies capped below 113.2k–115.2k; dominant supply, supports layered at 111.96k → 110.77k → 107.8k.
4H/2H/1H: Mixed reads; need a clean close > 113.24k to open 114.6k–115.24k, otherwise frequent fades back to 111.96k.
30m/15m: 30m cautious (STRONG SELL) vs 15m micro-bullish (NEUTRAL BUY); classic pre-catalyst divergence — wait for H1/H4 confirmations.
Confluence/Divergence: Heavy multi-TF supply 113.2k → 115.2k; risk-on equities vs risk-off credit/crypto warns against chasing crypto bounces.
__________________________________________________________________________________
Macro & On-Chain Drivers
__________________________________________________________________________________
Macro is mixed (gold ATH, firm oil, US equities buoyed by cut hopes) while geopolitics heats up and CPI looms.
Macro events: CPI imminently (sets risk tone) · NATO Article 4/Middle East tensions (risk premia higher) · US tariff track (SCOTUS) sustains uncertainty.
Bitcoin analysis: 100–1k BTC cohorts accumulating, 1k–10k distributing — potential cap on impulsive upside; ETF flows cooling, consistent with consolidation below 114k–116k.
On-chain data: Activity skewed by inscriptions/runes; sentiment in “fear” (44/100) implies positioning not crowded long.
Expected impact: Range-to-down bias while < 113.3k–115.2k; a benign CPI could trigger a push > 113.3k toward 114.6k/115.24k.
__________________________________________________________________________________
Key Takeaways
__________________________________________________________________________________
The market stalls under multi-TF supply as key catalysts approach.
- Overall trend: 📉 bearish on HTF; LTFs try but stall below 113.2k–114k.
- Best setup: Fade 113.2k–114.0k into CPI with active management.
- Key macro: CPI and geopolitics drive the global risk regime.
Stay disciplined around the 111.9k–112.0k pivot and let confirmation lead exposure. ⚠️

Bitcoin tight range below 113.24–114k, FOMC in focus__________________________________________________________________________________
Market Overview
__________________________________________________________________________________
BTC is ranging tightly: repeated rejections below 113,24–114,0k while 111,956 support still holds. Momentum is split with 1D/12H constructive and 4H–6H still leaning lower.
Momentum: range ⚖️ — bounces above 111,956 but a firm 113,24–114,0k cap stalls extensions.
Key levels:
• Resistances (D/12H/4H): 113.24–114.0k · 114.8k (extension) · 121–124k (HTF).
• Supports (D/12H/4H): 112.2/111,956 · 110,086 · 107,026.
Volumes: broadly normal to moderate; very high spikes on LTF during rejections around 113.2–113.3k.
Multi-timeframe signals: 1D/12H held (constructive), 4H–6H down (pressure at the cap), 1H/LTF counter‑trend pops.
Risk On / Risk Off Indicator: NEUTRAL SELL 🟠 — slight sell bias that aligns with the ceiling at 113.24–114.0k.
__________________________________________________________________________________
Trading Playbook
__________________________________________________________________________________
Strategic stance: as long as 113.24–114.0k caps price, favor defensive range-trading; switch to pro‑breakout only on confirmed acceptance.
Global bias: overall = NEUTRAL SELL (mild) while below 113.24–114.0k; invalidated on 12H close above 113,241 with volume.
Opportunities:
• Defensive buy at 112.2–111,956/110,086 → aim 113.2–114.0k; stop < 110,086.
• Rejection short at 113.24–114.0k → aim 112.2 then 111,956; stop > 114.3k.
• Bullish breakout on 4H/12H close > 113,241 + successful retest → aim 114.8k then 121–124k; stop below 113.1 (failed retest).
Risk zones / invalidations:
• Break below 110,086 ⚠️ re‑opens 107,026 and invalidates range longs.
• “Fake breaks” above 113,241 without volume expansion → trap risk.
Macro catalysts (Twitter, Perplexity, news):
• FOMC in focus (high odds of a rate cut) → potential volatility around pivots.
• Firm USD → headwind for risk assets, capping BTC near resistance.
• Asian risk tone constructive (Nikkei record) + adoption (BBVA custody, KuCoin Pay) → medium‑term structural support.
Action plan:
• Defensive Long: Entry 112.2–111,956 | Stop < 110,086 | TP1 113.2 | TP2 114.0k | TP3 114.8k | R/R ~1.5–2.0R.
• Rejection Short: Entry 113.24–114.0k | Stop > 114.3k | TP1 112.2 | TP2 111,956 | TP3 110,086 | R/R ~1.3–1.8R.
• Breakout Long: Entry on 4H/12H close > 113,241 + retest | Stop < 113.1 | TP1 114.8k | TP2 116.0k | TP3 121–124k | R/R ~1.8–3.0R.
__________________________________________________________________________________
Multi-Timeframe Insights
__________________________________________________________________________________
Higher timeframes hold structure, mid timeframes weigh on momentum, and LTFs rotate quickly near range edges.
1D/12H: constructive above 111,956, yet 113.24–114.0k is still the lid; acceptance > 113,241 would unlock 114.8k then 121–124k.
6H/4H: bearish tilt with frequent rejections below 113.2–114.0k; “normal” volumes → prefer selling range highs until 114.0k is absorbed.
2H/1H: tactical “buy the dip” while 111,956 holds, but no trend confirmation without a close > 113,241.
30m/15m: very high volume on rejections at the cap → “fake break” risk; scalping window between 112.0–113.3k.
__________________________________________________________________________________
Macro & On-Chain Drivers
__________________________________________________________________________________
Macro is mixed (strong USD vs Asian risk‑on) with FOMC risk ahead; on‑chain supports a consolidation narrative with cooler TradFi flows but improving adoption.
Macro events:
• FOMC: rate cut expectations → directional impulse possible, but also whipsaw risk.
• Strong USD: short‑term headwind for BTC, consistent with capping near resistance.
• Nikkei 225 at record highs: constructive Asian risk tone partly offsets USD drag.
Bitcoin analysis:
• Adoption/flows: BBVA (custody via Ripple) and KuCoin Pay (on‑chain payments) support future demand; Metaplanet adds to “corporate accumulation.”
• Critical zones: reclaiming 114–116k is needed to re‑ignite momentum; below 110,086 risks a 107,026 retest.
On-chain data:
• Accumulation between 108–116k; STH profitability ~60% → fragile without a push above 114–116k.
• ETF/futures inflows cooling → limited near‑term conviction.
Expected impact:
• Range likely persists while 113.24–114.0k holds; upside requires a high‑volume breakout, otherwise expect rotations and traps.
__________________________________________________________________________________
Key Takeaways
__________________________________________________________________________________
BTC is range‑bound with a credible cap at 113.24–114.0k and a defended floor at 111,956.
- Trend: neutral to slightly bearish while 4H–6H remain down and 113,241 isn’t reclaimed.
- Best setup: rejection shorts at 113.24–114.0k or defensive longs at 112.2–111,956 with tight risk.
- Key macro: FOMC ahead, with a firm USD acting as a near‑term brake.
Stay nimble: trade the edges, and only chase breaks backed by volume. 🔔
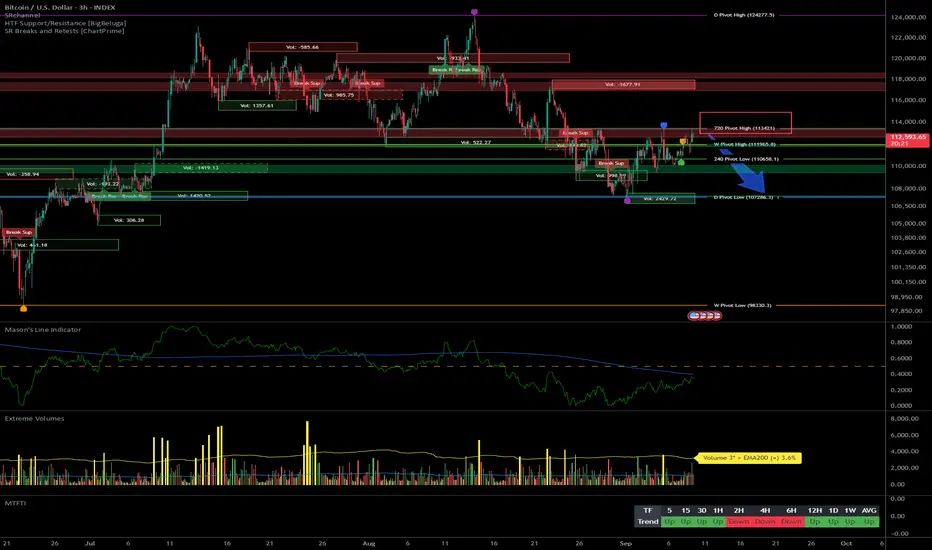
BTC 112.5k Gate: Breakout or Fade the Range?__________________________________________________________________________________
Market Overview
__________________________________________________________________________________
BTC is coiling around 111–112k, trapped between 112.0–112.5k supply and 110.1k/107.3k supports. The setup is mixed: HTF still up, MT corrective, LTF rebounding cautiously.
Momentum: 📉 Slightly bearish in intraday/MT, with defended lows but lower highs below 112.5k.
Key levels:
- Resistances (12H–1W): 112.0–112.5k (local supply), 115.9k (720/12H PH), 119.7k (W PH).
- Supports (4H–1W): 110.1k (4H PL), 107.3k (D PL), 98.3k (W PL).
Volumes: Overall normal; moderate spikes on 15m during failed breakouts.
Multi-timeframe signals: 1D/1W Up, 4H–12H Down, 15m–2H Up → range confirmed; 112.5k remains the pivot to unlock 113.5k/115.9k.
Risk On / Risk Off Indicator: VENTE (risk-off) — it confirms caution and caps rebounds below 112.5k.
__________________________________________________________________________________
Trading Playbook
__________________________________________________________________________________
Strategic stance: HTF trend intact but MT corrective — stay tactical, trade the range until 112.5k breaks.
Global bias: “NEUTRAL SELL” below 112.5k; cautious bias invalidated on a 1H/2H close > 112.5k.
Opportunities:
- Momentum buy: confirmed breakout above 112.5k → target 113.5k then 115.9k.
- Range sell: fade clean rejections at 112.0–112.5k while 4H–6H remain Down.
- Defensive buy: wick + reclaim at 110.1k (or 107.3k) with tight risk.
Risk zones / invalidations:
- Below 110.1k: opens 107.3k, then 98.3k.
- Above 112.5k: risk of squeeze toward 115.9k (invalidates shorts).
Macro catalysts (Twitter, Perplexity, news):
- Weak US jobs → higher odds of a Fed cut (risk-on if FOMC guidance cooperates).
- OPEC+/WTI easing → less inflation pressure, supports dovish narrative.
- JPY/JGB risk and US office CMBS stress → volatility noise and “hard asset” bid.
Action plan:
- Plan A (bullish breakout): Entry > 112.6k (1H/2H close) / Stop < 111.6k / TP1 113.5k, TP2 115.9k, TP3 119.7k (R/R ~1:2–1:3).
- Plan B (range short): Entry 112.0–112.5k on rejection / Stop > 112.8k / TP1 111.0k, TP2 110.1k, TP3 107.3k (R/R ~1:1.5–1:2.5).
__________________________________________________________________________________
Multi-Timeframe Insights
__________________________________________________________________________________
HTFs hold the uptrend structure while MTs correct; LTFs attempt cautious recoveries below 112.5k.
1D/1W: Uptrend intact above 104k; 115.9k–119.7k is the directional cap, need strong closes to open 124.3k later.
4H/6H/12H: Corrective with lower highs; concentrated supply at 112.0–112.5k — break required to free 115.9k.
15m/30m/1H/2H: Tech rebound off ~110k; attempts to reclaim 111.8–112.2k but volume confirmation is still tentative.
Key divergence: LTF bullish vs MT bearish → prioritize tactical setups (confirmed breakout or mean reversion at the edges).
__________________________________________________________________________________
Macro & On-Chain Drivers
__________________________________________________________________________________
Macro leans dovish, while on-chain/flows are neutral to mildly supportive.
Macro events: Soft US labor boosts cut odds; WTI easing on OPEC+ supply signals lowers inflation pressure; watch JPY/JGB for FX/vol shocks.
Bitcoin analysis: Consolidation 104k–116k; potential supply overhang from Movie2K wallets (~45k BTC); spot ETF inflows slowing curb external momentum.
On-chain data: Cooling funding, rising stablecoin supply (constructive mid-term), STH sensitive around 114k–116k.
Expected impact: Dovish FOMC would ease a reclaim above 112.5k → 115.9k; hawkish tone likely sends price back to 110.1k then 107.3k.
__________________________________________________________________________________
Key Takeaways
__________________________________________________________________________________
BTC is in a “decision range” 110.1k–112.5k inside the broader 104k–116k channel.
- Trend: HTF bullish, MT bearish, LTF rebounding → cautious bias below 112.5k.
- Key setup: Break & hold > 112.5k to target 113.5k/115.9k; otherwise fade 112.0–112.5k.
- Macro: Rising odds of a Fed cut + softer WTI favor a squeeze if the technical trigger appears.
Stay disciplined: trade confirmation, not anticipation — 112.5k is the key. 🔑

HBARUSDT 1H Chart Analysis | Bullish Structure in PlayHBARUSDT 1H Chart Analysis | Bullish Structure in Play
🔍 Let’s break down the recent price action for the HBAR/USDT perpetual contract and outline the roadmap for potential bullish continuation.
⏳ 1-Hour Overview
The 1-hour chart shows HBAR recovering from a strong demand zone near $0.21100, pushing upward with notable momentum. Price action is now challenging immediate resistance at $0.22372, with higher levels at $0.22824 and $0.23743 presenting the next bullish targets.
🔺 Long Setup:
A decisive close and hold above $0.22372 could fuel further upside, targeting the $0.22824 resistance next. Sustained bullish volume and higher lows may pave the way for an extension up to $0.23743, aligning with the drawn projection path.
📊 Key Highlights:
- Strong defense of the $0.21100 support region led to a sharp rebound.
- Immediate resistance stands at $0.22372, with the bullish path mapped toward $0.22824 and $0.23743.
- Volume spikes on upward candles indicate increasing buyer interest and potential for trend follow-through.
🚨 Conclusion:
HBARUSDT is building a bullish structure above local support, with momentum favoring continued upside if $0.22372 flips into support. Watching volume and reaction at key resistance areas remains crucial for confirming the next leg higher.
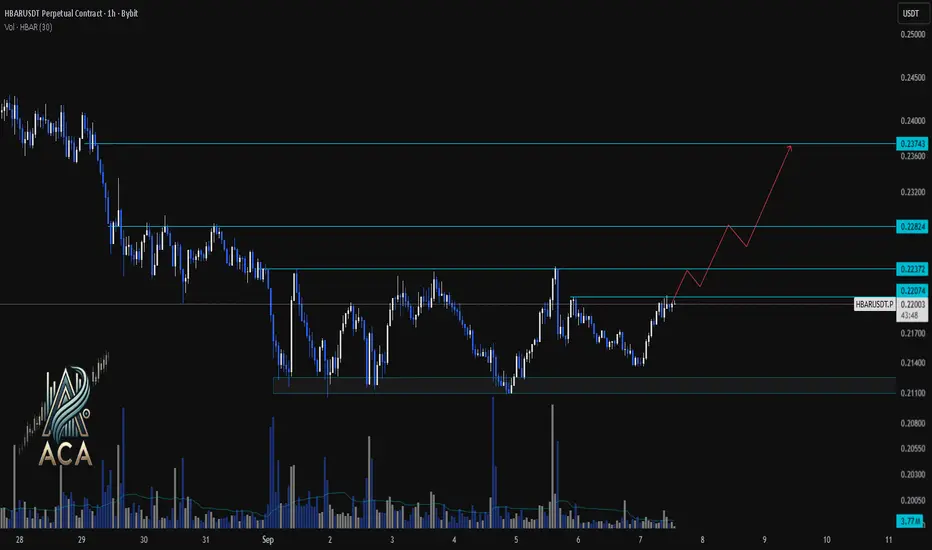
Fade 112k, buy 109.5/108k on signals__________________________________________________________________________________
Market Overview
__________________________________________________________________________________
BTC is consolidating mid‑range within 104k–116k after a clean rejection below the weekly pivot high (~112k). Intraday momentum tilts bearish while higher timeframes remain range‑bound.
Momentum: 📉 Bearish within a range — sellers active at 111.95–112.15, defensive bids lower.
Key levels:
• Resistances (HTF/MTF) : 111.95–112.15 (weekly), 113.5–114.0 (MTF), 115.5 (gate before 118k/121k).
• Supports (HTF/MTF) : 110.2–110.5 (MTF), 109.3–109.8 (MTF), 107.9–108.1 (HTF).
Volumes: Overall normal; moderate pickup on 1H retests of range edges.
Multi-timeframe signals: 2H–6H point Down; 12H–1D more neutral; LTF (15–30m) show range rebounds — consistent with selling 112k rejections and tactical buys at 109.3–109.8 / 107.9–108.1.
Risk On / Risk Off Indicator: SELL (mild risk‑off) — aligns with the bearish bias as long as 112k caps price.
__________________________________________________________________________________
Trading Playbook
__________________________________________________________________________________
In a range with MTF selling pressure, favor sell‑the‑rip and defensive buys on absorption. 🎯
Global bias: NEUTRAL SELL below 112k; key invalidation on a strong close >112.5k.
Opportunities:
• Tactical sell : Fade 111.95–112.15 on signal; target 110.5 then 109.6. (Stop >112.5)
• Defensive buy : Bid 109.3–109.8 on wick/absorption; target 111.1 then 111.9. (Stop <109.3)
• Breakout buy : Only above 112.5 on confirmed retest; target 114.0 then 115.5. (Stop ≈112.0)
Risk zones / invalidations:
• A reclaim >112.5 invalidates the sell bias and opens 114k–116k.
• A clean break <109.3 exposes 108.0 then 106.8/104k.
Macro catalysts (Twitter, Perplexity, news):
• Fed: Waller favors a cut vs Kashkari cautious; Beige Book “little change” — dovish tone would favor 112k/114k tests.
• US labor: ADP/claims/ISM Services today — strong surprises can trigger a break of the 110.3–111.3 micro‑range.
• Inflation mix: Oil <$60 (disinflation) but US tariff risks linger — likely keeps us ranging until 114k–116k is reclaimed.
Action plan:
• Short 112k rejection : Entry 111.95–112.15 / Stop 112.6 / TP1 110.5, TP2 109.6, TP3 108.0 → R/R ≈ 2.0–3.0.
• Defensive long 109.5 : Entry 109.3–109.8 / Stop 109.2 / TP1 111.1, TP2 111.9, TP3 112.5 → R/R ≈ 2.0–2.5.
__________________________________________________________________________________
Multi-Timeframe Insights
__________________________________________________________________________________
HTFs are range‑bound while MTFs (2H–6H) drift lower; LTFs attempt technical rebounds.
1D/12H: Range 104k–116k intact; 111.95–112.15 capping; 107.9–108.1 as base — below 112k, risk skew toward 110.5 then 109.5.
6H/4H/2H: Lower highs in place; prefer selling retests 111.3–111.6 and 111.95–112.15 toward 110.5/109.5.
1H/30m/15m: Micro‑range 110.3–111.3; long scalps from 110.3–110.6 with confirmation ; moderate volume pickup on edge retests.
Key divergences/confluences: Mild risk‑off + MTF Down = bearish confluence below 112k; absence of extreme volume tempers squeeze risk until 114k–116k triggers.
__________________________________________________________________________________
Macro & On-Chain Drivers
__________________________________________________________________________________
Macro is dovish‑but‑uncertain while on‑chain points to a digestion range — a setup favoring tactics over trends.
Macro events: Fed split (Waller pro‑cut, Kashkari cautious), Beige Book steady; JOLTS down with ADP/claims/ISM due — directional volatility risk. Oil <$60 and soft Swiss CPI = disinflation, but US tariffs keep inflation risks alive.
Bitcoin analysis: Broke below daily Ichimoku and retested as resistance; hesitation under a double‑top neckline; 30‑day realized vol low = uncertainty without panic. US spot ETF net inflows +$300.5M (Sept 3) with muted price response.
On-chain data: Accumulation 108k–116k (URPD) and lost high cost‑basis → 104.1k–114.3k corridor; STH ~60% in profit = fragile; neutral funding and slowing ETF intake = capped momentum.
Expected impact: While 112k isn’t reclaimed with volume, bias stays NEUTRAL SELL ; above 114k–116k, risk‑on resumes.
__________________________________________________________________________________
Key Takeaways
__________________________________________________________________________________
A controlled range persists with an active 112k ceiling and selective dip‑bidding lower.
- Overall trend: 📉 tactical bearish within a HTF range.
- Top setup: Fade 111.95–112.15 with invalidation >112.5 and targets 110.5/109.6/108.0.
- Macro key: Fed‑lean dovish but labor/ISM data could swing momentum toward 112k or down to 109.5.
Stay disciplined: trade the range, protect stops, and let closes above 112.5 and 114–116k speak. 🧭

Bitcoin range: 110k defended, 111.9–114k caps the upside__________________________________________________________________________________
Market Overview
__________________________________________________________________________________
BTC is consolidating above 108.7–109.0k after the pullback from ATH, capped under 111.9–114.0k. Short-term momentum is improving while 6H/12H remain corrective.
Momentum: 📈 Neutral-to-slightly bullish above 110k, but capped by 111.9–113.5k; 6H/12H still in a corrective trend.
Key levels:
- Resistances (HTF/MTF) : 111.9–113.5k (W/720 pivots), 114.0k (240 PL→R), 120.0k (W PH).
- Supports (HTF/MTF) : 110.0–110.2k (recent shelf), 108.7–109.0k (720 PL cluster), 107.3k (240 PL).
Volumes: Very high on 2H/1H/30m/15m; normal on 1D → credible rebound, not yet HTF-validated.
Multi-timeframe signals: 1D in NEUTRAL BUY above 108.7k; 12H/6H/4H trending down (sell-the-rips below 111.9–113.5k); STTF (2H/1H) improving on volume.
Risk On / Risk Off Indicator context: SELL (moderate risk-off) → contradicts the intraday bounce, so be cautious until 114.0k is reclaimed.
__________________________________________________________________________________
Trading Playbook
__________________________________________________________________________________
Compressed range: favor opportunistic executions at the edges; wait for confirmed breaks.
Global bias: Neutral-to-slightly long above 110k while 108.7k holds; swing invalidation on 1D close below 108.7k.
Opportunities:
- Defensive buy on 110.0–110.2k retest; target 111.9k then 113.5k if break confirms.
- Tactical sell on rejection at 111.9–113.5k; target 110.0k then 108.8k.
- Breakout buy if 12H/1D close >114.0k; target 117.4k.
Risk zones / invalidations:
- Loss of 108.7k on HTF close invalidates longs, opens 107.3k then 95.3k if weakness extends.
- Acceptance >114.0k invalidates most shorts, exposing 117.4k.
Macro catalysts (Twitter/News):
- Fed leaning to a 25bp cut (Sep 17 FOMC) with a bull steepener → supports dip buys if ISM/Jobs confirm.
- Gold at record (>3,500$/oz), softer USD, Asian equities broadly positive → mild tailwind for risk.
- Policy divergence (ECB dovish, BOJ cautious) + geopolitics → potential capping below 113.5–114.0k.
Action plan:
- Long Plan: Entry 110.0–110.2k / Stop 109.6k / TP1 111.4k, TP2 111.9k, TP3 113.5k (≈1.8–2.5R).
- Short Plan: Entry 112.0–113.0k on rejection / Stop 113.7k / TP1 110.0k, TP2 108.8k, TP3 107.3k (≈1.6–2.2R).
__________________________________________________________________________________
Multi-Timeframe Insights
__________________________________________________________________________________
Overall, timeframes are compressing: HTF resilient, MTF corrective, STTF recovering on strong volumes.
1D: Holding above 108.7–109.0k; acceptance >114.0k would open 117.4k then 120.0k.
12H/6H/4H: Lower highs/lows, favor sell-the-rips below 111.9–113.5k; rejection there likely retests 110.0k then 108.8k.
2H/1H/30m/15m: Strong-volume rebound; as long as 110k holds, a squeeze toward 111.9k then 113.5k is possible; losing 110k points back to 108.8k.
Key confluences: Multi-TF support 108.7–109.0k; ceiling 111.9–113.5k with 114.0k as decision level → compressed structure favors an imminent move.
__________________________________________________________________________________
Macro & On-Chain Drivers
__________________________________________________________________________________
Macro modestly supports dip-buys while background risk-off tempers upside; on-chain is neutral-to-cautious, aligned with the technical range.
Macro events: Markets price Fed cuts with a bull steepener; gold at record (>3,500$/oz), softer USD, Asia broadly green; ECB leaning dovish, BOJ cautious; upcoming US CPI/PMI/ISM and Jobs in focus.
Bitcoin analysis: Ichimoku Tenkan/Kumo as overhead resistance; key pivot 110.4–110.7k; some watch 103–100k on downside; ETFs saw net inflows in August despite -6.5% spot → ongoing institutional demand.
On-chain data: Large transfers (e.g., 7,860 BTC, 6,002 BTC) → potential liquidity/volatility; 6m/CTH cost basis near 107–108.9k as support; STH stress near 113.6k; no broad capitulation (SOPR ~1).
Expected impact: Confluence for a 108.7–113.6/114.0 range; easing bias may help a topside break if volumes persist, otherwise rallies cap below 114.0k.
__________________________________________________________________________________
Key Takeaways
__________________________________________________________________________________
BTC sits between 110k support and 111.9–114.0k resistance, with strong intraday volumes but a risk-off backdrop.
- Trend: neutral-to-slightly bullish above 110k, yet MTF remains corrective.
- Best setup: defensive long at 110.0–110.2k with <109.6k invalidation, or rejection short at 111.9–113.5k.
- Macro: Fed cut path and softer USD support dips, but caution below 114.0k.
Stay nimble: trade the edges and wait for a close >114.0k or <108.7k for direction. ⚠️
