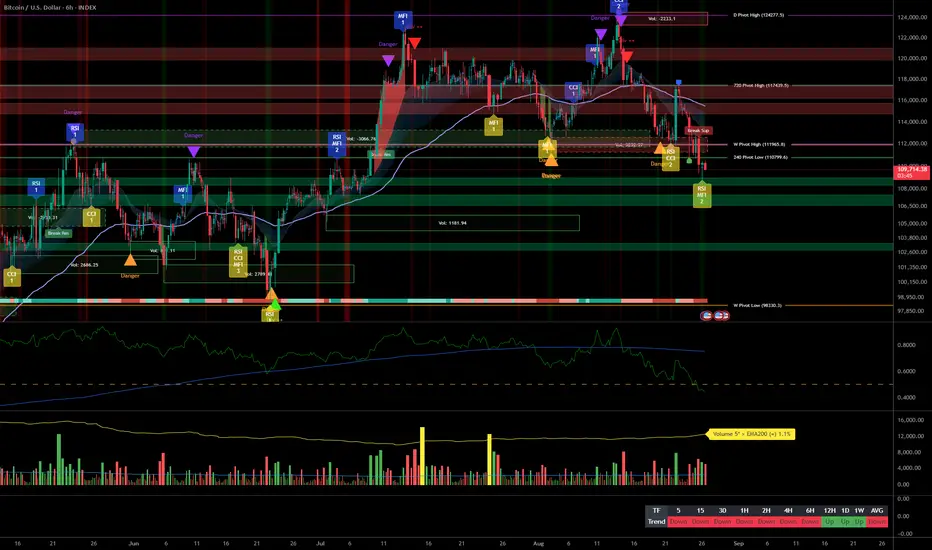
BTC MTF down, LTF volatile: Plan A short, Plan B reclaim__________________________________________________________________________________
Market Overview
__________________________________________________________________________________
BTC is consolidating at the range lows after the 120k–124k rejection, pressing the 108.8k pivot with a dominant bearish bias and sold rallies.
Momentum: Bearish 📉 — lower highs/lows with price pinned at 108.8k (12H/1D pivot).
Key levels:
• Resistances (4H–1D) : 110.9k–111.0k; 111,956 (W Pivot High); 113.5k.
• Supports (4H–1W) : 108.7k–108.8k (720 Pivot Low); 107,413 (240 Pivot Low); 98,353 (W extension).
Volumes: Normal on HTF; moderate on 1–2H; very high spikes on 30m → volatility concentrated on LTF.
Multi-timeframe signals: MTF trend is Down (1D/12H/6H); only notable exceptions are ISPD BUY on 2H/4H hinting at limited technical bounces toward 111k/113.5k.
Risk On / Risk Off Indicator: SELL — confirms the bearish momentum and risk-off regime, aligned with repeated rejections below 111k/111,956.
__________________________________________________________________________________
Trading Playbook
__________________________________________________________________________________
Strategic stance: with MTF downtrend and risk-off regime, favor selling rallies while staying nimble if a confirmed reclaim > 111,956 occurs.
Global bias: NEUTRAL SELL; key invalidation on a daily close > 111,956.
Opportunities:
• Short on rejection at 110.9k–111.96k → target 108.76k then 107.41k.
• Breakdown short on clean loss of 108.76k → possible extension into 107.41k.
• Counter-trend long only after a confirmed reclaim > 111,956 with volume → target 113.5k then 117.5k.
Risk zones / invalidations:
• A daily reclaim > 111,956 invalidates the short bias.
• A confirmed loss of 107.41k invalidates rebound scenarios and opens downside risk (98.35k in HTF view).
Macro catalysts (Twitter/News):
• Fed (Daly) turning dovish → potentially supportive for risk if confirmed.
• Elevated geopolitical tensions → higher risk premium, supportive of risk-off.
• US markets closed Monday (Labor Day) → thinner liquidity, amplified BTC volatility.
Action plan:
• Plan A (preferred, range short): Entry 111.0k–111.9k / Stop 112.6k / TP1 108.76k, TP2 107.41k, TP3 98.35k (optional) → R/R ~2.0–3.0.
• Plan B (bullish contingency): After a 1D close > 111,956, buy pullback 112.0k–112.2k / Stop 111.0k / TP1 113.5k, TP2 117.5k, TP3 120k (retest zone) → R/R ~1.5–2.5.
__________________________________________________________________________________
Multi-Timeframe Insights
__________________________________________________________________________________
HTFs remain bearish while LTFs are volatile with a few unconfirmed bounce signals.
1D/12H/6H: LH/LL structure capped below 110.9k–111.96k; pressure on 108.76k then 107.41k; below 107.41k opens a window to 98.35k extension.
4H/2H: NEUTRAL SELL with local ISPD BUY; bounces toward 111k/113.5k only if > 111,956 is reclaimed, otherwise rallies tend to fail and get sold.
1H/30m/15m: SELL; micro-range 108.3k–109.8k; very high 30m volume → watch for sweeps under 108.7k with quick reclaim for scalps, else continuation toward 107.41k.
__________________________________________________________________________________
Macro & On-Chain Drivers
__________________________________________________________________________________
Macro stays risk-off, but crypto-native flows (ETFs/stablecoins) provide dip support.
Macro events:
• Fed’s Daly hints at recalibration → more dovish tilt, potentially risk-supportive.
• China PMIs are mixed (manufacturing contraction) → fragile global growth signal.
• Hot geopolitics + US holiday → thinner liquidity and higher risk aversion.
Bitcoin analysis:
• Spot ETF net inflows → structural bid.
• Spot demand neutral; perps more sell-leaning; critical 107k–108.9k (6M cost) vs 113.6k (3M cost) as rebound supply.
On-chain data:
• Large seller-related transfers → near-term sell-side risk.
• Rising stablecoin issuance (USDT/USDC) → fresh dry powder to support dips.
Expected impact: Risk-off favors “sell the bounce” below 111,956; ETF inflows and stablecoin liquidity may cushion 108.7k/107.4k; a sustained loss of 107k–108.9k would expose 93k–95k.
__________________________________________________________________________________
Key Takeaways
__________________________________________________________________________________
The market is bearish overall with LTF-driven volatility.
- Trend: bearish/NEUTRAL SELL while capped below 111,956.
- Best setup: sell rallies into 110.9k–111.96k toward 108.76k/107.41k; long only on a confirmed reclaim > 111,956.
- Key macro: risk-off backdrop, partially offset by ETF inflows and rising stablecoin liquidity.
Stay focused: watch 108.76k’s reaction and any reclaim above 111,956 to adjust bias.
__________________________________________________________________________________
__________________________________________________________________________________
Onchain

BTC capped: fade rallies, buy confirmed reclaimd__________________________________________________________________________________
Market Overview
__________________________________________________________________________________
Price is consolidating below a “stair-step” ceiling after the ATH pullback, probing the 108,665 pivot. Intraday flow stays bearish, yet a tactical bounce is possible if 108,665 holds and 111,890 is reclaimed.
Momentum: 📉 Bearish tactically on intraday, compressing around 108,665 with layered resistances overhead.
Key levels:
- Resistances (HTF/4H): 110,860–111,890 (SR-flip + W Pivot High), 113,466 (240 PH), 117,249 (12H/720 PH).
- Supports (12H/Intraday): 108,665 (12H/720 Pivot Low), 107.8k–108.0k (local wicks), 107,133 (intraday VAL).
Volumes: Normal to moderate on 4H; no capitulation seen.
Multi-timeframe signals: Intraday (15m–6H) trends Down; 2H/4H show early buy/divergence, 1D sits Neutral Sell. Any bounce likely capped unless 111,890 is reclaimed, especially with non-extreme volumes.
Risk On / Risk Off Indicator context: VENTE — confirms current bearish tilt and warrants tight risk on tactical longs.
__________________________________________________________________________________
Trading Playbook
__________________________________________________________________________________
Retracement under HTF ceilings: stay defensive — fade rebounds below 111,890 and only buy confirmed reclaims.
Global bias: Neutral Sell while < 111,890; bearish bias invalidated on 4H/D close > 111,890 with acceptance.
Opportunities:
- Tactical long on clean reaction at 108,665 with 2H/4H validation, aiming 110,860 then 111,890.
- First-test fade within 110,860–111,890 on clear rejection; target 108,665 then extension on break.
- Breakout buy above 111,890 if confirmed, targeting 113,466 then 117,249.
Risk zones / invalidations:
- A firm 2H/4H close below 108,665 invalidates longs and opens deeper weekly supports.
- Acceptance > 111,890 invalidates rebound shorts and risks a squeeze toward 113,466/117,249.
Macro catalysts (Twitter, Perplexity, news):
- Fed’s dovish tilt (Waller, Daly) + M2 at ATH: supportive for hard assets medium term, timing uncertain.
- September UST refinancing: typical early-month pressure followed by post-auction bounce — aligns with a near-term dip risk below 111,890.
- Geopolitical tensions (Gaza/Iran): higher near-term risk premium, favoring a defensive posture.
Action plan:
- Defensive Long: Entry 108.7k–108.9k (2H confirmation) / Stop < 108.2k / TP1 110,860, TP2 111,890, TP3 113,466 / R:R ~1.5–2.2.
- Rebound Short: Entry 110.86k–111.89k (clear rejection) / Stop > 111,890 (aggr.) or > 113,466 (cons.) / TP1 108,665, TP2 extension below lows / R:R ~1.8–2.5.
- Breakout Long: Entry on 4H close > 111,890 with volume / Stop < 111.0k / TP1 113,466, TP2 117,249 / R:R ~1.6–2.0.
__________________________________________________________________________________
Multi-Timeframe Insights
__________________________________________________________________________________
Overall, intraday is bearish while HTF is mixed, with a 2H/4H attempt to breathe around the 108,665 pivot.
1D/12H: Neutral Sell; working 108,665 beneath 111,890 — reclaim unlocks 113,466 then 117,249.
6H/4H: Bearish trend with 110,860 SR-flip and 111,890 cap; sellers in control unless these reject; 4H shows early buy divergence.
2H: Early buy/divergence; reclaim of 110,860 can fuel a squeeze toward 111,890.
1H/30m/15m: Bearish micro-structure; failed bounces under 109.0k–109.5k; only invalidated by a firm reclaim > 110,860.
__________________________________________________________________________________
Macro & On-Chain Drivers
__________________________________________________________________________________
Macro is supportive medium term (dovish tilt, abundant liquidity) but short-term risk remains elevated; on-chain frames a critical 107k–109k pivot.
Macro events: Gradual Fed easing setup (Waller/Daly), M2 at ATH, rising gold preference — structural tailwinds for scarce assets; yet September UST refinancing often brings early pressure before a post-auction bid; geopolitics argues for short-term caution.
Bitcoin analysis: Mixed whale/institutional flows — record accumulation but sporadic large sells (dormant 10k BTC); fits a market defending 107k–109k while selling rallies below 113k–114k.
On-chain data: STH cost basis 107k–108.9k (sustained loss opens 93k–95k); relief resistance ~113.6k; perps slightly bearish; limited realized pain — upside capped unless 111.9k/113.6k break.
Expected impact: Technical + on-chain confluence supports a Neutral Sell bias below 111,890, with near-term dip risk before potential post-catalyst buying.
__________________________________________________________________________________
Key Takeaways
__________________________________________________________________________________
Market sits in a low-range beneath HTF ceilings, with 108,665 as the pivotal line.
- Trend: intraday bearish/neutral; HTF mixed until 111,890 is reclaimed.
- Key setup: fade 110.86k–111.89k, or run a defensive long at 108,665 with 2H/4H confirmation.
- Macro: dovish Fed tilt but refinancing/geopolitics keep short-term risk elevated.
Stay disciplined: defend 108,665 with tight stops and trim under 111.9k; above it, let winners ride toward 113,466–117,249. ⚠️

Mild risk-off: 112k key wall, 108.6k floor in focus__________________________________________________________________________________
Market Overview
__________________________________________________________________________________
BTC trades in a tight range below a major 111.9k–112.0k wall, while 108.6k remains a key floor. Macro is balanced, leaving near-term price action driven by technicals.
Momentum: 📉 Mildly bearish — lower highs/lows under 112k, with supports still defended.
Key levels:
• Resistances (W/12H, 2H/1H, 4H) : 111.9k–112.0k (major pivot), 113.0k–113.6k (supply + on-chain 3M cost), 115.3k (240 Pivot High).
• Supports (1H/30m, 2H, 12H) : 110.0k–110.2k (intraday demand), 109.4k–109.6k (2H demand), 108.6k (720 Pivot Low 12H).
Volumes: Normal on 1D–12H, moderate on 4H–2H, and very high on 1H–15m → elevated intraday fakeout risk.
Multi-timeframe signals: Overall MTF in NEUTRAL SELL (1D/12H/6H/2H/1H), with a more constructive 4H (ISPD DIV = BUY) hinting at a tactical bounce if 110.8k holds.
Risk On / Risk Off Indicator context: NEUTRAL SELL → a slight risk-off tone that confirms the cautious momentum below 112k (30m/15m = SELL).
__________________________________________________________________________________
Trading Playbook
__________________________________________________________________________________
Strategy favors “sell the rips below 112k,” while staying ready for defensive longs at 108.6k only on strong reactions.
Global bias: Overall NEUTRAL SELL while below 112.0k on closes; bias invalidation above 112.0k (4H/12H).
Opportunities:
• Range short: Fade 111.3k–112.0k on rejection wick → target 110.2k then 109.6k/108.6k.
• Defensive long: Only on sweep/reclaim of 108.6k with follow-through >110.8k.
• Bullish breakout: Buy 4H/12H close >112.0k → target 113.0k–113.6k then 115.3k.
Risk zones / invalidations:
• Below 108.6k on 4H/1D: long invalidation → risk of downside extension toward lower on-chain clusters.
• Above 112.0k (holding 4H+): short invalidation → fast squeeze likely.
Macro catalysts (Twitter, Perplexity, news):
• PCE in line and a “patient” Fed (Waller open to further cuts) → modest risk support without breaking the technical range.
• Institutional flows: ~$179m net inflows into spot ETFs (Aug 28) → dip-buying support.
• Rising MENA tensions → potential safe-haven bid if escalation.
Action plan:
• Entry (short fade): 111.3k–112.0k / Stop: 112.2k / TP1: 110.2k, TP2: 109.6k, TP3: 108.6k / R/R approx.: 1.5–3.
• Entry (defensive long): Reaction <109.0k with reclaim >110.8k / Stop: <108.6k / TP1: 111.9k–112.0k, TP2: 113.0k–113.6k, TP3: 115.3k / R/R approx.: 2–3.
__________________________________________________________________________________
Multi-Timeframe Insights
__________________________________________________________________________________
Higher timeframes stay under moderate pressure while lower timeframes show marked risk-off and very high volumes.
1D/12H/6H: Corrective structure below 111.9k–112.0k; 108.6k remains the defense pivot — compressive range with capped rebounds while 112k holds.
4H: ISPD DIV = BUY and moderate volumes; if 110.8k holds, a push through 111.9k can target 113.0k–113.6k.
2H/1H/30m/15m: Seller-biased (SELL/NEUTRAL SELL) with very high volumes → prioritize fades at 111.0k–112.0k; beware of fakeouts.
__________________________________________________________________________________
Macro & On-Chain Drivers
__________________________________________________________________________________
Macro is balanced (in-line inflation, patient Fed) while ETF flows and on-chain costs neatly frame the key technical zones.
Macro events: PCE in line with cuts still priced for September; US equities at ATHs support mild risk-on; MENA tensions can add a safety premium.
Bitcoin analysis: Rejection under ~112k with focus on pullback/higher low; ~$179m net spot ETF inflows (Aug 28) reflect institutional dip-buying.
On-chain data: Critical 107k–108.9k support (STH 6M/3M costs) and relief cap near ~113.6k; neutral funding, no broad capitulation.
Expected impact: On-chain/technical confluence reinforces 108.6k as defensive long pivot and 113.0k–113.6k/115.3k as distribution while 112k caps.
__________________________________________________________________________________
Key Takeaways
__________________________________________________________________________________
Tight range below 112k with mild downside pressure and elevated intraday volatility.
- Overall trend: mildly bearish (NEUTRAL SELL) while under 112k.
- Most relevant setup: disciplined fade at 111.3k–112.0k with tight stops; alternative defensive long only on confirmed reaction at 108.6k.
- Key macro factor: In-line PCE + patient Fed; spot ETF inflows back dip-buying.
Stay nimble: respect 112.0k and 108.6k invalidations — fakeouts are frequent ⚠️.

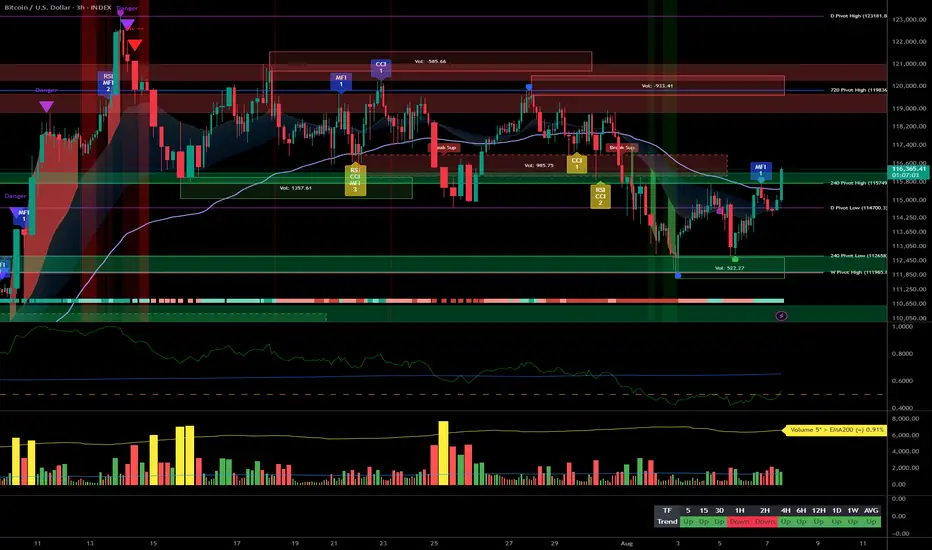
BTC: 114.7k, the squeeze gate — fade or break__________________________________________________________________________________
Market Overview
__________________________________________________________________________________
BTC is bouncing back above the weekly pivot at 111.965k after a clean rejection below the 116–118k supply, with higher timeframes still constructive while mid-timeframes remain under pressure. LTF buyers are active, but a reclaim of 114.7k is required to unlock a squeeze.
Momentum: 📉 Bearish on mid-TFs, 📈 tactical bounce on LTFs; 1D trend remains constructive as long as 98–100k holds.
Key levels:
- Resistances (HTF): 113.6–114.0k (12H supply), 114.7k (key pivot), 117.5k (major cap).
- Supports (HTF): 112.6–111.9k (incl. 111.965k W pivot), 110.9k (240 pivot low), 107–108.9k (on-chain STH zone).
Volumes: Normal on 1D; very high on LTFs (1H/30m/15m) during the rebound leg.
Multi-timeframe signals: 1D/1W = Up; 12H/6H/4H/2H = Down; 1H/30m/15m = Up → countertrend bounce that needs validation above 114.7k.
Risk On / Risk Off Indicator: VENTE — a risk-off tilt that contradicts LTF strength and urges caution below 114.7k.
__________________________________________________________________________________
Trading Playbook
__________________________________________________________________________________
Strategy: countertrend bounce into HTF supply; stay opportunistic but disciplined, favoring sell-the-rip until 114.7k is reclaimed.
Global bias: NEUTRE VENTE while below 114.7k; bias invalidated on a 4H close above 114.7k.
Opportunities:
- 📉 Fade: Short 113.6–114.7k on clean rejection; target 112.6k then 111.9k.
- 📈 Buy the dip: Long 112.6–111.9k on strong bullish rejections; target 113.6k then 114.7k.
- 🚀 Breakout: Long a 4H close > 114.7k with volume; target 116.0k then 117.5k.
Risk zones / invalidations:
- Clear acceptance > 114.7k invalidates shorts → squeeze risk toward 116.8–117.5k.
- Break below 110.9k invalidates dip-buys → opens 107–108.9k (on-chain).
Macro catalysts (Twitter, Perplexity, news):
- NVDA: post-earnings volatility may spill over to crypto risk appetite.
- Fed: high odds of a near-term cut → potential liquidity tailwind if confirmed.
- Trade: Mexico–China tariff tensions add macro uncertainty.
Action plan:
- Plan A (fade): Entry 113.6–114.7k / Stop 115.2k / TP1 112.6k, TP2 111.9k, TP3 110.9k → R/R ~1.5–2.5.
- Plan B (breakout): Entry 4H close > 114.7k (with volume) / Stop 114.0k / TP1 116.0k, TP2 117.5k, TP3 118.5k (if extension) → R/R ~1.8–2.2.
__________________________________________________________________________________
Multi-Timeframe Insights
__________________________________________________________________________________
Overall, mid-TFs are still capping the bounce while LTFs push into supply.
1D/1W: Higher-timeframe structure intact above 98–100k; holding 111.9k allows a retest of 114.7k, then 117.5k if breakout.
12H/6H/4H/2H: Active down sequence; 113.6–114.7k clusters supply. Without a close > 114.7k, expect mean reverts into 112.6–111.9k.
1H/30m/15m: Energetic rebound with strong volumes; as long as 112.6–111.9k holds, buyers can force a 114.7k test.
Major divergences/confluences: Strong confluence 111.9–114.7k; LTF volume spike not yet confirmed on HTF, pointing to range risk or rejection if 114.7k holds.
__________________________________________________________________________________
Macro & On-Chain Drivers
__________________________________________________________________________________
Macro is slightly risk-off, while crypto-specific flows show measured institutional demand and increasing stablecoin dry powder.
Macro events: NVDA-induced equity/AI volatility can sway crypto; high odds of a near-term Fed cut support liquidity; Mexico–China tariff friction adds uncertainty.
Bitcoin analysis: ETF net inflows (+$81.4M) indicate persistent institutional bid; 1B USDT mint and exchange rotations = fresh dry powder; mixed whale flows test supply but see absorption; hashrate near ATH and custody advances (Miniscript) strengthen structural footing.
On-chain data: 107–108.9k = key STH cost basis; 113.6k = 3-month cost (supply on bounces); SOPR near 1 → no capitulation, perps slightly bearish and fragile.
Expected impact: Risk-off backdrop (VENTE) caps breakouts; ETF/stablecoin liquidity can still power a squeeze if 114.7k breaks.
__________________________________________________________________________________
Key Takeaways
__________________________________________________________________________________
Technical rebound sits right below a major HTF wall.
- Overall trend: neutral-bearish while 114.7k holds; HTF uptrend intact in the background.
- Top setup: disciplined fade at 113.6–114.7k; switch to breakout-buy only on 4H close > 114.7k.
- Macro: a slight risk-off tilt (Risk On / Risk Off Indicator = VENTE) and NVDA-driven equity vol can dampen momentum.
Stay nimble: watch 114.7k for a squeeze trigger and defend 111.9k to keep the bounce alive. ⚠️
__________________________________________________________________________________
__________________________________________________________________________________

When Liquidity Sours but ETFs Shine: My BTC Cycle OutlookI’ve been digging into the current INDEX:BTCUSD Bitcoin cycle using my indicator, and it’s throwing up an interesting contradiction. If I focus only on the liquidity side – M2, the yield curve and high‑yield spreads – we look to be at the very start of a bear market for BTC and other high‑risk crypto assets. Those macro gauges are turning down, which would normally spell trouble.
Yet, when I look at actual capital flows, the picture is completely different. Spot ETF inflows remain very strong and show real institutional appetite. In fact, they’ve been robust enough to offset even the whale selling on‑chain. Because of that, my Crypto Flow indicator is still flashing “risk‑on” even though liquidity is tightening.
How do I square those two? My personal view is that we’re entering a stagflationary phase thanks to the Trump administration and a declining independence of the central bank and its increasing influence by the government. That means my model probably won’t look like the same as in past cycles in terms of timing and cycle length. I expect more back‑and‑forth: some days “more liquidity” will feel bullish, other days it will be seen as a policy mistake and turn bearish again. NASDAQ:NVDA Nvidia’s earnings will set part of the tone, but I also think inflation and asset inflation will be much higher than most expect. We’re in the fiscal stimulus endgame where assets may gain in nominal terms, but after adjusting for inflation there might not be much left for a simple buy‑and‑hold investor. In my mind, it’s shifting into a trader’s regime. And because many Americans have their retirement savings in the TVC:SPX S&P 500, I suspect Trump will support higher inflation while doing everything he can to prop up the stock market so ordinary citizens don’t feel poorer in real terms.
In my liquidity model, the Z‑score is in a declining zone but has recently started to show some strength again. The big question is whether ETF inflows celebrate this turnaround or dismiss it as a false signal. One thing feels clear to me: everyone is being pushed into owning assets like stocks and ETFs. The only debate is whether institutions will continue to load up on crypto ETFs or rotate into traditional value stocks. I’m curious to hear what others think about where we go from here.

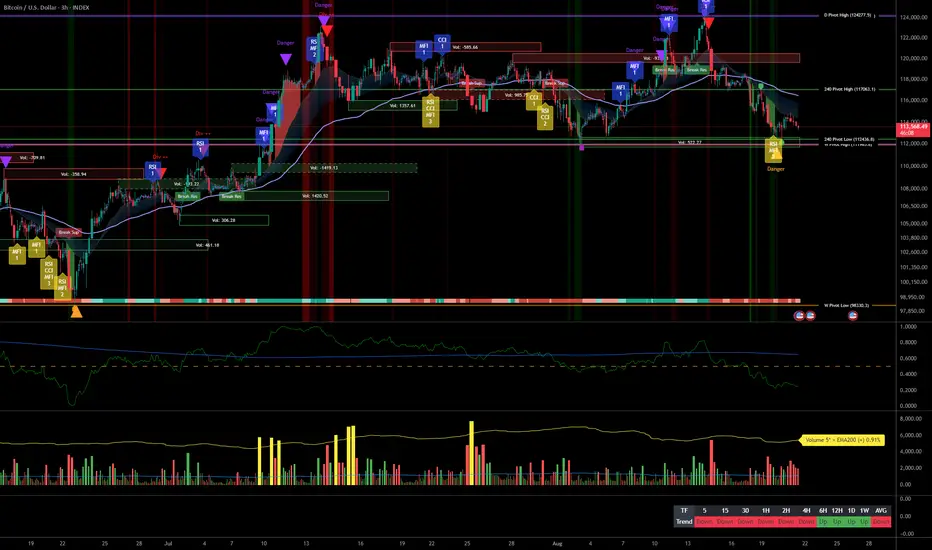
BTC 111,965 pivot battle: bearish bias until a clean reclaim!__________________________________________________________________________________
Market Overview
__________________________________________________________________________________
BTC is consolidating below a critical weekly pivot after rejections in the 116–124k area, with rallies sold. The 1D/12H structure remains broadly constructive, but intraday and weekly pressure is still bearish.
Momentum: Bearish 📉 below 111,965.5 (W Pivot High) — rebounds are faded until this pivot is reclaimed.
Key levels:
- Resistances (HTF): 111,965.5 (W), 116,400–116,900 (12H/6H supply), 117,495.9 (720 PH).
- Supports (HTF): 110,400–110,600 (intraday shelf), 108,757.9 (240 PL), 100,000–98,530.3 (W PL zone).
Volumes: Normal on HTF; moderate-to-normal on 6H/4H; very high 30m spikes on red bars (seller-driven).
Multi-timeframe signals: 1D/12H = Up, 1W + LTF (2H/1H/30m/15m) = Down → net “sell-on-rips” bias below 111,965.5; bullish flip only above toward 116.4–116.9k then 117,495.9.
Risk On / Risk Off Indicator: Neutral Sell — confirms a slight risk-off posture, aligned with the bearish momentum under the pivot.
__________________________________________________________________________________
Trading Playbook
__________________________________________________________________________________
Strategic stance: while below the weekly pivot 111,965.5, favor a cautious sell-on-rallies approach; only flip long on a clear, confirmed reclaim.
Global bias: Tactical bearish bias below 111,965.5; key invalidation on 4H/12H close > 111,965.5 (strong neutralization > 116.9k).
Opportunities:
- Fade 111.8–112.0k rallies toward 110.5k then 108.8k.
- Breakout buy only > 111,965.5 with a held pullback , aiming 116.4–116.9k then 117,495.9.
- Defensive dip buy at 108,757.9 with a tight stop.
Risk zones / invalidations:
- A break below 108,757.9 opens 100k–98,530.3 → invalidates dip-buys.
- A reclaim/close > 116.9k invalidates rebound shorts (squeeze risk).
Macro catalysts (Twitter, Perplexity, news):
- Political pressure on the Fed and independence debate → rate-path volatility, direct risk appetite impact.
- Trade/tariff tensions (record collections, 200% threats) + choppy oil → inflation uncertainty, jumpy curves.
- Hedge funds extremely short VIX → September vol spike risk across risk assets.
Action plan:
- Plan A (dominant, sell-on-rips): Entry 111.8–112.0k / Stop 112.3k / TP1 110.5k, TP2 108.8k, TP3 100k–98.53k / R/R ~1.5–3R.
- Plan B (bullish flip): Entry on held retest > 111,965.5 / Stop 111.6k / TP1 116.4k, TP2 116.9k, TP3 117,495.9 / R/R ~2–3R.
- Plan C (defensive dip-buy): Entry 108.8–108.76k / Stop < 108,757.9 / TP1 110.5k, TP2 111,965.5, TP3 116.4–116.9k / R/R ~1.5–2.5R.
__________________________________________________________________________________
Multi-Timeframe Insights
__________________________________________________________________________________
Top-down view: HTF (1D/12H) is still constructive, but LTF and 1W remain in control — the 111,965.5 pivot is the market’s hinge.
1D/12H: Under 111,965.5 cap; a clean close above unlocks 116.4–116.9k then 117,495.9.
6H/4H: Tech rebound from 108.8–109k; 4H shows ISPD = BUY (contrarian) — relief rally possible as long as 108,757.9 holds.
2H/1H/30m/15m: Descending structures; seller-led 30m volume spikes; dominant tactic = fade rallies below 111,965.5.
Key confluences/divergences: Singular hinge at 111,965.5 across TFs; 4H contrarian BUY vs LTF SELL → bounce risk, but not durable without a pivot reclaim.
__________________________________________________________________________________
Macro & On-Chain Drivers
__________________________________________________________________________________
Macro remains binary (rates/inflation/tariffs), feeding flow volatility that maps directly to BTC’s HTF levels.
Macro events:
- Political pressure on the Fed (talk of firing Lisa Cook) and “SBR” debate → USD/UST swings, less certain rate path.
- Record tariff collections, 200% threats, choppy oil → persistent inflation noise.
- HFs very short VIX → heightened September vol risk, fewer “clean” breaks.
Bitcoin analysis:
- Technical: ~111k; 113k highlighted as reclaim level; below the Kumo → failure risks drift, reclaim suggests range re-entry.
- Flows: +$88.1M net spot-ETF inflow (Aug 26) after heavy outflows → mixed, headline-sensitive.
- Institutions: selective buyers (e.g., Metaplanet); US debate on a Strategic Bitcoin Reserve → sentiment driven by headlines.
On-chain data:
- Derivatives-led, high OI with recent flush; notable USDC/USDT mints/transfers; exchange outflows → potential fuel, price must confirm.
Expected impact:
- This macro/on-chain mix supports a “Neutral Sell” bias while below 111,965.5; above it, room for a squeeze toward 116.4–116.9k.
__________________________________________________________________________________
Key Takeaways
__________________________________________________________________________________
BTC sits below a decisive weekly pivot with intraday selling pressure and only a tentative HTF bid.
- Overall trend: bearish/neutral while under 111,965.5; constructive again only after a confirmed reclaim.
- Most relevant setup: sell-on-rips 111.8–112.0k toward 110.5k/108.8k; flip long only after a 111,965.5 close + pullback.
- One key macro factor: Fed-policy uncertainty and tariffs keep volatility elevated and cap breakouts.
Stay disciplined: trade HTF levels, respect invalidations, and watch the volume spikes. ⚠️
__________________________________________________________________________________
__________________________________________________________________________________

Risk-Off in play: fragile bounce until 111k is reclaimed__________________________________________________________________________________
Market Overview
__________________________________________________________________________________
BTC remains in a controlled pullback after the 124,277 rejection, compressing above 109k and gravitating toward the 107,100 HTF pivot. Sellers keep the upper hand, but a technical bounce can emerge if key supports hold.
Momentum: Bearish 📉 with lower highs/lows; selling pressure dominates below 111k.
Key levels:
– Resistances (HTF/LTF): 110.6–111.0k • 111.9k (W) • 114–115k (D)
– Supports (HTF): 109.0–109.3k • 107,100 (240 PL) • 103,000 (former demand)
Volumes: Moderate on 2H–6H, Normal on 1D → no capitulation; likely low‑range chop/wicks.
Multi-timeframe signals: LTF (15m–2H) trending down; 4H/2H show local bullish divergence (ISPD = BUY) near 107.1k; overall trend bias still Down.
Risk On / Risk Off Indicator: SELL (sell bias) — confirms the bearish momentum; a move to NEUTRE ACHAT would better support a bounce.
__________________________________________________________________________________
Trading Playbook
__________________________________________________________________________________
Below 111k, sellers drive the tape; favor “sell the rip” while keeping a tactical long only on clean reactions at support.
Global bias: Mildly bearish below 111.0k; main invalidation on a 4H close > 111.0k.
Opportunities:
– Fade the 110.6–111.0k bounce with a tight stop; target 109.6k then 109.0k.
– Tactical long on a strong 107.1k reaction (wick rejection + 2H/4H reclaim > 110.6k), target 111.9k.
– Continuation short if 4H/D closes below 107.1k toward 103k.
Risk zones / invalidations:
– A firm break below 107.1k invalidates longs and opens 103k, then 96.3k.
– A confirmed reclaim above 111.9k invalidates most shorts and opens 114–115k.
Macro catalysts (Twitter, Perplexity, news):
– Powell signaling a possible September cut but data‑dependent → solid prints help reclaim 110.6k+.
– US data (Durable Goods, Consumer Confidence) → negative surprises raise odds of a 107.1k break.
– Trade tensions (tariffs/supply‑chain) → risk premium, can cap rebounds.
Action plan:
– Long Plan (tactical): Entry 109.2k and 107.3–107.1k / Stop < 106.8k / TP1 110.6k, TP2 111.9k, TP3 114–115k / R:R ~2.0–2.5R.
– Short Plan (fade or breakdown): Entry 110.6–111.0k OR after 4H close < 107.1k / Stop > 111.2k (fade) or >108.2k (break) / TP1 109.6k (fade) or 103k (break), TP2 109.0k or 99–98k / R:R ~1.8–2.5R.
__________________________________________________________________________________
Multi-Timeframe Insights
__________________________________________________________________________________
Most timeframes lean bearish, with 4H/2H contrarian hints at a major HTF support.
1D/12H/6H: Lower highs/lows under 111k; magnet toward 107.1k; 114–115k only after a firm reclaim > 111.0k.
4H/2H: Bullish divergence (ISPD = BUY) around 108.8–109.3k/107.1k; only buy if 110.6k is reclaimed, then 111.9k tests.
1H/30m/15m: Trend favors sell‑the‑rip; fade 110.4–111.0k; watch liquidity sweeps sub‑109k to 108.6k; need a volume regime shift to reverse.
__________________________________________________________________________________
Macro & On-Chain Drivers
__________________________________________________________________________________
Macro turns more easing‑friendly yet data‑dependent, while institutional BTC demand persists despite deleveraging.
Macro events: Powell hints at a possible September cut (data‑dependent); RBA minutes tilt dovish; trade tensions (tariffs/undersea supply) → tactically supportive for risk unless inflation/geopolitics flip risk‑off.
Bitcoin analysis: US spot ETF inflows (+$219M on Aug 25) signal resilient institutional demand; players like MicroStrategy near ~3% of supply → steady float absorption.
On-chain data: CEX reserves ~3.27M BTC with recent net outflows; ~1,703 BTC moved from Coinbase Institutional to custody → accumulation bias, but high derivatives OI = squeeze‑prone.
Expected impact: If easing narrative and inflows persist, reclaiming 110.6k/111.0k becomes more likely; risk‑off shocks raise the odds of a 107.1k break.
__________________________________________________________________________________
Key Takeaways
__________________________________________________________________________________
Market sits in controlled range‑down, anchored by a key HTF pivot.
– Trend: Bearish/cautious below 111k, bounce potential if 107.1k holds.
– Top setup: “Sell the rip” at 110.6–111.0k; “Buy the dip” only on a clean 107.1k reaction and reclaim > 110.6k.
– Macro: Easing bias (Fed/RBA) helps a reclaim, but US data and trade tensions can cap risk.
Stay disciplined: trade confirmations and respect invalidations.
Bitcoin Fade 118k, buy 114–111k dips__________________________________________________________________________________
Market Overview
__________________________________________________________________________________
BTC is consolidating below the yearly range high: higher-timeframe remains constructive while short-term momentum has turned lower. Sellers are active into 116.5–118k, with 111–114k catching dips.
Momentum: Bearish 📉 intraday with a supportive 1D/1W backdrop; “sell the rips” under 116.5–118k.
Key levels:
• Resistances (4H–1D): 116.5–118k (major pivot), 120–121k (intermediate supply), 124k (ATH area).
• Supports (2H–1D): 114–114.5k (range median), 111–111.7k (W Pivot High), 105–98k if 111k breaks.
Volumes: Normal to moderate; on 2H–4H, spikes mainly on sell pushes below 115k.
Multi-timeframe signals: 1D/1W = Up, 6H→15m = Down; 111–114k holds structure, 118k caps rebounds.
Risk On / Risk Off Indicator context: VENTE — contradicts bullish breakouts and favors selective range trading.
__________________________________________________________________________________
Trading Playbook
__________________________________________________________________________________
Game plan: trade the range defensively below 118k and be ready to flip long on a confirmed 4H/12H close above it.
Global bias: Neutral-bullish as long as 111k holds, tactically short below 118k; higher-timeframe invalidation if daily/12H closes below 111k.
Opportunities:
• Reactive long 114–111.5k on wick/volume confirmation, target 116k then 118k.
• Breakout buy on 4H/12H close > 118k, aiming 120k then 124k.
• Tactical fade short 116–118k on clean rejections; target 114k then 112k.
Risk zones / invalidations:
• A 12H close < 111k opens 105k then 98k (HTF bullish invalidation).
• A 4H/12H close > 118k invalidates shorts and flips the bias long.
Macro catalysts (Twitter, Perplexity, news):
• Powell signaled cuts “may be warranted” and the FAIT regime is being dropped → risk-on tailwind.
• Spot ETF flows turned positive again (ARKB, BITB), aligning with risk appetite → tactical support.
• Stablecoin inflows: >$500M USDC to Coinbase → potential spot fuel if 118k breaks.
Action plan:
• Range-long: Entry 114.5k→113k (ladder) / Stop daily < 111k / TP1 116k, TP2 118k, TP3 120k / R:R ≈ 2.0–2.5.
• Breakout-long: Entry on 4H/12H close > 118k / Stop ~116.5k / TP1 120k, TP2 124k, TP3 runner / R:R ≈ 1.8–2.2.
• Range-short: Entry 116–118k (rejection) / Stop 4H close > 118k / TP1 114k, TP2 112k, TP3 111k / R:R ≈ 1.5–2.0.
__________________________________________________________________________________
Multi-Timeframe Insights
__________________________________________________________________________________
HTF structure remains constructive while LTFs lean bearish under the 116.5–118k cap.
1W/1D: Bullish structure above 111k; a confirmed 4H/12H close above 118k unlocks 120k/124k.
12H/6H/4H/2H: Lower highs persisting; rebounds get faded under 116.5–118k, with 114k then 112k as magnets.
1H/30m/15m: Short-term down channel, micro-range 114.8–116.2k; prefer shorts under 116k, reactive longs only on clean 114k signals.
Divergences/confluences: Strong confluence at 118k (multi-TF resistance) and 111k (HTF pivot). This pair drives breakout vs. reversion scenarios.
__________________________________________________________________________________
Macro & On-Chain Drivers
__________________________________________________________________________________
Macro tilts mildly risk-on, but follow-through depends on holding closes above 118k and geopolitical calm.
Macro events:
• Post–Jackson Hole, Powell noted cuts may be warranted; US indices printed records, yields fell, USD slipped → risk-on support.
• Fed is dropping the implicit FAIT while keeping 2% long-term target → clearer policy path, lower regime uncertainty.
• Truflation near ~2.1% with slowing growth signs → higher cut odds, liquidity tailwind for risk assets.
Bitcoin analysis:
• BTC volatility: dip ~112k then bounce 115–117k; 118k remains the decision level.
• Spot ETFs: outflows flipped to inflows (ARKB, BITB) → increases odds of a clean breakout.
• Stablecoins: >$500M USDC to Coinbase = potential spot bid if 118k breaks; watch for deployment.
On-chain data:
• Elevated OI but recently cleaned up → leverage healthier yet sensitive.
• Slower net capital inflows late-cycle; ETH-derivatives dominance → potential volatility spillover to BTC.
Expected impact: Macro/on-chain slightly favor the top of the range; technically, bias flips only on a confirmed close > 118k, else range persists.
__________________________________________________________________________________
Key Takeaways
__________________________________________________________________________________
BTC holds a mature range between 111k and 118k with HTF tailwind but LTF headwinds.
- Trend: bullish on 1D/1W, bearish on LTF; 118k is the trigger for 120k/124k continuation.
- Best setup: buy 114–111.5k on clean reaction or follow the confirmed breakout > 118k; alternatively, fade 116–118k rejections.
- Macro: Powell’s easing tilt + ETF/stablecoin flows support upside if 118k gives way.
Stay nimble: trade the range until the break, and protect risk around key closes and macro headlines. ⚠️

BTC stuck 112k–115k: fade the bounce, watch Powell__________________________________________________________________________________
Market Overview
__________________________________________________________________________________
BTC is consolidating below stacked resistances (115k–117k) after failing under 124k. Price is retesting a liquidity pocket at 112k while HTF supports still hold — an orderly pullback.
Momentum: 📉 Bearish intraday within an overall bullish HTF trend — ongoing correction below 115k.
Key levels:
- Resistances (4H/6H/1D) : 114.6k–115.0k; 116.8k–117.0k; 119.9k–120.0k
- Supports (4H/1D/1W) : 112.0k–112.3k; 109.0k–109.5k; 98.5k–99.5k
Volumes: Overall normal; moderate on 4H — active pressure without extremes.
Multi-timeframe signals: Intradays (15m→6H) trending down; 12H/1D/1W still up; aggregate trend down → correction under 114.7k/115k, repeated defenses at 112k.
Risk On / Risk Off Indicator context: SELL (moderate risk-off) — confirms intraday weakness; caution while < 115k.
__________________________________________________________________________________
Trading Playbook
__________________________________________________________________________________
Strategic stance: primary trend still constructive, but intraday flow is selling — favor “sell the bounce” into 115k until that pivot is reclaimed.
Global bias: NEUTRAL SELL below 115k; invalidation if 4H close > 115k .
Opportunities:
- 🔻 Rejection short at 114.6k–115.0k → target 113.0k then 112.2k (invalid. > 115.6k).
- 🔼 Reaction long on a 111.8k–112.1k sweep with confirmation → target 113.5k then 114.7k (invalid. < 111.6k).
- 🔼 Break & hold > 115k (4H) → extension to 116.8k–117.0k then 120k (invalid. < 114.2k).
Risk zones / invalidations:
- A firm break < 112k (4H) unlocks 111.2k/109.3k;
- 1D close < 109.3k = risk of STRONG SELL toward 100k/98.5k.
Macro catalysts (Twitter, Perplexity, news):
- Powell at Jackson Hole today → could drive a 112k break or a squeeze > 115k.
- US margin debt at a record (~$1.02T) → fragility if volatility spikes.
- Inflation watch: rising oil and Japan CPI > 2% → temper near-term Fed easing hopes.
Action plan:
- Primary plan (rejection short) : Entry 114.6k–115.0k / Stop 115.6k / TP1 113.5k, TP2 112.5k, TP3 112.0k → R/R ~2–2.8 depending on fill.
__________________________________________________________________________________
Multi-Timeframe Insights
__________________________________________________________________________________
Intraday timeframes keep correcting inside the 112k–117k range, while HTFs remain intact above 109.3k–112k.
12H/1D/1W: Uptrend structure intact above 109.3k; 115k is the pivot — reclaim > 115k reopens 116.8k–117k then 120k amid “normal” volume (no capitulation).
6H/4H/2H/1H/30m/15m: Lower highs/lows; compression under 114.7k/115k; repeated defenses at 112k; a 30m bullish divergence (contrarian) could fuel a bounce to 113.1k–113.5k without changing trend yet.
Major divergences/confluences: Support confluence 111.8k–112.3k (seen across 6 TFs) vs priority sell zone 114.6k–115.0k — key axis for the next directional move.
__________________________________________________________________________________
Macro & On-Chain Drivers
__________________________________________________________________________________
Powell’s speech, elevated market leverage, and derivatives-led on-chain dynamics frame a cautious risk-off backdrop that can catalyze a range breakout.
Macro events: Powell today with a split Fed → likely cautious guidance; US margin debt at record (~$1.02T) → vulnerability if vol spikes; rising oil + Japan CPI > 2% → dampen near-term Fed easing.
Bitcoin analysis: Testing ~112k; many anticipate a sweep and quick buyback; weekly Kijun near ~99.4k echoes the 98.5k–100k HTF support; fresh USDT minted to Binance/Bitfinex suggests added liquidity/volatility.
On-chain data: Derivatives-led market (elevated OI then ~-$2.6B purge); slowing spot inflows despite recent ATH; no clear capitulation → downside more mechanical than spot-driven.
Expected impact: NEUTRAL SELL bias while < 115k; macro headlines may trigger either a false break below 112k or a squeeze above 115k — manage risk tightly around events.
__________________________________________________________________________________
Key Takeaways
__________________________________________________________________________________
Intraday correction below 115k, HTF structure still intact above 109.3k.
- Trend: 📉 Bearish intraday / 📈 Constructive on HTF.
- Key setup: Sell rejection at 114.6k–115k toward 112k, or tactical long on defended sweep of 112k.
- Macro: Powell + high leverage = elevated risk of directional spikes.
Stay disciplined: execute the plan, respect invalidations, and adapt quickly around headlines. ⚠️
__________________________________________________________________________________
__________________________________________________________________________________

BTC Between 112.6k and 117k: Trade the Pivot, Not the Ego__________________________________________________________________________________
Market Overview
__________________________________________________________________________________
BTC is consolidating below 117k after a clean rejection, pressing a major HTF support around 112.6k. The pullback is orderly, with intraday downside inside a still constructive 1D/1W trend. ⚖️
Momentum: 📉 Tactically bearish — intradays trend down while 1D/1W remains broadly bullish.
Key levels:
- Resistances (HTF/MTF): 115.5–116.5k (4H–12H supply), 117,063 (240 Pivot), 124,277 (D Pivot).
- Supports (HTF): 112,646 (240 Pivot), 111,959 (prior W High), 110–109k (lower liquidity zone).
Volumes: Overall normal; moderate on 4H/15m → no climax, orderly pressure.
Multi-timeframe signals: 15m→12H trending down; 1D/1W still up. Holding 112.6k keeps daily structure constructive; a decisive close below opens 111.96k then 110–109k.
Risk On / Risk Off Indicator: VENTE (risk-off) — aligns with momentum and caps rebounds while below 117,063.
__________________________________________________________________________________
Trading Playbook
__________________________________________________________________________________
Stay defensive: prioritize fade-the-bounce below 117k, while watching for a clean bullish reaction at 112.6k for tactical longs. 🧭
Global bias: Overall NEUTRE VENTE below 117,063; primary invalidation on 4H/12H close > 117,063.
Opportunities:
- Rebound short: sell 114.5–116.0k toward 113.2k then 112.7k (while < 117,063).
- Tactical long: buy a wick + reclaim at 112.8–112.6k toward 114.8k then 117.1k.
- Bullish breakout: add only on confirmed reclaim > 117,063 toward 120–124k.
Risk zones / invalidations:
- Breakdown: a 2H/4H close < 112,646 invalidates tactical longs and exposes 111,959 then 110–109k.
- Reclaim: a 12H close > 117,063 invalidates rebound shorts.
Macro catalysts (Twitter, Perplexity, news):
- Jackson Hole: potential hawkish tone post-FOMC minutes (inflation-focused) → headwind for risk.
- Energy: oil rebound on US draws → short-term inflation pressure, supports risk-off.
- Geopolitics: Middle East/Ukraine tensions → headline risk and volatility.
Action plan:
- Preferred setup (reactive long at HTF support):
- Entry: 112.8–112.6k after wick and 1H reclaim
- Stop: < 111,959 (1H/2H close)
- TP1: 114.8k; TP2: 117,063; TP3: 120k
- R/R: ~2.0–2.8 depending on execution
__________________________________________________________________________________
Multi-Timeframe Insights
__________________________________________________________________________________
Overall, intradays push lower into an HTF support that higher timeframes still defend.
1W/1D: Higher-timeframe structure intact while 112.6k holds; potential rebounds toward 117.1k if a clean pivot reaction prints.
12H/6H/4H/2H: Bearish bias with lower highs/lows; 114.5–116.5k remains a sell zone; watch for acceleration if 112.6k breaks.
1H/30m/15m: Bearish drift, micro-range 113.2–114.6k; mean-reversion possible but sellers in control without volume extremes.
Key signal: 112,646/111,959 support confluence vs. Risk On / Risk Off Indicator in VENTE → decisive range battle; the break will define the next leg.
__________________________________________________________________________________
Macro & On-Chain Drivers
__________________________________________________________________________________
Macro risk-off (Fed/energy/geopolitics) weighs on sentiment while on-chain signals show timid demand near highs.
Macro events: Markets focus on Powell at Jackson Hole after inflation-leaning minutes; oil rebound adds to inflation angle; geopolitics raises risk premium.
Bitcoin analysis: Price ~113–114k; Monthly bullish, Weekly neutral, Daily bearish; US spot ETF outflows vs. HK listings — mixed institutional signals consistent with consolidation below 117k.
On-chain data: 1Y MVRV Z-Score slightly < 0; subdued activity/fees near ATHs → modest spot demand, market catalyst-sensitive.
Expected impact: Macro/on-chain backdrop supports an NEUTRE VENTE bias while 112.6k is pressured and no pro-risk catalyst emerges.
__________________________________________________________________________________
Key Takeaways
__________________________________________________________________________________
Market is testing a key HTF support with intradays bearish but no capitulation.
- Overall trend: tactically bearish, higher-timeframe bullish if 112.6k holds.
- Most relevant setup: reactive long at 112.8–112.6k with tight stop; otherwise fade 114.5–116k.
- Key macro factor: Jackson Hole tone that could trigger range resolution.
Stay disciplined: wait for confirmation at the pivot — the break will decide. 🔎
__________________________________________________________________________________
__________________________________________________________________________________
Bitcoin Critical Test Strong SELL Setup & Support at 112k__________________________________________________________________________________ Market Overview
__________________________________________________________________________________
BTCUSDT is entering a critical transition phase, with bears firmly in control and persistent compression around major weekly supports.
Momentum : Clear bearish trend 📉 as selling flows dominate and every rally gets rejected under resistance; no major signs of trend reversal at this stage.
Key levels :
Resistances ( HTF & MTF grouped ):
- Zone 121,500 – 124,700 $ ( D/240/HTF )
- 116,800 – 118,000 $ block ( 240/4H/1H )
- 114,600 $ intraday pivot
Supports :
- Critical pivot zone 111,980 – 113,000 $ ( W/HTF )
- Lower cluster 109,000 – 110,000 $
Volumes : Volume remains normal on high timeframes but defensive spikes are seen on 30min/15min, highlighting a lack of bullish capitulation and no sustained buying flows.
Multi-timeframe signals : All major timeframes (D, 12H, 6H, 4H) show pronounced bearish bias; a few brief bottoming attempts on 1H/4H lack structural strength. No compelling bull signals across the board.
Risk On / Risk Off Indicator context : “Strong sell” Risk On / Risk Off Indicator bias is confirmed across all timeframes, directly supporting the bearish momentum; no current macro/technical element challenges this view.
__________________________________________________________________________________
Trading Playbook
__________________________________________________________________________________
With a dominant bearish environment, strategy remains defensive—ready to sell failed bullish recoveries.
Global bias : Strong SELL as long as the chart remains under 116,800 $; any clean break below 111,980 $ invalidates the short-term reversal scenario.
Opportunities :
- Sell into failed rallies under 114,600 – 116,800 $ (tight stop recommended)
- Tactical scalps on weak intraday bounces towards 114,600 $
Risk zones / invalidations :
- Bear extension likely if 111,980 $ zone breaks cleanly—targets 110,000 $
- Sustained move above 116,800 $/118,000 $ = short squeeze threat; instant stop required
Macro catalysts (Twitter, Perplexity, news) :
- UK inflation re-acceleration sustains central bank uncertainty and a risk-off tone.
- Broader sell-off in Tech/Equities weighs on crypto beta, amplifying the defensive backdrop.
- Tether's latest stablecoin growth reflects dry powder, but structural demand hasn't returned yet.
Action plan :
- Entry: Short setups preferred below 116,800 $; confirm on failed test at 114,600 $
- Stop: >118,000 $
- TP1: 112,000 $ ; TP2: 110,000 $ ; TP3: 109,000 $
- R/R estimate: 2.5–3 depending on entry; tactical adjustments during FOMC minutes or major Powell speeches.
__________________________________________________________________________________
Multi-Timeframe Insights
__________________________________________________________________________________
All timeframes display a strong alignment to the downside, with only minor short-term volume divergences.
1D/12H/6H/4H : Price stays pressured below 116,800 $/118,000 $ with repeated rejections; support cluster 111,980–113,000 $ is key. No reversal patterns identified.
1H/30min/15min : Short-term volume spikes during defensive rebounds. Buyers quickly absorbed; attempted recoveries sold. 113,000 $ area offers tactical scalping but overall macro trend remains short-biased.
Major confluences : All timeframes focus on the same weekly support and highlight repeated failures under identical resistance blocks, reinforcing the SELL scenario until further notice.
__________________________________________________________________________________
Macro & On-Chain Drivers
__________________________________________________________________________________
Macro and on-chain drivers reinforce the technical bearish stance.
Macro events : UK inflation uptick revives global rate caution, Tech/Equities correction intensifies the risk-off mood, and all eyes are on FOMC minutes/Powell for major volatility; no bullish catalyst is evident.
Bitcoin analysis : Institutional flows are drying up, structural support lost with an “air gap” visible on-chain down to 110,000 $. Opportunistic accumulation between 112–114k $ remains insufficient as profitability drops.
On-chain data : Weak demand, defensive buying at local supports (113,000 $), negative ETF flows; intermediate capitulation phase is in progress, with further selling risk if 110–112k $ breaks.
Expected impact : The combination locks in a dominant SELL bias, confirmed by technical readings; all rallies are tactical and made to be faded.
__________________________________________________________________________________
Key Takeaways
__________________________________________________________________________________
BTCUSDT is locked in a bearish trend, defined by risk-off sentiment across both technical and macro/chain contexts.
In summary: trend remains bearish, the clearest setup is a strictly-managed short around key resistance, with invalidation above 116,800 $. Macro drivers, including global risk aversion and waning structural demand, weigh heavily—no bull catalyst has emerged.
Stay disciplined, monitor reactions at weekly support, and manage risk dynamically as new macro events unfold.
__________________________________________________________________________________

Tactical BTC Consolidation—Major Support Under Threat__________________________________________________________________________________
🇬🇧 Market Overview
__________________________________________________________________________________
BTCUSDT is consolidating in a tight range just below recent highs, as directionless momentum and cautious sentiment dominate.
🏁 Momentum : Weak bearish bias 📉, with little directional conviction—short/MF timeframes remain in soft seller control.
🔎 Key levels :
Resistances (1D/4H): 122,300–124,400 / 119,800–119,900 (upper range)
Supports (1D/4H): 114,640–114,800 (crucial pivot zone) / 111,900 (historic floor)
📊 Volumes : Normal to moderate levels, no extreme activity outside minor spikes on 6H/30min.
⏱️ Multi-timeframe signals : Higher timeframes (1D/12H/6H/4H) structurally remain up, but momentum is exhausted; 2H and lower show persistent selling, as key 114,640–114,800 support is repeatedly tested across TFs.
🛡️ Risk On / Risk Off Indicator : Neutral sell bias —confirms a lack of buying pressure and calls for tactical caution.
__________________________________________________________________________________
Trading Playbook
__________________________________________________________________________________
In this bearish range setup, prefer a defensive and adaptive approach.
🌐 Global bias : Overall neutral sell bias unless 114,640 is broken—dropping below invalidates any hope for a rebound.
💡 Opportunities :
Buy only on confirmed reversal above 114,800 with a tight stop.
Tactical short/sell on rejection below 119,800, targeting the range base.
Wait for a breakout above 119,900 (with volume + risk-on confirmation) before chasing upside.
⚠️ Risk zones / invalidations :
Firm break below 114,640 = potential flush to 111,900.
Loss of momentum on MTFTI lower TFs (2H/15min) = avoid aggressive long anticipations.
🌍 Macro catalysts :
Jackson Hole anticipation heightens volatility and market nerves.
Strong institutional presence (MicroStrategy/Google/Canada) backs mid-term demand.
No on-chain capitulation = technical floor is safe for now, but no bullish impulse yet.
📝 Action plan :
Entry: on confirmed rejection or rebound (114,800 or 119,900 depending on signal direction).
Stop: just under 114,640 for longs, above 119,900 for shorts.
TP1: 117,200 – TP2: 119,800 – TP3: 122,000 (R/R ~2–2.5).
__________________________________________________________________________________
Multi-Timeframe Insights
__________________________________________________________________________________
All timeframes focus on the tight 114,640–119,900 range, with each downside extension challenging the pivot.
1D/12H/6H/4H: Underlying uptrend stalled, price stuck at key support without reclaiming main resistances—momentum is drained.
2H/1H/30min/15min: “Bear control” showing, with supports cracking or close to breaking, and intermittent buying volume. A break below 114,640 could trigger sharp downside volatility.
Summary: Major divergence between stalled high TFs and persistent short-term selling explains the battle for trend; sustainable recovery requires aligned bullish signals across multiple horizons.
__________________________________________________________________________________
Macro & On-Chain Drivers
__________________________________________________________________________________
Macro and on-chain context suggest a wait-and-see climate, with no imminent capitulation but increased caution.
🌐 Global traders await Jackson Hole, preserving volatility and a defensive posture amid ongoing geopolitical tension (Middle East). Capital flows remain cautious.
💸 Strong institutional involvement (MicroStrategy, Google, Canadian funds) reinforces Bitcoin’s structural support.
🔗 On-chain, most holders are in profit, altcoin OI is at record levels, and implied volatility remains low—a mix that could spark future volatility, but panic is absent.
✨ These macro/on-chain drivers reinforce the current sideways range and argue for a very defensive technical stance until a clear catalyst emerges.
__________________________________________________________________________________
Key Takeaways
__________________________________________________________________________________
BTCUSDT is stuck in a compressed range with no clear directional trigger.
Trend: Neutral seller bias overall, intraday bearish, key 114,640–114,800 support under heavy pressure.
Best approach: wait for a clean defensive reversal at support, with strict stop management—no aggressive swings unless 119,800 is reclaimed.
Jackson Hole remains the main macro catalyst; any surprise flow or event could quickly break the current stalemate.
Stay nimble, watch 114,640–114,800 closely, and adapt rapidly to any macro or volume triggers! 📊
__________________________________________________________________________________
__________________________________________________________________________________

Bitcoin: High-Stakes Consolidation Before Jackson Hole
__________________________________________________________________________________
Market Overview
__________________________________________________________________________________
Bitcoin remains in a consolidation phase just below key resistance, with bullish momentum fading after several failed attempts to break higher.
Momentum: The overall trend is neutral to bearish 📉, as waning demand under resistance points to a lack of strength for a renewed uptrend.
Key levels:
Resistances (1D/12H): 118,575 – 122,218, 124,474
Supports (1D, 12H, 4H): 115,000 – 114,000 (immediate pivot zone), 111,900 (major weekly), 98,200 (extreme support).
Volumes: Volumes are mostly normal to moderate; however, a recent volume spike on the 15min signals a potential speculative bottoming attempt.
Multi-timeframe signals: Higher timeframes (1D–6H) show “Neutral Sell” to neutral, while intraday (4H–15min) turns clearly bearish, with some short-term reversal signals (divergences, extreme volume).
Risk On / Risk Off Indicator context: The Risk On / Risk Off Indicator is in “neutral sell” mode — matching the directionless momentum, with no strong recovery signal observed yet.
__________________________________________________________________________________
Trading Playbook
__________________________________________________________________________________
The dominant trend remains neutral to slightly bearish, prompting a defensive stance and readiness for scalping opportunities.
Global bias: Primary bias is neutral to bearish below $119,500 — a sustained breakout above this level is needed to flip the trend bullish.
Opportunities:
– Aggressive scalp buys between $114,000 and $115,000 if reversal signals (ISPD DIV BUY + extreme volume) are confirmed; targets: $116,800, then $118,575.
– Swing long only on weekly recovery above $119,500 with clear confirmation; otherwise stay defensive.
Risk zones / invalidations:
– A break below $111,900 invalidates any bullish scenario, exposing deeper correction risks toward $98,200.
– Sustained loss of $114,000 without absorption = risk of sharp downside.
Macro catalysts (Twitter, Perplexity, news):
– Awaiting Powell’s Jackson Hole speech; implied volatility near lows could set up for abrupt expansion post-OPEX.
– Geopolitics are relatively calm; gold and JPY serve as global risk indicators.
– FX and index signals align with a cautious, unchanged environment.
Action plan:
Entry: buy scalp $114,000–$115,000 upon confirmation, stop below $113,800, TP1: $116,800, TP2: $118,575, TP3: $122,200; R/R approx. 2–2.5 depending on support response.
__________________________________________________________________________________
Multi-Timeframe Insights
__________________________________________________________________________________
Higher timeframes (1D–6H) remain in tight consolidation below top-of-range resistance, with intradays (4H–15min) showing pronounced bearishness and speculative reversal signals on lows.
1D–6H: Price is capped under $122,200; key supports lie just below ($115,000–$111,900). Structure remains a tight range — decision zone very close.
4H–1H: Signs of distribution, persistent lower highs, repeated testing of the $115,000/$114,000 support zone. No evidence of lasting bullish reversal; watch for potential flush.
30min–15min: Overall "SELL", but bullish ISPD DIV divergences and very high volume suggest a speculative bounce if support holds. Such divergences are often markers for potential intraday trend shifts and warrant close monitoring.
__________________________________________________________________________________
Macro & On-Chain Drivers
__________________________________________________________________________________
Macro remains cautious, while on-chain metrics illustrate both underlying robustness and short-term fragility for BTC.
Macro events: Markets are on hold ahead of Jackson Hole; implied vol at/near all-time lows, dealer gamma high — any surprise catalyst could trigger significant volatility. A weak yen and Nikkei at all-time highs reflect shifting global risk preferences.
Bitcoin analysis: After the recent sell-off, BTC is defending the 114–115k zone. Whales and institutions are accumulating, but institutional flows as a whole remain light; risk of liquidations persists if a further correction unfolds.
On-chain data: BTC’s on-chain momentum is constructive, with little capitulation, but very low implied volatility flags a heightened risk of fast, outsized moves. Lever buildup in altcoins increases systemic fragility.
Expected impact: This context suggests a latent market, with substantial swing potential on the next external shock, confirming a cautious and tactical technical stance — active risk management around current supports is key.
__________________________________________________________________________________
Key Takeaways
__________________________________________________________________________________
BTC is trading in a high-range consolidation under resistance, with fading momentum and no macro catalyst in sight.
Overall trend is neutral to bearish across most timeframes, yet speculative rebound (scalp buy) signals are emerging on the shortest horizons (15–30min). The best setup is an aggressive scalp buy zone between $114,000 and $115,000 for nimble traders. On the macro side, any Jackson Hole-driven volatility could quickly tilt the balance.
Stay disciplined: a decisive loss of current supports could trigger sharp downside — active risk management is a must.
__________________________________________________________________________________

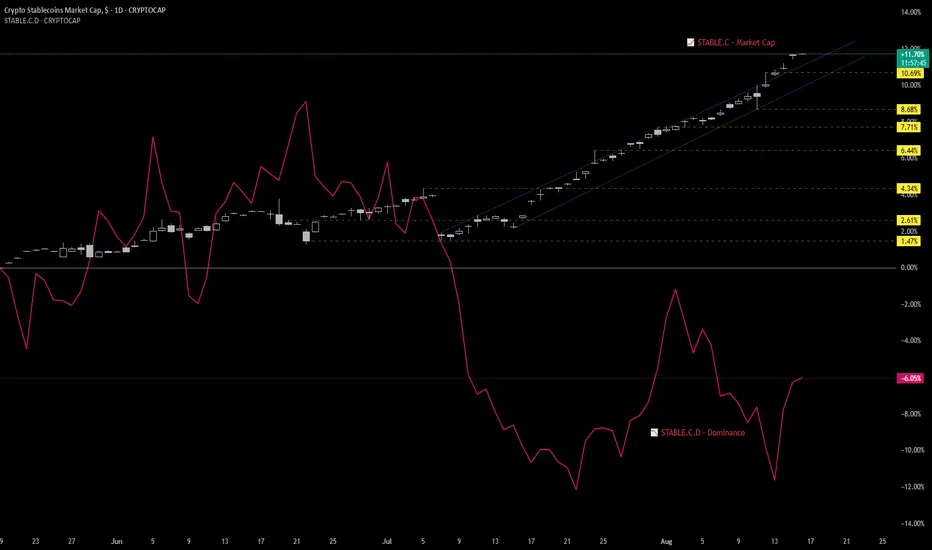
Stablecoins as the New Macro Liquidity ProxyFor years, macro liquidity in crypto was gauged through broad monetary metrics like M2 or Total Market Cap. But those days are fading.
With the rise of regulated stablecoins—and new TradingView tickers like CRYPTOCAP:STABLE.C (Stablecoin Market Cap) and CRYPTOCAP:STABLE.C.D (Stablecoin Dominance)—we now have real-time, on-chain liquidity metrics that better reflect how institutional and retail capital enters the crypto ecosystem.
🔑 Why These Tickers Matter
• STABLE.C = Capital injection.
→ Tracks aggregate growth of major stablecoins, serving as a proxy for dry powder entering the system.
• STABLE.C.D = Sentiment signal.
→ Measures stablecoin dominance relative to the crypto market.
→ Rising dominance = risk-off (capital parked).
→ Falling dominance = risk-on (capital deploying).
Together, they offer a macro lens on risk appetite and capital inflow , updated in real-time—something no traditional metric can match.
🔍 How We Use Them
These metrics are now integrated into our Crypto Macro Cockpit , where:
• Stablecoin cap growth signals liquidity expansion or contraction
• Dominance slope helps identify regime shifts (risk-on vs risk-off)
We're beginning to see consistent patterns:
➤ Surges in STABLE.C precede market rallies
➤ Spikes in STABLE.C.D often align with rotation tops or periods of caution
📎 Implication
Stablecoins are no longer just trading tools—they’re macro indicators.
If ETFs are the Trojan horse for institutional entry, stablecoins are the bloodstream.
As we transition into a new cycle, these tickers might become the most important charts you’re not watching.
💬 Would love to hear from others—are you using STABLE.C or STABLE.C.D in your analysis? What signals are you seeing?
Bitcoin’s tipping point zone: Key macro catalysts in play__________________________________________________________________________________
Market Overview
__________________________________________________________________________________
Bitcoin is currently consolidating below major cycle highs, with upward momentum losing steam as sellers defend critical resistance. Failed breakout attempts and increasing volatility near key support hint at growing uncertainty.
Momentum : The underlying trend remains bullish 📈, but short-term momentum is fading; daily remains up, but lower timeframes are softening.
Key levels :
Resistances (D/12H/6H): 120,000–124,000 (zone) — main overhead barrier.
Supports (D/12H/6H): 116,926 (multi-TF pivot), then 111,119–112,000 (major safety zone).
Volumes : Daily volumes are normal, but 2H is flagging extreme moves — any break under 116,926 could unleash big moves.
Multi-timeframe signals : The uptrend persists from 1D to 4H, but there's a clear bearish transition in 2H and below. Structure stays bullish as long as 116,926 holds, with risk mounting on further retests.
Risk On / Risk Off Indicator context : The “Risk On / Risk Off Indicator” is in "neutral sell" mode, showing a slight relative deterioration versus US tech stocks — confirming the slowdown in momentum, though no total reversal yet.
__________________________________________________________________________________
Trading Playbook
__________________________________________________________________________________
With price compressed under major resistance, the strategy remains one of tactical caution and reactive setups.
Global bias : Cautiously bullish bias, maintained as long as 116,926 holds — this is the key invalidation threshold.
Opportunities :
→ Short-term long scalp possible if a seller exhaustion (ISPD DIV BUY on 15min) forms near 116,926/116,000, tight stop required.
→ Swing long only if price reclaims and confirms above 119,119–120,000 zone.
Risk zones / invalidations :
→ Clear break and close under 116,926 on H1/2H = bullish invalidation, next target 111,119.
→ Failure/rejection at 123,164–124,000 = exhaustion, beware false breakouts.
Macro catalysts :
→ Powell’s Jackson Hole speech (Aug 22), key for market direction.
→ Massive BTC options expiration (~39K BTC, max pain near 118K), watch for post-expiry volatility.
→ Institutional inflows strong, but “pin risk” around options expiry could limit upside.
Action plan :
Entry: Wait for confirmed rebound on 116,926 (scalp or swing depending).
Stop: Below 116,000 (short-term) / Below 111,119 (swing).
TP1: 119,119 | TP2: 120,000 | TP3: 123,164–124,000 (if breakout).
R/R: Attractive (>2 if setup respected, <1 if chasing or volume extreme).
__________________________________________________________________________________
Multi-Timeframe Insights
__________________________________________________________________________________
Across timeframes, the key story is compression under major resistance, a pivotal multi-TF support at 116,926, and mounting nervousness in the lower frames.
Daily/12H/6H : Upward structure intact, but waning momentum under 120,000–124,000 signals possible transition to consolidation/correction if 116,926 is lost.
4H/2H/1H : Descending wick sequences, repeated support tests, rising volume, and a bearish momentum transition (MTFTI turning down in 1H/2H).
30min/15min : Aggressive selling pressure, local capitulation, and a bullish divergence on 15min (ISPD DIV BUY) suggest a potential but fragile rebound.
116,926 remains a true battleground: a breakdown here aligns bearish signals across TFs, while a solid rebound could quickly reclaim 119,119–120,000.
__________________________________________________________________________________
Macro & On-Chain Drivers
__________________________________________________________________________________
Macro and on-chain dynamics are in focus, with the Fed’s Jackson Hole stance, ongoing geopolitical caution, and high-risk BTC options expiration all in play.
Macro events : US retail sales beat, revisions up, and a widening 30Y–5Y yield spread keep risk premiums afloat. Geopolitical events remain tense but have yet to disrupt the main trend.
Bitcoin analysis : Options expiry (~39K BTC, max pain ~118K) could drive “pin” or sharp volatility. Institutional flows (Brevan Howard, IBIT) remain strong, but options-driven price action may cap upside for now. Defending the 116–117K support band is critical.
On-chain data : 95% of holders in profit, no mass capitulation; implied volatility is near record lows — primed for a “big move” if a macro trigger appears.
Expected impact : Macro and risk-on/off positioning keep technicals cautious — major support loss could spark a drop, but institutional reaction to Fed/policy signals could flip the bias quickly.
__________________________________________________________________________________
Key Takeaways
__________________________________________________________________________________
The overall bias remains structurally bullish, but short-term uncertainty prevails below 124K ahead of a critical macro/events window.
The market sits in a long-term uptrend but is showing short-term technical fragility around support. The primary actionable setup is a tactical rebound near 116,926 if seller exhaustion is confirmed (15min divergence), while valid swing entries require a solid reclaim of 119,119–120,000. Macro catalysts (Fed/Jackson Hole, options expiry) are decisive for the next major move.
Bitcoin Macro Tailwind Meets Short-Term Volatility Battle__________________________________________________________________________________
Market Overview
__________________________________________________________________________________
Bitcoin’s momentum remains bullish on higher timeframes, but the price action is currently stalling below a critical resistance cluster, fueling volatility and intraday shakeouts.
Momentum 📈: The prevailing swing structure remains bullish, driven by robust mid/long-term trends; however, there is clear momentum fatigue with shallow corrections appearing on lower timeframes.
Key levels:
• Major resistances : 122,450–123,300 (primary pivot battle zone across daily/4H/12H), 119,812 (intermediate historic resistance now contested)
• Main supports : 119,812–118,050 (multi-TF pivotal demand zone), 114,967 (1D/4H pivot, also Weekly support)
• These zones are critical: breaking above 123,300 could spark a fast move toward 127k, while holding above 119,800/118,000 keeps the bullish structure intact.
Volumes: Normal to moderate on primary timeframes, but very high short-term spikes on 15min underline active volatility traps.
Multi-timeframe signals: Medium/long-term TFs (1D, 12H, 6H, 4H, 2H, 1H—all Up) confirm the bullish bias; however, the Risk On / Risk Off Indicator shifts to SELL on the 30min/15min, reinforcing near-term caution.
Risk On / Risk Off Indicator context: “Neutral sell” on the broader trend, flipping to SELL at short-term extremes—underscoring the need to defend positions as volatility rises into resistance.
__________________________________________________________________________________
Trading Playbook
__________________________________________________________________________________
The strategic backdrop favors bullish setups as long as price action holds major support, but discipline and swift reaction are needed while Bitcoin hovers under vital resistance.
Global bias: “Neutral buy” as long as 119,812/118,000 holds; any solid break below 118,000 flips the swing outlook neutral or bearish.
Opportunities:
• Tactical buy on structured pullback into 119,812/118,050 – key swing entry zone.
• Conditional breakout trade above 123,300 – sets up an extension toward 127k, especially if shorts get squeezed.
• Defensive scalp only on volatility flushes and rapid reclaim above 120,156/119,812.
Risk zones / invalidations:
• Confirmed breakdown below 119,812 is the first warning sign—opens risk of a retest of 118,000 or deeper.
• Sustained loss of 118,000 = neutrality/bearishness resumes, opportunity for strategic selling may appear.
Macro catalysts (Twitter, Perplexity, news):
• Accelerating global liquidity (US M2 surge, China credit) underpins the risk asset backdrop.
• Geopolitical easing (Ukraine truce, G7 signals) reduces systemic threats; tailwinds for risk markets.
• Looming short squeeze ($6B in shorts at 125k) could fuel explosive breakout moves if resistance breaks.
Action plan:
• Entry : Staggered buying into 119,812/118,050 or confirmed breakout above 123,300.
• Stop : Below 118,000 (key swing stop).
• TP1 : 122,450, TP2 : 123,300, TP3 : 127,000 short squeeze extension.
• R/R: Moderate to high; optimal if entered near support or confirmed clean break.
__________________________________________________________________________________
Multi-Timeframe Insights
__________________________________________________________________________________
Multi-timeframe analysis shows strong trend alignment on higher frames, contrasted by rising volatility and trap risk on the intraday scale.
1D/12H/6H/4H: Bullish structure and trend intact, with broad support at 119,812/118,050; strong resistance cluster at 122,450/123,300 preventing further upside for now. Each dip to support has triggered buyer defense and recovery.
2H/1H: Sideways consolidation at the upper range, above key supports. Corrections remain shallow unless 119,800/118,000 break.
30min/15min: Clear divergences—momentum shifts bearish, volume spikes, trap risk is high. These signals warn against chasing breakouts prematurely and demand patience.
The underlying theme: The pivotal zone between 118,000 (support) and 123,300 (resistance) is where momentum for the coming days will be defined—traders must monitor reaction closely rather than anticipate.
__________________________________________________________________________________
Macro & On-Chain Drivers
__________________________________________________________________________________
Macro and on-chain trends offer fundamentally bullish support for Bitcoin, although short-term volatility and positioning require active risk management.
Macro events:
• Global liquidity is on the rise (US M2, China credit), supporting higher valuations for risk assets.
• Market expectation for US Fed rate cuts, bullish macro calendar, and reduced credit spreads—all positive for risk-on sentiment.
• Easing geopolitics (Ukraine diplomacy, G7 moves) lowers the threat of sudden shocks, adding stability.
Bitcoin analysis:
• Strong institutional inflows and treasury allocations, growing support from large funds.
• Key short squeeze level at 125k—liquidation of $6B in shorts could drive a rapid extension if resistance is breached.
• Bitcoin dominance dropping below 60% hints at capital rotation into alts but can also revert quickly if the market overheats.
• Institutional custody solutions and secure insurance ramping up, supporting greater adoption.
On-chain data:
• Profitability among holders is very strong; minimal signs of forced selling or capitulation.
• No major signs of excessive euphoria; volatility implied to be low—a classic contrarian prelude to a volatility spike.
Expected impact: These drivers underpin the swing-long bias but demand precise execution and tactical caution around major resistance traps and volatility spikes.
__________________________________________________________________________________
Key Takeaways
__________________________________________________________________________________
Bitcoin remains in a mature uptrend but is stalling beneath heavy resistance, requiring patience and disciplined execution.
The global trend is bullish as long as 119,800/118,000 zone holds—these are structurally critical. The most relevant setup is a conditional breakout play above 123,300, targeting 127k if momentum and shorts align, but caution is needed due to heightened short-term trap risks. Macro tailwinds (liquidity surge, geopolitics improving) give deeper support but don’t remove the need for vigilance as intraday volatility remains acute.
Stay nimble: avoid chasing into resistance, wait for signals of real flow, and prepare for fast reversals near the key battle zones.

Crypto Macro Cockpit: Risk-ON Regime ConfirmedThis chart presents a live macro overlay for crypto markets using the new Crypto Macro Cockpit, a Pine Script-based dashboard that blends traditional flow metrics with institutional-era proxies.
We're currently reading a Risk-ON regime as fresh liquidity deploys into the system—confirmed across stablecoin metrics and sector rotation.
🔍 Key Insights
Risk Flow: Stablecoin cap is rising slower than total market cap → suggests active deployment (Risk-ON)
Liquidity Context: StableCap ROC at +7%, confirming real dry powder growth
Rotation: ETH vs BTC and ETHBTC both accelerating upward → ETH/Alts tilt
TOTAL3ES/ETH ratio: Softening short-term → confirms engineered altseason with ETH as the core liquidity channel
Macro Regime: Risk-ON (new liquidity deploying)
🧠 Thesis
This aligns with the Trojan Cycle thesis:
Institutional liquidity enters through safe, regulated channels (e.g. stablecoins), while synthetic altseasons are engineered to engage and extract liquidity from retail participants.
Legacy macro tools like M2 are no longer as effective. In today’s structure, stablecoin metrics offer real-time, blockchain-native liquidity signals.
- Stablecoin Market Cap reflects actual capital inflow (dry powder entering)
- Stablecoin Dominance proxies sentiment: declining = risk-on, rising = risk-off
- Their spread vs Total Market Cap reveals whether capital is being deployed or parked
As institutions and ETFs reshape market dynamics, this cockpit adapts.
M2 is out. Stablecoins are in.
⚠️ Disclaimer
This is not financial advice.
This script and dashboard are informational tools meant to support macro-level context and regime awareness—not trade signals.
Always do your own research.
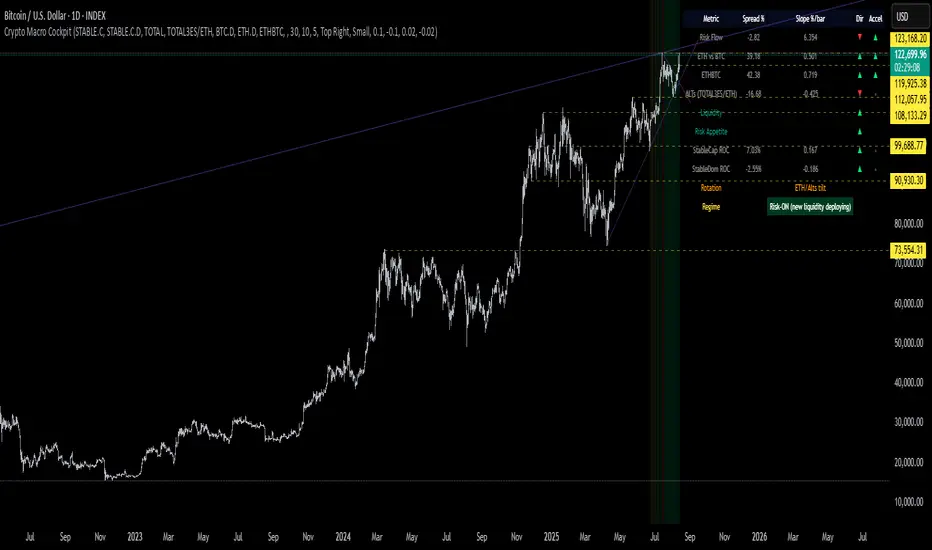
Bitcoin Uptrend Intact, Pullback First? 120.0k–119.8k is Key!__________________________________________________________________________________
Market Overview
__________________________________________________________________________________
BTC is hovering near 120.6k after a clean reclaim above the 119.8k pivot, now pressing into the 121k–122.3k daily supply cluster. Trend is bullish, but we’re trading into resistance.
Momentum: 📈 Bullish, multi-timeframe HH/HL, yet approaching a dense 121k–122.3k supply.
Key levels:
- Resistances (4H/1D) : 121,000–121,500 • 122,318 (D) • 123,235 (240)
- Supports (1H/4H/1D) : 119,800 (720 pivot) • 118,500 (240) • 115,860 (240)
Volumes: Normal across most TFs; prior spikes accompanied the 119.8k breakout.
Multi-timeframe signals: 1D/12H/6H trending up toward 122.3k; 4H/2H high-base consolidation; 30m/15m locally overbought under 121k, favoring pullbacks to 120.0k–119.8k.
Risk On / Risk Off Indicator: Neutral Buy backdrop, but tilting Neutral Sell → Sell on the very short-term, slightly contradicting the bullish push into resistance.
__________________________________________________________________________________
Trading Playbook
__________________________________________________________________________________
Strategic stance: uptrend intact—prefer buy-the-dip over chasing breakouts until we get a daily close above 122,318 with volume.
Global bias: Buy bias (Neutral Buy) while 119.8k holds; key invalidation on a close below 119.8k.
Opportunities:
- Buy the dip at 120.0k–119.8k targeting 121.5k then 122.3k/123.2k.
- Bullish breakout on H4/D close > 122,318 toward 123,235 (let it run if flows expand).
- Tactical fade 120.9k–121.1k back to 120.0k if Risk On/Off stays in Sell on LTFs.
Risk zones / invalidations: Strong rejection at 122.3k plus a close < 119.8k = bull trap risk and range-back toward 118.5k; loss of 118.5k could open 115.9k.
Macro catalysts (Twitter, Perplexity, news):
- Spot ETF inflows remain positive and above new supply → supports dip-buying.
- China liquidity mixed, Euro CPI contained, no major macro shocks → technical breakout must be confirmed by volume.
- Rotation to ETH/Alts + slowing derivatives momentum → near-term cap risk on breakouts.
Action plan:
- Plan A (buy-the-dip): Entry 120.0k–119.8k / Stop < 119.6k / TP1 121.5k, TP2 122,318, TP3 123,235 • R/R ~2–3.
- Plan B (breakout): Entry on retest 122.35k–122.5k after H4/D close > 122,318 / Stop ~122.0k / TP1 123,235, TP2 let it run • R/R ~1.5–2.
__________________________________________________________________________________
Multi-Timeframe Insights
__________________________________________________________________________________
HTFs remain bullish while LTFs are stretched into resistance.
1D/12H/6H: HH/HL above 119.8k; H4/D close > 122,318 unlocks 123,235; look for volume expansion to validate extension.
4H/2H: High-base consolidation under 121k–122k; better R/R on pullbacks to 120.0k–119.8k than chasing an immediate break.
30m/15m: Local overbought and Risk On/Off in Sell; higher odds of a pullback toward 120.0k/119.8k before any attempt above 122k.
__________________________________________________________________________________
Macro & On-Chain Drivers
__________________________________________________________________________________
Macro is calm-to-supportive; ETF flows backstop BTC, but rotation to alts and slower derivatives momentum argue for caution on breakouts.
Macro events: China credit/liquidity mixed; Spain CPI contained (ECB pressure tempered); US deficit keeps the debasement/hedge narrative alive.
Bitcoin analysis: Spot ETF inflows (+$65.9M) with IBIT buys > mined supply support demand; BTC dominance slipping (rotation to ETH/Alts) can cap near-term outperformance; futures momentum has cooled.
On-chain data: Risk-on but not euphoric; compressed IV and high alts OI increase sensitivity to surprises; STH resistance near ~127k as an upper on-chain area.
Expected impact: Constructive for dip-buys; demand confirmation (volume/flows) needed to validate a daily break above 122.3k.
__________________________________________________________________________________
Key Takeaways
__________________________________________________________________________________
An uptrend is probing a 121k–122.3k daily supply cluster with normal volumes and a mixed short-term Risk On/Off read.
- Trend: bullish 📈 while 119.8k holds.
- Top setup: buy-the-dip 120.0k–119.8k; only confirm continuation on a close above 122,318.
- Macro: ETF inflows positive, macro calm; rotation into alts may cap BTC near-term.
Stay patient: favor pullbacks and wait for an H4/D close with volume to “pay” the break above 122.3k. 👀

Up to $5 - DOT weekly update August 13 - 19thWe are currently in Minor Wave 5 and Intermediate Wave 1, with the broader Primary Cycle forming a Wave 3. Once Intermediate Wave 1 is complete, I anticipate a larger corrective move toward the 0.618 Fibonacci retracement level, or potentially deeper.
The liquidation heatmap reveals limited liquidity slightly above the current price, but a substantial concentration below it—liquidity that is likely to be targeted during the formation of Wave 2. The order book further indicates some resting orders at the 1.0 Fibonacci extension level and a significantly larger cluster at the 1.618 extension level.
Funding rates remain moderately positive, and open interest is steadily increasing, suggesting a stable upward trend. This also implies that market sentiment has not yet reached excessive euphoria and that risk appetite remains relatively contained.
In summary, the confluence of liquidity positioning, derivatives data, and Elliott Wave structure leads me to favor a primary scenario in which prices reach the 1.618 extension level of Minor Wave 5, encountering both the psychological $5.00 mark and a prominent sell wall. This confluence is expected to trigger the onset of Wave 2.

$200 soon - SOL weekly update August 12 - 18thFrom an Elliott Wave perspective, the scenario for Solana has been slightly adjusted from previous counts. Current price action suggests that SOL is already in an impulsive upward move, which aligns well with the broader correlation observed across the altcoin market. As with many other altcoins, the structure shows a completed 1–2 sequence at the Primary degree and another 1–2 sequence at the Intermediate degree. At the Minor degree, price is in the final stages of Wave 1, specifically in Minute Wave 5.
An alternative scenario — less likely but still possible — is that the move is actually a corrective structure, with the Minor degree currently forming Wave C. This would become more probable if price extends significantly beyond the 1.618 Fibonacci extension, as such behaviour would be atypical for a standard fifth wave.
From a liquidity standpoint, short- to medium-term bias points upward. The liquidity heatmap shows a large concentration of liquidity at the local high of Wave 3, as well as significant order clusters near the 1.0 extension target for the current Wave 5. However, substantial liquidity is also accumulating below current price, which will likely be targeted during the subsequent Wave 2 retracement.
Funding rates have shifted from slightly negative toward positive territory, and open interest is climbing — both signs of a stable and sustained upward move.
Macro conditions also support the current market tone. The latest CPI data came in at 2.7%, better than expected, boosting sentiment. As the FOMC meeting approaches, retail traders are increasingly positioning for a potential “altseason” — a dynamic that raises the probability of a sell-the-news event if expectations are overextended.
Given the current wave structure, liquidity positioning, and macro backdrop, the 1.0 Fibonacci extension level has been set as the primary target for the completion of this Minor Wave 5. This area aligns with heavy order clustering and fits the typical profile for a fifth wave termination before a corrective phase.
Do your own research — and trade safe.

Bitcoin: Swing Buy Opportunity on Pullback/Breakout__________________________________________________________________________________
Market Overview
__________________________________________________________________________________
Momentum : Market is showing bullish momentum 📈, consolidating at the top of its post-ATH range, with higher lows preserved and no excessive jargon.
Key Levels :
• Resistances (1D/4H/2H): 117,723 (240 pivot), 119,658 (W pivot), 119,863 (720 pivot), 123,182 (D pivot)
• Supports (1D/4H/2H): 115,903 (240 pivot), 114,708 (240 pivot), recent daily demand zone >112,000
Volumes : Generally normal volumes; moderate spikes on 1H/15m during resistance tests.
Multi-timeframe signals : Clear bullish structure on 1D to 2H; short-term weakness on 30m–15m, local bearish bias.
Risk On / Risk Off Indicator context : Neutral-buy bias on daily/HTF, but short-term sell signal on 30m–15m → local risk-off bias.
__________________________________________________________________________________
Trading Playbook
__________________________________________________________________________________
Global bias : Bullish as long as 115,903 (2H/4H support) holds on closing basis; invalidation below this level.
Opportunities :
• Buy on controlled pullback towards 116k–115,903 with LTF confirmation.
• Breakout long on close/retest above 117,723 targeting 119,658/119,863 then 123,182.
• Tactical short scalp on clean rejection from 117,723 if Risk On / Risk Off Indicator stays on Sell (LTF).
Risk/invalidation zones : Bullish invalidation below 115,903 (2H/4H close) exposes the 110k area.
Macro catalysts :
• Persistent geopolitical tensions & stablecoin regulatory headlines; volatility possible.
• Institutional inflows (ETF, Harvard) strengthen the setup, but no immediate technical macro trigger.
• Intermittent risk-off climate from external news.
Action plan :
• Entry: Long on reversal signal at 116k–115,903, OR confirmed breakout above 117,723.
• Stop: Below 115,903 (pullback) OR 117,043 (breakout).
• TP1: 117,723 / TP2: 119,658–119,863 / TP3: 123,182
• R/R: Aiming 2:1 or better; move stop to BE after TP1.
__________________________________________________________________________________
Multi-Timeframe Insights
__________________________________________________________________________________
1D/12H/6H/4H : Bullish price structure, higher lows, key support at 115,903; positive momentum, further move expected on clean breakout above 117,723.
2H/1H : Confirmed bullish flow, steady bid as long as 115,903–116k area holds; increased volume at resistance tests.
30m/15m : Notable short-term weakness, Risk On / Risk Off Indicator is on Sell, possible fake-outs above 117,723; short setups possible.
Divergences : Daily bias is bullish, but short-term signals indicate local seller dominance—careful of traps around breakouts.
__________________________________________________________________________________
Macro & On-Chain Drivers
__________________________________________________________________________________
Macro events : Geopolitical tensions (Ukraine, Middle East), US/EU economic divergence, stablecoin regulation uncertainty (US/China).
Bitcoin analysis : Institutional flows are strong (Harvard position, ETF inflows), 117.8k is the psychological breakout level for a melt-up, no significant profit-taking seen.
On-chain data : “Air gap” below ~116k, key operational support at 115,9k; no extreme outflows.
Expected impact : Technical bullish bias reinforced if supports hold, but macro risk warrants cautious stop placement.
__________________________________________________________________________________
Key Takeaways
__________________________________________________________________________________
Market remains broadly bullish with strong supports around 115,903 and high-probability setups on validated pullbacks or a clean breakout above 117,723. The prime setup is to buy controlled drops or confirmed breakouts with tight stops. Institutional activity and macro context broadly favor upside, but geopolitics require cautious management.
__________________________________________________________________________________

BTC Breakout: 119,800 to clear, 123,218 in sight__________________________________________________________________________________
Market Overview
__________________________________________________________________________________
Momentum: 📊 Consolidation range below 119,800–123,218, primary trend still 📈 bullish; buyers defending 116,100–114,723.
Key levels (TF):
- Resistances: 117,800–118,600 (6H/4H supply); 119,800 (720 PH); 123,218 (D Pivot High).
- Supports: 116,100 (6H/2H); 115,720 (240 PH); 114,723 (D Pivot Low); 112,600 (240 PL); 111,980 / 98,200 (W Pivots).
Volumes: Normal across TF → no “Extreme Volumes” (need confirmation on breakouts).
Multi-timeframe signals: HTF 1D/12H/6H/4H = Up; 2H = Down; 30m ISPD = Sell (LTF divergence).
Risk On / Risk Off Indicator context: Neutral → no sector-wide directional bias.
__________________________________________________________________________________
Trading Playbook
__________________________________________________________________________________
Global bias : Slightly 📈 bullish above 115,720/114,723; swing invalidation on a close < 114,723.
Opportunities:
- Buy pullback 116,100–115,700 toward 117,800/118,600/119,800.
- Bullish breakout: acceptance 1D/12H > 119,800 → target 123,218.
- Tactical short: clean rejection 117,800–118,600 while 2H = Down and 30m ISPD = Sell.
Risk zones / invalidations:
- Intraday longs: close < 115,700.
- Swing longs: close < 114,723 (risk 112,600 → 111,980).
- Shorts: LTF close > 118,600; structural: acceptance > 119,800.
Macro catalysts (Twitter/News):
- US pro‑crypto tilt (debanking review, retirement/PE/crypto access, Fed nominee) → sentiment tailwind.
- Softer USD (BOE hawkish cut, Fed pick) → positive for risk/BTC.
- US rates (30Y auction, yields) → a yield spike would weigh on breakouts.
Action plan:
- Pullback Buy: Entry 115,900; Stop 114,650; TP1 117,800, TP2 118,600, TP3 119,800 → R/R ~2.0–2.8.
- Breakout Setup: Enter on RP 119,800–119,400 after 1D/12H close > 119,800 + volume; Stop 118,500; TP1 121,800, TP2 123,200, TP3 (runner) → R/R ≥2.0.
- Tactical Short: Entry 118,200; Stop 118,700; TP1 116,600, TP2 116,100, TP3 115,700 → R/R ~1.6–2.5.
__________________________________________________________________________________
Multi-Timeframe Insights
__________________________________________________________________________________
1D/12H/6H/4H (Up): Bullish structure consolidating below 119,800; support cluster 115,720–114,723 holding; key setups = buy pullbacks + confirmed breakout > 119,800 toward 123,218.
2H (Down): Lower highs below 118,000; 117,800–118,600 supply favors tactical fades; needs flip > 118,600 to push 119,800.
1H/30m/15m (Up, with 30m ISPD = Sell): Sub‑range 116,100–117,900; buy scalps at 116,400/116,100; caution buying into 117,900–118,600 (rejection risk).
Key divergences: HTF Up vs 2H Down + 30m ISPD Sell → higher odds of false breaks below 118,600/119,800.
__________________________________________________________________________________
Macro & On-Chain Drivers
__________________________________________________________________________________
Macro events:
- US pro‑crypto stance (debanking review, retirement/PE/crypto access, Fed nominee) → better access/regulatory tone (Twitter sources).
- Gold tariffs/repricing narrative → reinforces “digital gold”.
- Softer USD and easing inflation impulses → support risk; watch long-end yields.
Bitcoin analysis:
- Technical: testing the upper bound of a rising wedge, momentum improving.
- Institutional/access: treasury/banking initiatives may support participation.
- Energy/valuation: Bitcoin Energy Value ~145,000 vs spot ~116,000 → implied discount.
On-chain data:
- Post‑ATH indecision; “air gap” 110,000–116,000.
- STH in profit ~70% → fresh demand needed.
- ETFs: ~−1,500 BTC outflow recently (risk if it persists).
- Funding <0.1% → moderate leverage, less immediate squeeze.
- On‑chain pivot ≈ 116,900 to reclaim; 119,800 critical for confirmation.
Expected impact:
- Friendlier macro + balanced on‑chain favor a cautiously bullish technical bias, but confirmation requires acceptance above 119,800 with volume.
__________________________________________________________________________________
Key Takeaways
__________________________________________________________________________________
- Overall bias: cautiously 📈 bullish in a range; buy dips at 116,100–115,700; swing invalidation below 114,723.
- Top setup: confirmed breakout > 119,800 with volume to target 123,218; otherwise fade 117,800–118,600.
- Macro: US pro‑crypto tone and softer USD support BTC, but monitor UST yields.

BTC Support Tested, Mixed Cross-TF Signals, Tactical Caution__________________________________________________________________________________
Technical Overview – Summary Points
__________________________________________________________________________________
Momentum & context: Bullish bias confirmed on higher timeframes (1D/4H), but bearish divergences appearing from 2H downward.
Major support/resistance: 114,600–115,000 and 114,667 hold as the critical zone. Key resistance: 116,900–117,000 must break for a bullish trigger.
Volume: Normal on HTF. Very high volumes detected on 30min/15min during the 116,000+ resistance test (climax/reversal risk).
Multi-timeframe behavior: Risk On / Risk Off Indicator = “Strong Buy” from 1D to 1H, short-term sellers active below 2H (ISPD = Sell on 15min).
__________________________________________________________________________________
Strategic Summary
__________________________________________________________________________________
Overall bias: Bullish structure preserved, but fragility evident on intraday.
Opportunities: Tactical buys possible on 114,600–115,000 (stop <114,000) or strong breakout above 116,900.
Risk: Clear break below 114,000 = risk of drop to 110,000. Volume climax/ISPD Sell below resistance = profit taking advised.
Macro catalysts: Ongoing geopolitical news (US/Russia/China), volatility during US announcements; post-Fed digestion.
Action plan: Strict monitoring of ETF flows/funding/US news. Cautious accumulation on daily/4H, short-term shorts only if confirmed by lower timeframe signals.
__________________________________________________________________________________
Multi-Timeframe Analysis
__________________________________________________________________________________
1D: Strong upward bias, price at major support, calm volume.
12H/6H/4H: Robust sectorial momentum (Risk On / Risk Off Indicator “Strong Buy”), daily/4H supports holding, initial bearish signs on 2H/1H.
2H/1H: Growing fragility: “Down” trend confirmed on 2H, momentum loss, buyer exhaustion visible.
30min/15min: Very high volumes under resistance, ISPD Sell 15min: short-term correction alert. Overbought microstructure, trigger risk if rejection at 116,000–116,250.
Cross-TF summary: Market mostly “Up”, but tactical vigilance around supports, increased caution above 116,000.
Summary:
- Bullish structure maintained on daily/4H, but top/reversal warning signals on brief lowest TFs (15/30min).
- 114,600–115,000 pivot zone is decisive: holding = increased stabilization/accumulation probability; break = risk of extension down to 110,000.
- Active monitoring of ETF flows/funding/news is essential.
__________________________________________________________________________________
Macro & Bitcoin Analysis (Twitter Summary)
__________________________________________________________________________________
Geopolitical risks remain high, US/China protectionism & Fed on hold: crypto market in wait-and-see mode.
BTC broke 116k, entered low-liquidity zone; rebound remains “fragile.”
ETF flows: moderate return to buying, funding neutral.
Possible post-pullback accumulation signal, but needs confirmation.
Strategy: swing buy on defended/major supports, strict management if short-term seller signals (volume/ISPD).
__________________________________________________________________________________
Action Steps
__________________________________________________________________________________
Buy on 114,600–115,000 zone if confirmed by daily/4H, stop loss <114,000.
Re-buy or more aggressive swing on clear breakout above 116,900–117,000.
Take profits/short if clear rejection 116,000+ with volume climax/ISPD Sell.
Monitor macro (US events), ETF flows, funding rate, volume behavior.