$ONDO: Ondo Finance – Tokenizing the Future or Facing Roadblocks
(1/9)
Good morning, champs! ☀️ LSE:ONDO : Ondo Finance – Tokenizing the Future or Facing RWA Roadblocks?
Ondo Finance just joined Mastercard’s Multi-Token Network, aiming to tokenize U.S. Treasuries! But with market volatility, is this RWA gem a buy or a wait? Let’s dive in! 🔍
(2/9) – PRICE PERFORMANCE 📊
• Recent Trend: Transaction volume spiked to 400M in Jan 2025, now ~300M 💰
• Market Insight: Up 1.6% recently (Daily Hodl, Feb 2025) 📏
• Sector: RWA tokenization surging with TradFi interest 🌟
It’s buzzing in the DeFi space! ⚙️
(3/9) – MARKET POSITION 📈
• Market Cap: Not specified; holds 40% of tokenized securities market 🏆
• Holdings: U.S. Treasuries, bonds via USDY, OUSG tokens ⏰
• Trend: Whales hold 88% of tokens, per IntoTheBlock 🎯
Firm, leading RWA tokenization! 🚀
(4/9) – KEY DEVELOPMENTS 🔑
• Partnership: Joined Mastercard MTN as first RWA provider (Feb 26, 2025) 🔄
• Expansion: Teamed with World Liberty Financial for RWAs 🌍
• Market Reaction: Steady growth in transaction volume 📋
Adapting, bridging TradFi and DeFi! 💡
(5/9) – RISKS IN FOCUS ⚡
• Volatility: Crypto market swings could hit token value 🔍
• Regulation: Compliance hurdles in tokenized assets 📉
• Concentration: High whale ownership (88%) risks dumps ❄️
Tough, but risks loom! 🛑
(6/9) – SWOT: STRENGTHS 💪
• RWA Leader: 40% tokenized securities market share 🥇
• Big Backers: BlackRock, Coinbase Ventures support 📊
• Tech Edge: Tokenizing U.S. Treasuries for DeFi 🔧
Got fuel in the tank! 🏦
(7/9) – SWOT: WEAKNESSES & OPPORTUNITIES ⚖️
• Weaknesses: High whale concentration, market volatility 📉
• Opportunities: TradFi integration, DeFi yield growth 📈
Can it tokenize to the moon? 🤔
(8/9) – 📢Transaction volume at 300M, Mastercard partnership live, your take? 🗳️
• Bullish: $2 soon, TradFi loves it 🐂
• Neutral: Steady, risks balance ⚖️
• Bearish: $0.90 looms, whales dump 🐻
Chime in below! 👇
(9/9) – FINAL TAKEAWAY 🎯
SMCI’s transaction volume and TradFi ties scream potential 📈, but whale concentration adds caution 🌿. Volatility’s our buddy—dips are DCA gold 💰. Grab ‘em low, climb like pros! Gem or bust?
ONDO
$ONDO - READY TO FLY???CRYPTOCAP:ONDO - 15% up already 💰
You know what's coming?? 🚀
If yes, like & share! 👍

ONDO’s Last Dip Before Liftoff? Don’t Miss This Entry!Yello, Paradisers! Are you positioned for a high-probability bullish reversal on #ONDO? Price is closing in on a key demand zone where a powerful move could ignite, but only if the structure holds.
💎ONDO is currently forming a Bullish Gartley Pattern, and price action is nearing the crucial $0.76–$0.80 demand zone, which completes the D-leg of the structure. This area aligns with Fibonacci confluences and offers a high-probability zone for a reversal if the pattern holds.
💎#ONDOUSDT is currently correcting towards the $0.76–$0.80 demand zone, where the point D of the Bullish Gartley Pattern is expected to complete. This area is technically significant and marks the potential start of a bullish reversal. If price reacts strongly from this zone, a reclaim of the $0.92 level would serve as the first sign of strength, setting up a move toward the moderate resistance near $1.00. This would confirm short-term bullish intent and open the door for further upside.
💎If that strength persists and momentum builds, the next logical target would be the strong resistance around $1.15–$1.20. This level has historically acted as a barrier and would likely see profit-taking or slowdown unless broader market conditions support continuation.
💎The $0.76–$0.80 zone also acts as a strong support. It’s an area where buyers are expected to defend aggressively, and it won’t be easy for sellers to push the price below it unless momentum shifts completely.
Paradisers, strive for consistency, not quick profits. Treat the market as a businessman, not as a gambler.
MyCryptoParadise
iFeel the success🌴

#ONDO - Bullish pennant still in play LSE:ONDO - Bullish pennant still in play 📈
Surely a matter of weeks before the real move start!

ONDOUSDT UPDATE#ONDO
Update
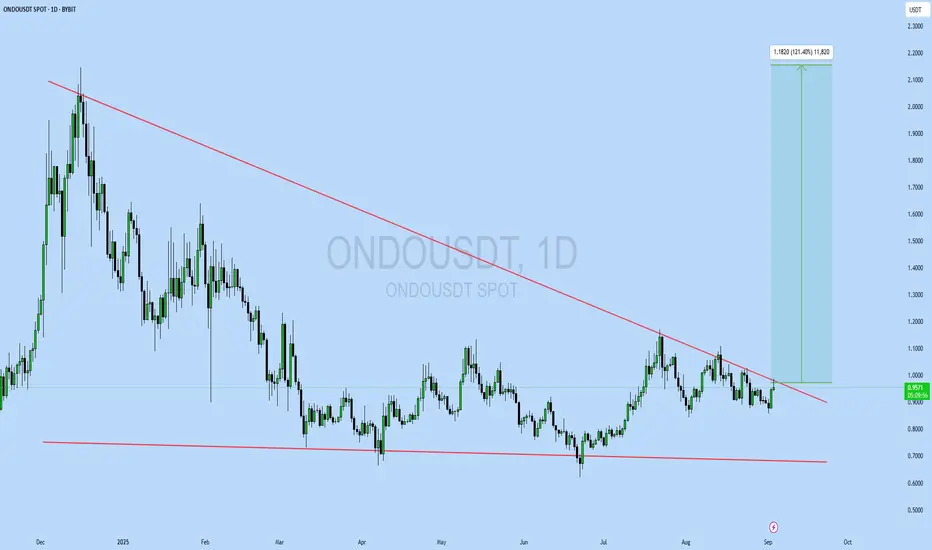
ONDO Technical Setup
Pattern: Falling Wedge Pattern
Current Price: $0.95
Target Price: $2.13
Target % Gain: 121%
Technical Analysis: ONDO is breaking out of a falling wedge on the 1D chart, a bullish reversal setup supported by strong price compression near support. A breakout above the trendline signals potential continuation toward the $2.13 zone with momentum building.
Time Frame: 1D
Risk Management Tip: Always use proper risk management.
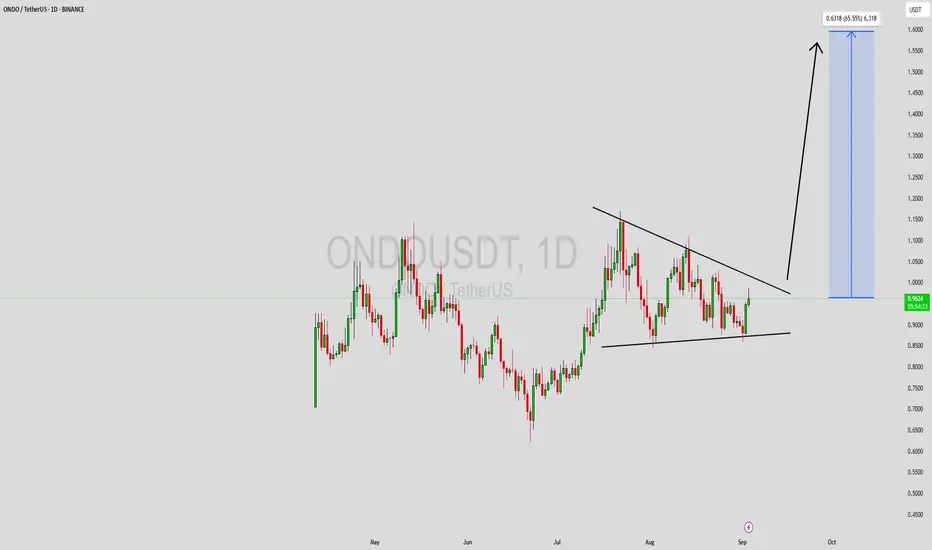
ONDOUSDT Forming Bullish ContinuationONDOUSDT is currently forming a consolidation structure that signals a potential breakout in the coming sessions. The chart pattern shows price compression within a narrowing range, which often acts as a precursor to a strong directional move. With trading volume holding steady at supportive levels, the conditions appear favorable for a bullish continuation. Investors are closely monitoring this setup, as the pair has been gathering momentum, hinting at the possibility of a significant upside rally.
If ONDOUSDT manages to break above its resistance trendline, it could trigger a strong wave of bullish momentum. The technical projection suggests a potential 50% to 60%+ gain, aligning with the market’s anticipation for higher valuations. Historically, such breakout formations have delivered powerful price surges, especially when paired with increasing investor confidence and rising market interest.
Market sentiment around ONDOUSDT has been growing more optimistic as it continues to attract investor attention. The volume profile highlights active participation, which often signals accumulation by strong hands ahead of a breakout. A confirmed move above resistance could set the stage for a sharp rally toward higher targets, giving traders and investors a strong opportunity in the short to mid-term.
In conclusion, ONDOUSDT is positioned for a bullish breakout as long as momentum continues to build. With solid volume backing the price structure and investors taking interest, the coin could be preparing for a notable rally. Traders should watch for a decisive breakout to capture the potential upside move.
✅ Show your support by hitting the like button and
✅ Leaving a comment below! (What is You opinion about this Coin)
Your feedback and engagement keep me inspired to share more insightful market analysis with you!
ONDO - Bullish structure HTF🟢 LSE:ONDO – Bullish Structure (HTF) 📈
✅ Triple bottom confirmed near $0.86
✅ Overall bullish high time frame structure
A daily close above $1.10 = price discovery + major pump possible towards $1.30–$1.50+
Top-tier project & solid #RWA pick for the long term.Adoption wave is likely on the way!
🚨 Who wants to see a short-term chart breakdown? Drop a 👍!

ONDO/USDT — Descending Triangle at a Critical Zone!🔎 Pattern & Structure Analysis
ONDO/USDT is currently forming a Descending Triangle pattern, where:
Lower Highs are consistently forming (yellow descending trendline).
Horizontal support in the 0.78–0.95 USDT demand zone has been tested multiple times since early 2025.
This structure reflects increasing selling pressure, while buyers keep defending the demand zone.
Historically, a descending triangle leans toward a bearish continuation, but a strong breakout can flip the bias into a bullish reversal.
---
🟢 Bullish Scenario
If price manages to break and close daily above the descending trendline + 1.022 USDT with strong volume, upside targets open:
Target 1: 1.109 USDT (+21.6%)
Target 2: 1.206 USDT (+32.3%)
Target 3: 1.411 USDT (+54.8%)
Major Target: 1.802 – 2.04 USDT (potential >100% rally if momentum extends).
📌 Key confirmation: breakout should be followed by a successful retest to confirm strength and avoid false breakouts.
---
🔴 Bearish Scenario
If price breaks down below 0.78 USDT, the descending triangle confirms as a bearish continuation. Downside targets are:
Target 1: 0.6216 USDT (previous swing low, −31.9%).
Target 2: 0.50 USDT (psychological level).
Extended Target: 0.42–0.45 if bearish momentum accelerates.
📌 Note: The more times support is tested without a significant bounce, the weaker it becomes.
---
📌 Technical Insights
Volume: essential for confirmation — weak volume may lead to fakeouts.
Retest: both bull and bear scenarios should be confirmed by a clean retest.
Momentum: RSI on daily remains neutral, giving room for either side to take control.
Market structure: until a breakout above 1.109 or breakdown below 0.78, price remains compressed inside the triangle.
---
🎯 Conclusion
ONDO/USDT is at a make-or-break level.
Bullish → Daily close above 1.022–1.109 could trigger upside toward 1.20–1.41.
Bearish → Daily close below 0.78 could drag price to 0.62 or lower.
⚠️ Descending triangles statistically favor the downside, but confirmation with daily close + volume is key. Always wait for validation before positioning.
---
ONDO is consolidating inside a Descending Triangle near the 0.78–0.95 demand zone. The price is at the tip of the structure, preparing for a major move.
Bullish → Daily close above 1.022–1.109 → upside targets 1.20–1.41.
Bearish → Breakdown below 0.78 → downside targets 0.62, then 0.50.
This is a decisive zone. Watch for confirmation with volume and retests before taking entries.
#ONDO #ONDOUSDT #Crypto #TechnicalAnalysis #CryptoTrading #ChartPattern #DescendingTriangle
ONDO looking hectic. Time to prepare. ONDO is still within range, potentially finding its bottom. This would be a good time to formulate a setup based on RR. BOS = get out. If CHOCH, then enjoy the ride.

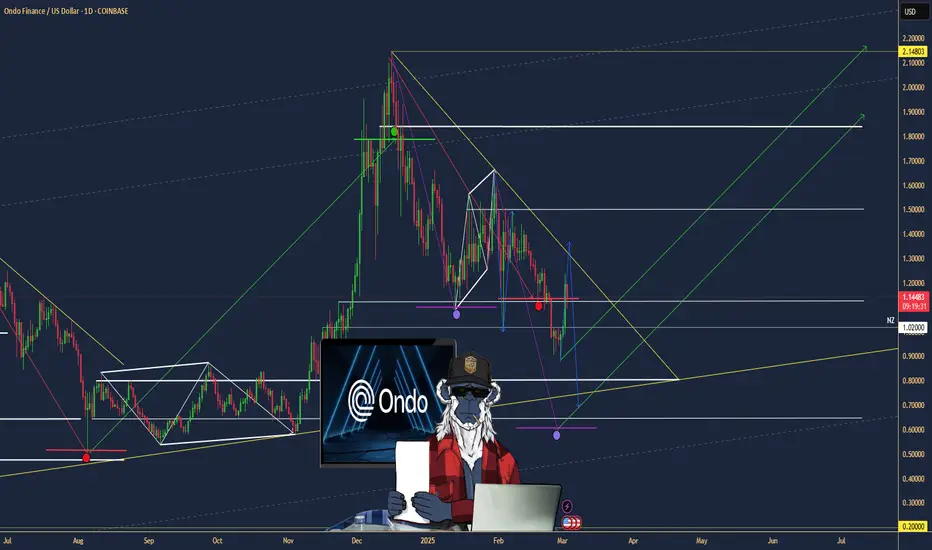
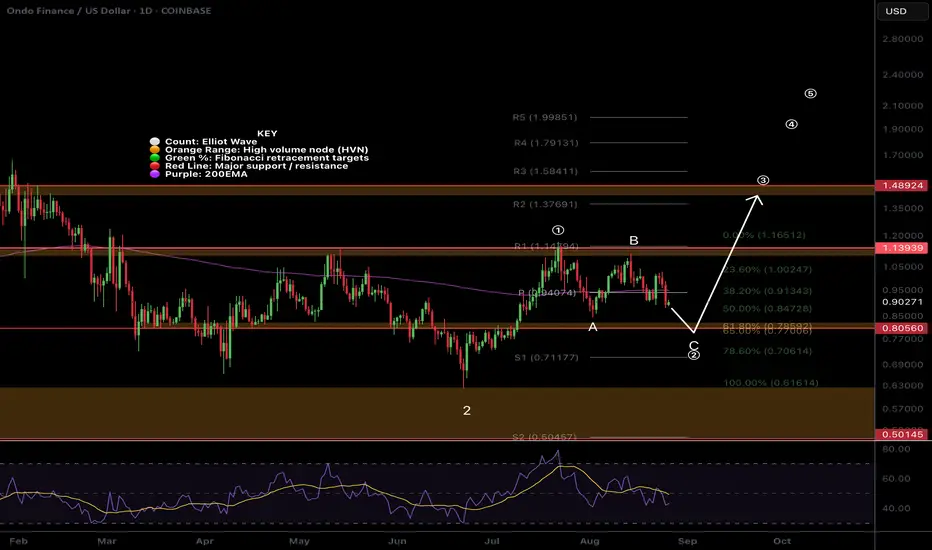
ONDO Wave C of 2 underway?LSE:ONDO appears to be printing wave C of 2 with a target of the High Volume Node and Fibonacci retracement golden pocket.
RSI has room to fall into oversold, price has lost the daily pivot and 200EMA.
Wave (3) has an initial target of $1.48
Safe trading
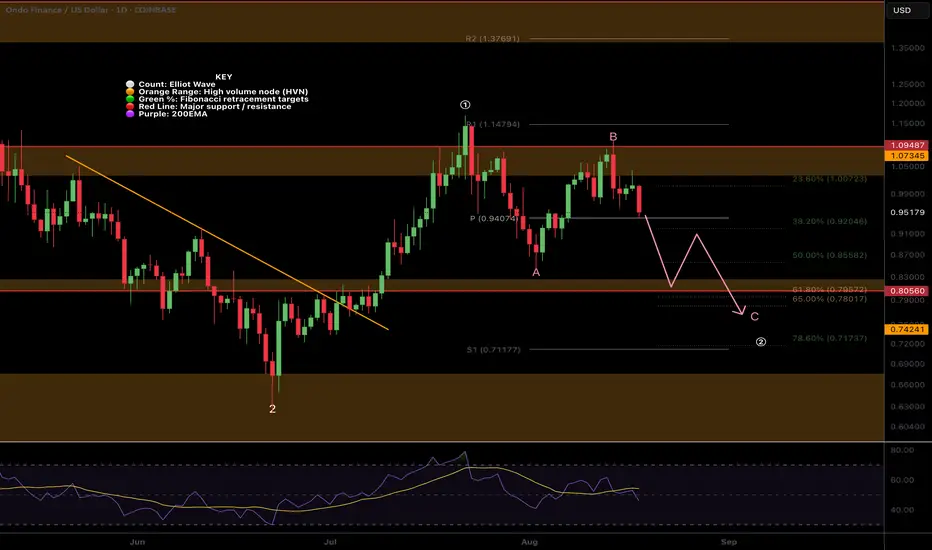
$ONDO ABC Correction in Wave 2?LSE:ONDO wave (c) of 2 appears to be underway after the failure to reach a new local high. However there is strong support just below of the daily pivot and 200EMA.
Failure to hold this level brings up the High Volume Node support and golden pocket at $0.79. RSI has room to fall and the alt-coin golden pocket, Fibonacci 0.786 sits at the S1 daily pivot.
Analysis is invalidated above wave B.
Safe trading
#ONDO Ready to Make a Bullish Move | Must Watch For BullsYello, Paradisers! Is #ONDO getting ready for a powerful breakout, or are we about to witness yet another bull trap? Let’s break down the real picture on #ONDOUSDT:
💎After steadily climbing inside an ascending wedge, #ONDOUSD is now pressing against a key resistance area around $1.05–$1.07. A breakout above this zone would significantly boost the probability of a bullish continuation, especially with the 50EMA providing underlying support.
💎The immediate support zone to watch is between $0.84–$0.85, aligning with the lower boundary of the channel and overlapping with a visible demand area. This is where we expect buyers to defend the trend if any pullback occurs.
💎If bulls manage to hold this zone and break through the current resistance, our next upside target is the moderate resistance level at $1.34. From there, the strong resistance sits at $1.72, which will be the key decision point for any further upside momentum.
💎On the flip side, a breakdown below $0.72, our bullish invalidation level, would nullify this setup entirely and open the door for a deeper drop, where sellers are likely to step in aggressively.
Stay patient, Paradisers. Let the breakout confirm, and only then do we strike with conviction.
MyCryptoParadise
iFeel the success🌴

Bitcoin and Broad Market Breakout (BTC, ETH, SOL, PENDLE)In this video we take a look at why the market rallied Thursday.
- 93% of FOMC September Rate cut and 3 possible cuts in 2025
- UK just dropped rates to 4%
- President Trump approved letting 401k's invest in crypto
- Trump removed resitrictions by banks to 'de-bank' crypto investors
The charts looks very bullish here and I revisit the potential path to $150 BTC this year.
Also ETH, Solana charts and 'The Rocket'
As well as the 25% move on Pendle which I had recommended as a 'Buy' the day before.
Let me know what you think...
The BULL is Back.

ONDO:What are the implications of being listed on an exchange?Hello friends🙌
What are the implications of being listed on an exchange?
✅Well, the first question that comes to mind when a currency is listed on an exchange is what impact does it have? Will the price be pumped or dumped? Let's examine it together.
✅Well, many currencies are listed on exchanges, and not every currency that is listed is necessarily pumped or dumped.
Many factors are involved in this, the most important of which is the chart.
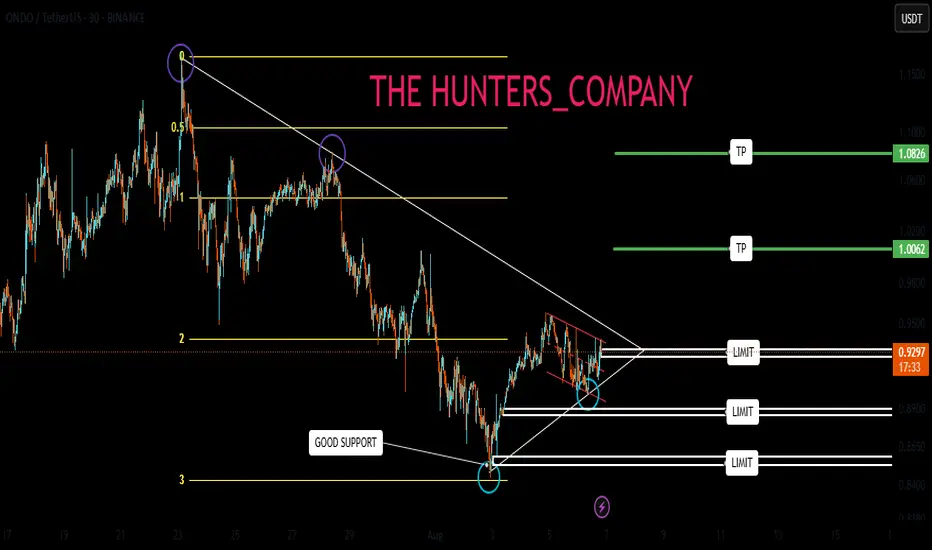
✅So, if we look at the chart of this currency in the 30-minute time frame, which can be considered a short-term time frame, we see that we had a decline due to the selling pressure in the market for the past few days, and now we see that in the third leg of the Fibonacci, buyers supported the price and created higher lows.
✅Now, these higher lows alone are not enough for us to buy, we need other confirmations, the most important of which is a valid breakdown of the identified resistance.
By breaking this resistance validly, we can buy in the areas we have identified for you in a stepwise manner, with capital and risk management, and move towards the specified goals.
If it fails to break the specified resistance and the buyers do not have enough power, we will refrain from buying it.
✅So this was the listing of currencies on the exchange and its impact on the currency price.✅
🔥Follow us for more signals🔥
*Trade safely with us*
TradeCityPro | ONDO Builds Strength Beneath Key Supply Barrier👋 Welcome to TradeCity Pro!
In this analysis, I want to review the ONDO coin for you — one of the RWA projects, currently ranked 37th on CoinMarketCap with a market cap of $2.93 billion.
📅 Daily Timeframe
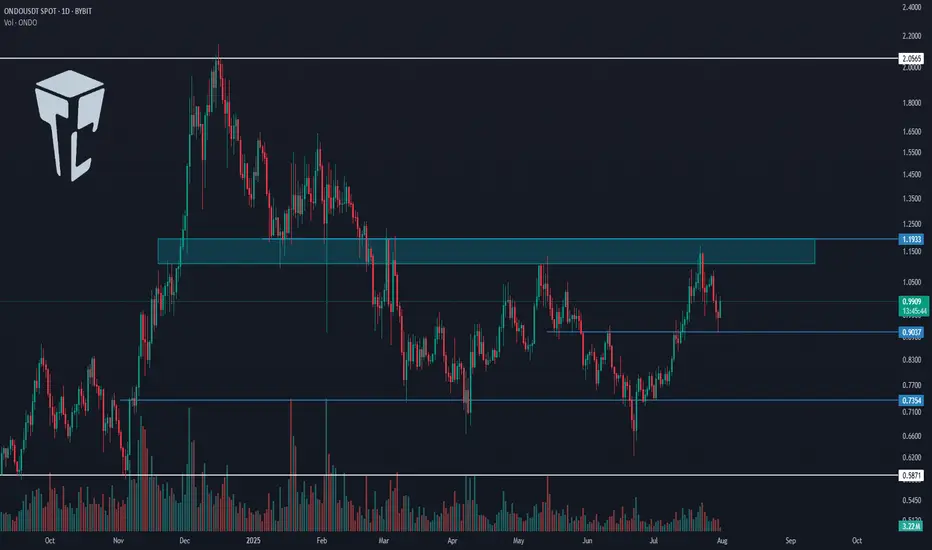
In the daily timeframe, as you can see, this coin has formed a range box between the levels of 0.7354 and 1.1933, and the price is currently sitting in the upper half of this box.
✔️ At the moment, the price is hovering around 0.9037, and it’s forming a higher low above 0.7354. If this low gets confirmed, the probability of breaking above 1.1933 increases.
⭐ The 1.1933 zone is a very significant supply level that was previously acting as support in late 2024, and after being broken, has since acted multiple times as resistance.
📊 If this area breaks, we can open a long position, or even buy this coin in spot. Personally, if this trigger is broken, I’ll open a long-term long position.
✨ The target for this position is 2.0565, and once the price reaches this level, we can take profits and consider a spot buy.
📝 Final Thoughts
This analysis reflects our opinions and is not financial advice.
Share your thoughts in the comments, and don’t forget to share this analysis with your friends! ❤️
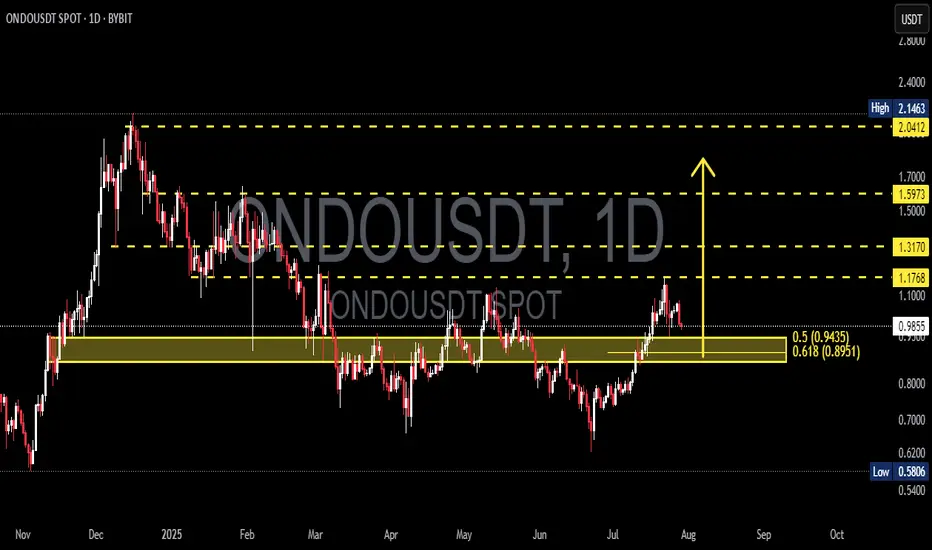
ONDOUSDT at a Critical Fibonacci Zone! Will Move Toward $2+?ONDOUSDT is currently trading at a critical technical zone — the Fibonacci Retracement Golden Pocket (0.5–0.618) — following a significant upward rally. Historically, this zone often acts as a high-probability reversal area, or at the very least, a zone for major consolidation before the next big move.
---
🧠 Market Structure & Price Action
After reaching a local high near $1.17, price retraced and is now approaching the key support zone between $0.9435 (Fib 0.5) and $0.8951 (Fib 0.618).
This zone also coincides with a previous strong resistance, which could now act as new support (role reversal).
Current price action shows selling pressure, but there is no confirmed breakdown from the Golden Pocket yet.
---
🧩 Pattern Recognition & Key Levels
Potential Reversal Pattern: Look for a bullish falling wedge or descending channel on lower timeframes as a signal for reversal.
Demand Zone (Yellow Box): The zone between $0.8951–$0.9435 is reinforced by horizontal price structure support.
Layered Resistance Levels:
$1.1768 → Recent swing high
$1.3170 → Mid-range resistance
$1.5973 → Psychological and retracement target
$2.0412 → Range top / full recovery zone
Minor Support: If the Golden Pocket fails, potential downside targets include $0.70 and the major low at $0.5806.
---
📈 Bullish Scenario
✅ Strong bounce from the Golden Pocket
✅ Bullish candlestick confirmation (e.g., bullish engulfing or pin bar)
✅ Rising volume showing buyer presence
✅ Break above $1.1768 would signal continuation toward:
🎯 Target 1: $1.3170
🎯 Target 2: $1.5973
🎯 Target 3: $2.0412 (full structural recovery)
---
📉 Bearish Scenario
❌ If price breaks below $0.8951 with a strong bearish candle and high volume:
The structure shifts bearish, increasing risk of a drop to $0.70 – $0.62
Worst-case scenario: retest of $0.5806, the major bottom
Bullish structure invalidated upon confirmed breakdown
---
🎯 Strategy & Takeaway
ONDOUSDT is currently in a "make or break" zone. The Golden Pocket between $0.895–$0.943 could either:
Act as a springboard for the next bullish leg,
Or fail, triggering a deeper correction.
Traders should wait for confirmation via:
Candlestick patterns
Volume breakout/inflow
Break above or below the key structure
This area offers a high-reward, controlled-risk setup for swing traders, with invalidation just below the Golden Pocket.
---
📌 Summary of Key Levels
Level Description
$0.9435 Fibonacci 0.5 (support)
$0.8951 Fibonacci 0.618 (Golden Pocket)
$1.1768 Minor resistance
$1.3170 Mid-level resistance
$1.5973 Bullish target
$2.0412 Major resistance / recovery top
$0.5806 Extreme support (macro low)
#ONDOUSDT #CryptoTechnicalAnalysis #GoldenPocket #FibonacciLevels #CryptoTrading #SupportResistance #BullishSetup #BearishScenario #SwingTrade #AltcoinAnalysis
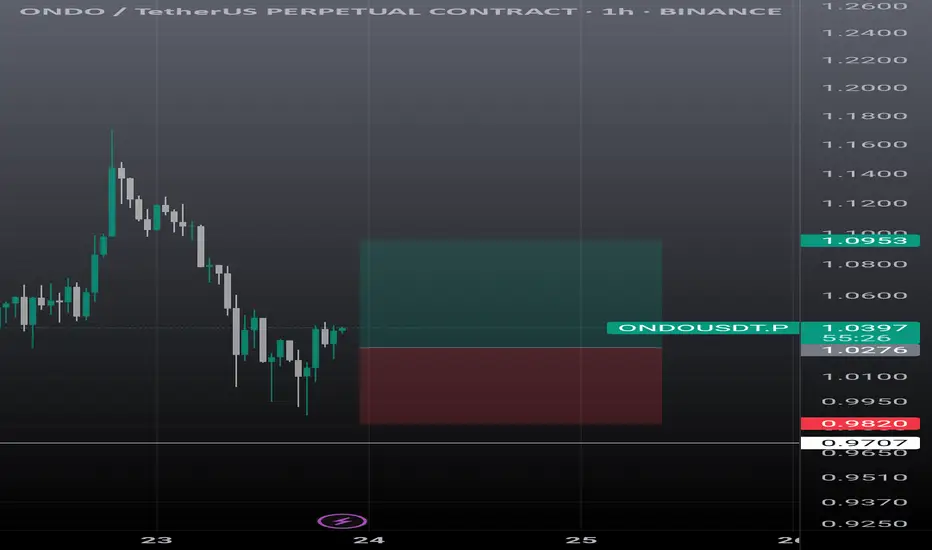
Ondo usdt scalp trade.First entry at current market price, and second one is mentioned, sl just below today low. Tp is mentioned.
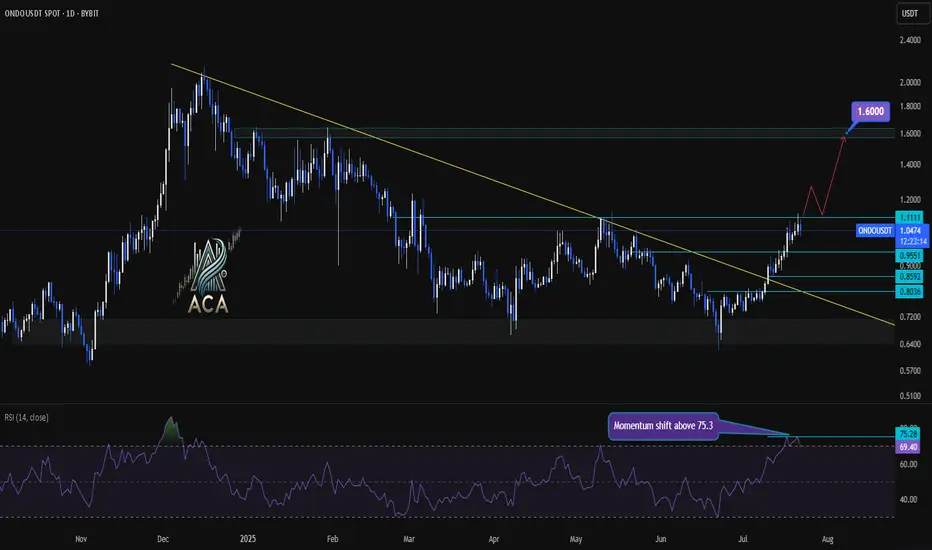
ONDOUSDT Daily Chart Analysis | Momentum Shift & Breakout LevelsONDOUSDT Daily Chart Analysis | Momentum Shift & Breakout Levels
🔍 Let’s dive into the ONDO/USDT daily chart and break down the latest momentum signals, key breakout areas, and targets for bulls.
⏳ Daily Chart Overview
The daily trend shows significant recovery after prolonged downward pressure, with price action now testing critical resistance levels. A key descending trend line has recently been challenged, highlighting a potential shift in market structure.
🔺 Bullish Setup
- Momentum Trigger: The RSI has closed above 75.3, signaling a strong momentum shift and upping the odds for continued upside.
- Breakout Confirmation: Watch for a daily candle close above the $1.1111 resistance level. This would confirm a bullish breakout and could serve as a solid trigger for further upside.
- Trend Line Dynamics: The price has decisively broken above the major descending trend line, which had capped rallies for months—removing a significant area of supply and emboldening bulls.
- Upside Target: Once confirmed, this setup opens the door for an advance towards the $1.60 area, where the next major resistance sits.
📊 Key Highlights
- Daily RSI closing above 75.3 reflects strong market momentum and buyer dominance.
- A daily candle close above $1.1111 can be used as a bullish trigger.
- The long-term descending trend line has been broken, indicating a major momentum shift.
- Immediate upside target stands at $1.60, representing a clear resistance level for profits or further evaluation.
🚨 Conclusion
Momentum is clearly shifting in favor of the bulls as technical barriers fall by the wayside. For traders looking to position long, confirmation above $1.1111 combined with the powerful RSI reading sets the stage for a move towards $1.60—keep these levels on your radar as the setup plays out!
$ONDO For A CondoBYBIT:ONDOUSDT is showing one of the cleanest structures among altcoins right now — attempting to breakout from its accumulation.
We have a strong recovery off the local bottom, reclaiming $1 and showing signs of strength. Could retest $2 or even higher till $2.8
Catalysts:
— U.S. crypto legislation highlights @OndoFinance as institutional-grade
— BNB Chain to integrate tokenized U.S. stocks via Ondo
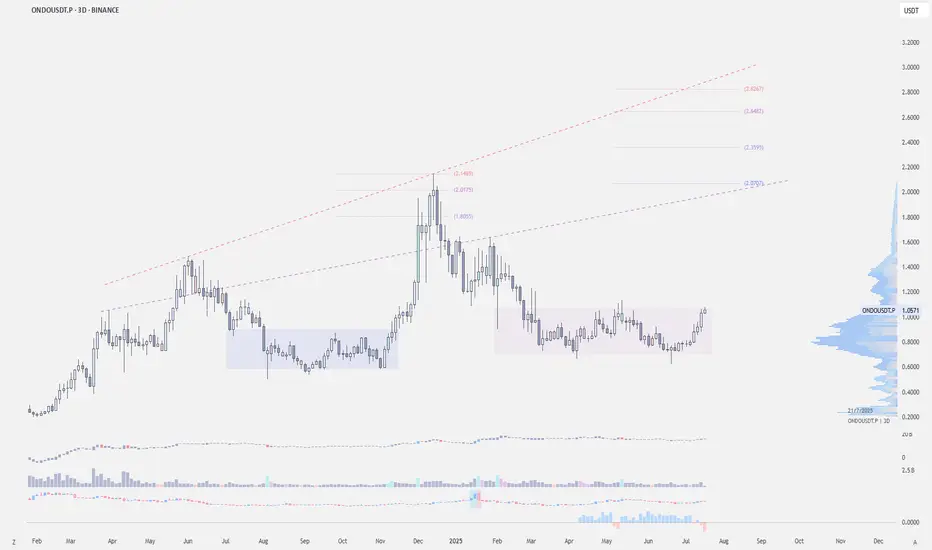
Ondo: The Bullish Wave is Over? 410% - 579% Profits PotentialONDOUSDT managed to produce three weeks closing green with the last one conquering EMA13. When this happened back in November 2024 there was a period of continued growth. Look at it in this way; the week is young and the market is taking a break, growth will resume in a matter of days. This same week more green and continued green long-term.
When ONDOUSDT broke above EMA13 last year, it produced a total of six weeks of straight up. Now, back then we were looking at a small jump, today we are looking at a very strong bullish impulse. The 2025 bull market in full force.
Three green weeks is only the start. We are about to experience 12-24 weeks of bullish action. We are looking at the bottom, bullish momentum is yet to grow. It is still early, but early won't be a reality for too long. Buy and hold.
We have two targets that are interesting: 410% and 579%. These can be hit within 3 to 6 months. Allow for retraces and swings on the way up.
Namaste.

Ondo USDT SCALP TRADEIF this 4hr fvg breaks then I will look for short, otherwise expecting to hold this level and wipe out previous liquidation.

ATH Mode On => Request Your Altcoin Analysis NowThe bulls are back in action, and momentum is building fast! ⚡
To celebrate this major milestone, I’m opening the floor to YOU 👇
Request any altcoin in the comments, and I’ll personally share my technical analysis on it! 📊✅
Let’s make the most of this market together — it’s altcoin season waiting to happen! 🚀
📚 Always follow your trading plan regarding entry, risk management, and trade management.
Good luck!
All Strategies Are Good; If Managed Properly!
~Richard Nasr

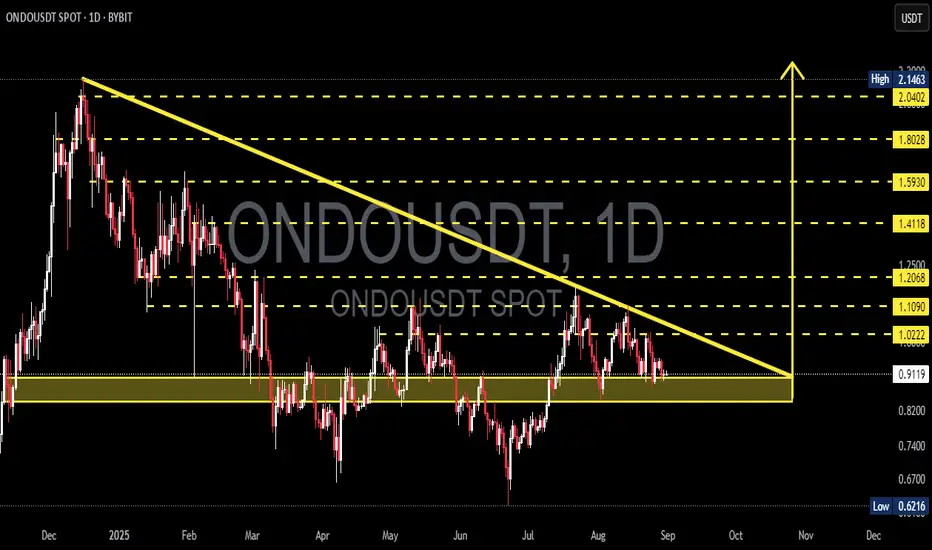
ONDO/USDT Breakout Watch – Reversal Incoming
🔍 Overview:
The ONDO/USDT pair is currently at a critical inflection point. After months of being suppressed in a downtrend, price action is now testing a major descending trendline that has capped the market since the peak in December 2024. A breakout here could be the beginning of an explosive bullish phase — but failure might confirm further downside.
📉 Pattern: Descending Trendline Compression
ONDO has been forming consistent lower highs, creating a clear descending trendline structure.
Price is now pressing against this resistance, attempting a breakout with a strong 2D candle.
A confirmed breakout will occur once ONDO closes above $0.916 on the 2D chart, which also acts as a horizontal resistance.
✅ Bullish Scenario – The Start of a Mid-Term Reversal?
If the breakout is confirmed, we could see strong upward momentum, as there’s relatively little resistance in the upper zones.
🎯 Potential Targets:
1. $1.11 – First psychological and technical resistance.
2. $1.327 – Previous consolidation zone from Feb–Mar 2025.
3. $1.577 – Major supply zone before the heavy correction started.
4. $2.045 - $2.145 – All-time high area, the ultimate mid-to-long-term target.
📈 Note: Although not shown in this chart, RSI is likely leaving oversold territory, supporting the bullish momentum shift.
❌ Bearish Scenario – Classic Bull Trap Ahead?
If price fails to break and close above the trendline and $0.916, this could turn into a fakeout or bull trap.
📉 Possible downside levels:
$0.8399 – Minor support currently holding.
$0.70 – Strong horizontal demand zone.
$0.53 – Long-term support base, potential double bottom zone.
If momentum fades here, ONDO could revisit these lower areas before finding a true bottom.
🧠 Sentiment & Trading Strategy:
Breakout confirmation: Wait for a solid 2D candle close above the descending trendline and $0.916. Look for volume spike.
Conservative strategy: Enter on break + retest of the trendline, with SL below $0.83 and multi-level TPs.
Aggressive strategy: Enter on the initial breakout with dynamic trailing stops and resistance-based targets.
🏁 Conclusion:
ONDO/USDT is at a make-or-break moment. A confirmed breakout from this long-term descending structure may trigger a strong reversal with over 100% potential upside. However, if the market rejects this breakout attempt, it could extend its bearish trajectory.
Patience, confirmation, and disciplined risk management are key here.
📌 Key Levels to Watch:
Support: $0.8399 – $0.70 – $0.53
Resistance: $0.916 – $1.11 – $1.327 – $1.577 – $2.045 – $2.145
#ONDO #ONDOUSDT #CryptoBreakout #BullishSetup #AltcoinAnalysis #CryptoReversal #TradingViewSignals #TechnicalBreakout #DescendingTrendline #PriceAction
