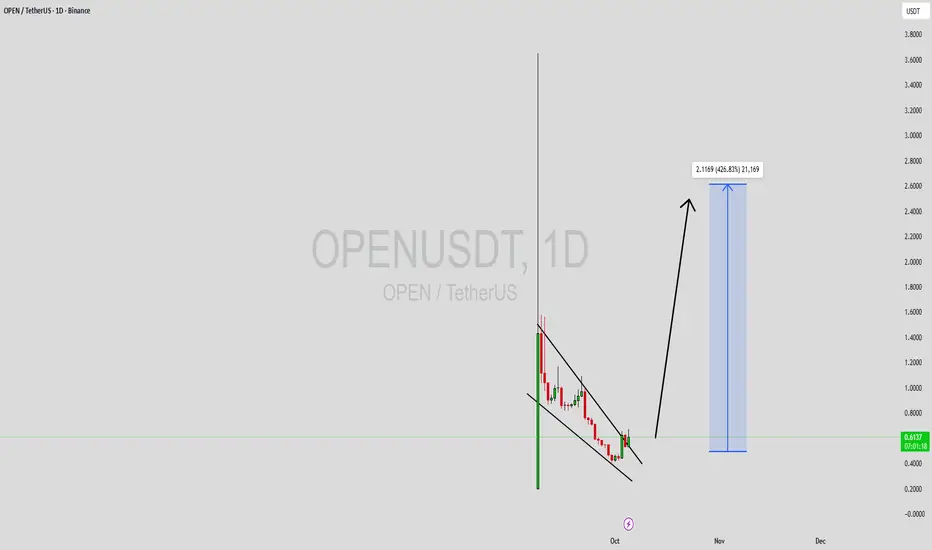
OPENUSDT Forming Bullish ReversalOPENUSDT is forming a clear bullish reversal pattern, a classic bullish reversal signal that often indicates an upcoming breakout. The price has been consolidating within a narrowing range after the earlier decline, suggesting that selling pressure is gradually weakening while buyers are quietly stepping in to regain control. With consistent volume confirming accumulation at these lower levels, the setup is lining up for a potential bullish breakout in the near future. If the price breaks decisively above the wedge resistance, the projected move could deliver an impressive gain of around 90% to 100% from the breakout point.
This falling wedge pattern is typically seen at the end of downtrends or during corrective phases, and it serves as a strong indication that market sentiment may be shifting from bearish to bullish. Traders closely watching OPENUSDT are seeing a similar strengthening momentum as it approaches its own breakout zone. The healthy trading volume supporting the pattern adds solid confidence, showing that market participants are positioning early in anticipation of a reversal.
The rising interest in OPENUSDT is driven by growing optimism about the project’s long-term fundamentals combined with this promising technical structure. A confirmed breakout backed by sustained volume could signal the start of a fresh bullish leg. Traders might view this as an attractive setup for medium-term gains, especially once the wedge pattern fully completes and buying momentum begins to accelerate.
✅ Show your support by hitting the like button and
✅ Leaving a comment below! (What is your opinion about this Coin)
Your feedback and engagement keep me inspired to share more insightful market analysis with you!
Open

OPEN: Bull-Flag Breakout + Turnaround Play (No Reverse Split)1. Fundamentals (The Narrative)
The "Survival" Pivot: Opendoor successfully navigated the existential "iBuying Winter." The rally from ~$2.00 to ~$8.00 in H2 2025 was organic (no reverse split), driven by a shift to aggressive cost-cutting and risk management.
Smart Money & Momentum: The stock is supported by a mix of institutional positioning (e.g., reported stakes by major funds) and retail sentiment treating it as a high-beta recovery play.
Financials: While revenue contracted significantly (approx. -34% YoY in recent reports) as volumes were deliberately reduced, the cash burn rate has decelerated. The goal is Adjusted Net Income Breakeven by late 2026. The stock trades near Book Value, offering a floor against insolvency fears.
2. Technicals (The Setup)
Pattern: Classic Bull Flag / Falling Wedge consolidation on the Weekly timeframe following a massive >400% impulse move.
Trend: Primary uptrend remains intact. Consolidation is holding above critical EMAs (10W & 20W).
Trigger: A weekly close above $7.15 - $7.25 activates the flag breakout.
Indicators: RSI has cooled from "overbought" to ~50 (neutral), clearing room for the next momentum leg.
Sell Targets & Strategy (6 - 12 Months)
For a holding period of 6 to 12 months (Swing to Position Trade), use a two-zone exit strategy to lock in profits and manage risk.
Zone 1: The "Conservative" Target (Take Profit 1)
Price Target: $8.00 - $8.50
Rationale: This is the November 2025 high and aligns with conservative analyst targets (e.g., JPMorgan). Many "bagholders" and short-term traders will exit here.
Action: Sell 50% of the position here to de-risk the trade (making the rest a "free roll").
Zone 2: The "Technical" Target (Take Profit 2) - as indicated in the chart
Price Target: $12.50 - $13.00
Rationale: This is the "Measured Move" projection of the flag. Adding the height of the "flagpole" (the move from $2 to $8 = $6 run) to the breakout point (~$7) gives a target of ~$13. This also coincides with a historical resistance cluster from 2022/2023.
Condition: This target requires a supportive macro environment (Fed rate cuts in 2026) and improving margins in Q1/Q2 2026.
Invalidation (Stop Loss):
Level: Weekly close below $5.70.
Rationale: If this level breaks, the Bull Flag structure has failed, and the trend is invalidated.

$OPEN Why Caution is Warranted Despite Strategic ShiftsOpendoor's Meteoric Rise Faces a Reality Check: Why Caution is Warranted Despite Strategic Shifts
Opendoor Technologies (OPEN) is capturing headlines with a remarkable stock surge of 294% in 2025, driven by a radical strategic pivot under new CEO Kaz Nejatian. The company is aggressively shifting from a traditional "house flipper" model to a technology-powered, high-velocity transaction platform. By leveraging AI to slash home assessment times and streamline operations, Opendoor has nearly doubled its weekly acquisition rate while cutting costs dramatically. Management's bold path to profitability by late 2026 and Nejatian's proven track record from Shopify have fueled investor optimism, suggesting the recent rally may have further room to run.
However, beneath this compelling narrative of transformation lie persistent and significant risks that threaten to undermine its progress. A closer examination of the fundamentals reveals several red flags that suggest the stock's explosive gains may be premature, exposing investors to substantial downside from current levels.
Three Core Vulnerabilities Threatening the "Opendoor 2.0" Story
The Critical Demand Shortfall: Falling Volume Amidst Rising Acquisitions
While Opendoor touts accelerated home acquisitions, the most telling metric—homes actually sold—paints a concerning picture. In its latest quarter, the company sold only 2,568 homes, continuing a two-year trend of average annual declines of 16.2%. This divergence between buying and selling implies either weak end-market demand, increasing competition, or potential inventory mismatches. For a business whose new model relies on "flow and speed," an inability to monetize acquisitions rapidly creates a fundamental bottleneck. To move this stagnant volume, Opendoor may be forced to lower prices or increase marketing spend, both of which would directly compress margins and hinder the very profitability it seeks.
A Looming Cash Flow Crisis
Ultimately, sustainable businesses are built on cash flow, not just accounting adjustments or strategic visions. Analysts project a alarming reversal for Opendoor: its free cash flow margin, a healthy 18.8% over the past year, is expected to plummet to negative 3.6% in the coming year. This transition from cash generation to cash consumption is a critical warning sign. It indicates that the costs of funding inventory, technology investments, and operations are likely to outpace the cash earned from sales. For a company in a capital-intensive industry, a burning cash furnace is a direct threat to its operational autonomy and survival.
A Precarious Financial Structure: Debt, Losses, and Restricted Options
Opendoor's balance sheet compounds its operational risks. The company carries a substantial $1.79 billion in debt against $962 million in cash, a concerning ratio for any firm, but particularly one reporting deeply negative EBITDA of -$89 million over the last twelve months. This combination of high debt and persistent losses is a classic danger zone. It raises the specter of insolvency if market conditions deteriorate and limits the company's ability to secure additional financing on favorable terms. Should credit agencies downgrade its debt, the cost of capital would rise sharply, creating a vicious cycle that could strangle growth and force the company into distress sales of assets.
Technical Levels Highlight the Severe Downside Risk
The fundamental vulnerabilities are mirrored in the stock's technical risk profile. From its current price near $6.50, the downside appears significantly larger than the immediate upside. Two critical support zones loom far below:
The First Support Zone at $3.00: This level represents a decline of over 50% from current prices and would likely correspond to a market reassessment of the company's growth premium as execution challenges mount.
The Second Support Zone at $2.00: A fall to this area, a drop of nearly 70%, would indicate a severe breakdown in investor confidence, potentially triggered by a quarterly cash burn worse than feared or a deterioration in the housing market.
The Danger Zone at $1.00: This level is critical; breaching it would signal existential threats to the business model and raise serious questions about the company's long-term viability as a going concern.
Final Judgment: Spectating, Not Participating
While we applaud Opendoor's innovative ambitions and serve-as-you-go model, the investment case at this juncture is fraught with asymmetry skewed toward risk. The stock's forward price-to-sales ratio of 1.1x may appear modest, but it prices in a future of profitable, high-velocity execution that the current fundamentals—declining sales volume, impending cash burn, and a leveraged balance sheet—do not yet support.
The potential upside from a flawless execution of "Opendoor 2.0" is now overshadowed by the very real possibility of a steep decline toward the $3.00 or even $2.00 support zones if operational or macroeconomic headwinds intensify. Given the combination of cyclical market exposure, high execution risk, and a precarious financial foundation, we believe the prudent action is to cheer for Opendoor's transformation from the sidelines, rather than expose a portfolio to its volatile and uncertain path forward.

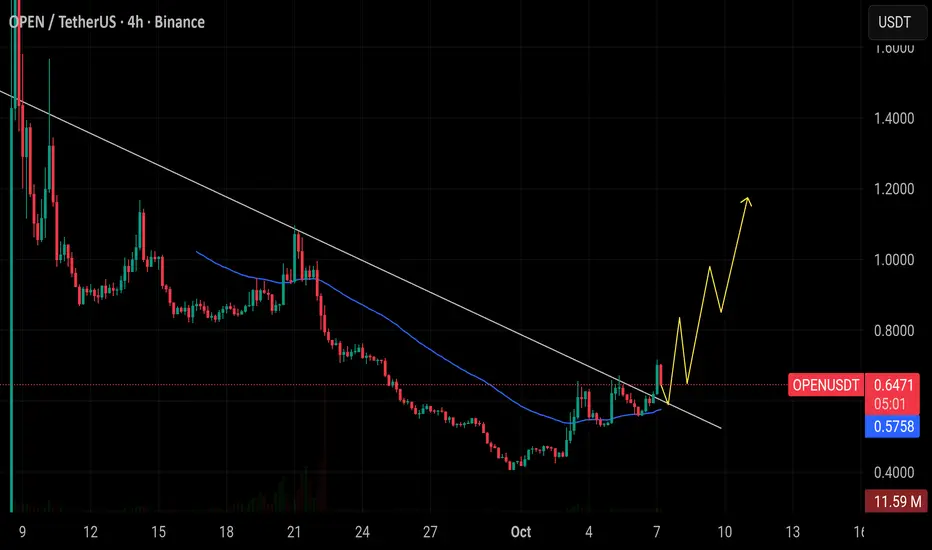
#OPEN/USDT Bulls are back on $OPEN#OPEN
The price is moving in a descending channel on the 1-hour timeframe. It has reached the lower boundary and is heading towards breaking above it, with a retest of the upper boundary expected.
We have a downtrend on the RSI indicator, which has reached near the lower boundary, and an upward rebound is expected.
There is a key support zone in green at 0.2207. The price has bounced from this zone multiple times and is expected to bounce again.
We have a trend towards consolidation above the 100-period moving average, as we are moving close to it, which supports the upward move.
Entry price: 0.2300
First target: 0.2361
Second target: 0.2432
Third target: 0.2530
Don't forget a simple principle: money management.
Place your stop-loss order below the support zone in green.
For any questions, please leave a comment.
Thank you.

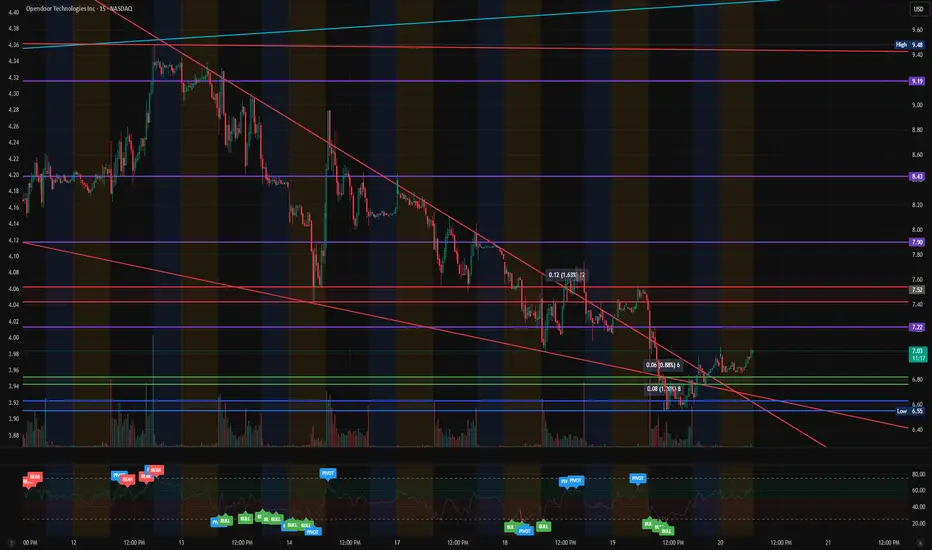
$OPEN – Breakdown + Reversal WatchNASDAQ:OPEN is showing the first meaningful signs of a potential trend reversal after weeks of controlled selling. Price has finally pushed back above the micro-range and is attempting to reclaim the $7.00 zone, which marks the beginning of a structural pivot on the 15-minute chart.
We’ve now seen a Break of Structure (BOS), early CHoCH signals, rising volume, and the EMAs beginning to curl upward — all classic signatures of a bearish cycle ending and a bullish cycle beginning.
If buyers continue stepping in, this move has room to expand.
Technical Overview
Support Levels:
$6.70
$6.55 (major demand + must hold)
$6.40
Resistance Levels:
$7.22 (first reaction level)
$7.52 (EMA cluster + supply zone)
$7.90 (strong high)
$8.43
$9.19
$9.48 (full structure flip level)
Structure:
Multi-day downtrend channel still intact, but breaking
Fresh BOS + multiple CHoCH signals
EMAs compressing and curling upwards
Micro higher-low formed at $6.55
Momentum:
RSI rising from oversold levels
Volume rotation from distribution → accumulation
Buyers stepping in aggressively at the lows
Trend Bias:
Bullish above $7.00
Strongly bullish above $7.22
As long as NASDAQ:OPEN holds above $6.55, this reversal structure remains valid.
A confirmed breakout above $7.22 opens the door to $7.52 → $7.90 → $8.43, with broader reversal potential toward $9.19–$9.48.
A breakdown below $6.55 invalidates the setup.
Sector Context
Opendoor continues to trade as a high-beta real estate tech play with strong correlation to mortgage rate volatility and risk-on sentiment. When risk rotates back into mid-cap growth, NASDAQ:OPEN historically shows outsized percentage moves — which aligns with the early reversal signals showing up on the chart now.
💡 My Plan
Entry Zone: $6.70–$7.05 (only on strength)
Targets: $7.52 → $7.90 → $8.43
Stretch Target: $9.19 → $9.48
Invalidation: Close below $6.55
NASDAQ:OPEN is showing early reversal behavior after a prolonged down move. If buyers maintain control above $7.00, this could be the beginning of a larger trend shift into December.
Drop your thoughts ⬇️ and I’ll post a MyMI follow-up with updated price targets. NASDAQ:PLTR NASDAQ:SOFI $Z NYSE:CVNA
$OPENExecutive Summary: A potentially bullish technical pattern, the Bull Flag, is forming on the chart of OpenDoor Technologies ( NASDAQ:OPEN ). This pattern suggests a continuation of the prior upward move is likely, with a defined breakout target. However, this optimistic technical outlook is heavily tempered by a significant near-term event: a stock split scheduled for Tuesday, the 18th. This event introduces substantial volatility risk that must be factored into any trading decision.
1. The Pattern: Bull Flag Formation
The price action of NASDAQ:OPEN is currently consolidating within what technical analysts classify as a Bull Flag pattern. This pattern is characterized by a sharp upward move (the "flagpole") followed by a period of sideways or slightly downward-sloping consolidation (the "flag"). Bull Flags are typically interpreted as a pause in the market before the prior uptrend resumes. The pattern is inherently bullish, suggesting that buyers are gathering strength for another potential leg up.
2. Critical Support Zones
For the Bull Flag pattern to remain valid, the price must hold above key support levels during its consolidation phase. Two crucial support zones have been identified:
Primary Support Zone: $4.00 - This is the higher of the two zones and likely represents the lower boundary of the flag pattern. A hold here keeps the breakout structure perfectly intact.
Secondary Support Zone: $3.00 - This is a stronger, more significant support level. A drop to this level would represent a deeper pullback within the flag but would not necessarily invalidate the broader pattern as long as it holds.
3. Projected Target and Breakout Condition
The measured move of a Bull Flag pattern provides a potential price target.
Breakout Condition: A confirmed breakout above the upper trendline of the flag pattern is required to trigger the bullish signal.
Projected Target: $10.00 - This target is derived by measuring the length of the initial flagpole and projecting that distance upward from the point of breakout. Reaching this target would signify a full realization of the pattern's potential.
4. The Critical Overlay: Stock Split Event on Tuesday, 18th
Extreme caution is advised. The technical setup is occurring directly alongside a scheduled stock split. Stock splits often cause unpredictable price volatility and unusual trading activity in the days leading up to and following the event. While fundamentally neutral, the event can distort technical patterns and lead to false breakouts or breakdowns.
The pattern's validity may be tested or completely disrupted by the split.
Liquidity and price discovery can become erratic.
It is prudent to wait for the market to absorb the impact of the stock split before placing high conviction on this technical setup.
Conclusion and Strategy:
While NASDAQ:OPEN presents a textbook Bull Flag pattern with a clear path to a $10.00 target upon a confirmed breakout, the immediate outlook is clouded by significant event risk. The stock split on Tuesday, the 18th, is a major variable that could override the technical picture in the short term.
A cautious approach is strongly recommended. Traders should:
Monitor the support zones at $4.00 and $3.00 to see if the pattern holds through the event.
Wait for a confirmed breakout above the flag's trendline after the stock split has occurred and volatility has normalized.
Avoid entering large positions ahead of the event, as the potential for gap moves and unpredictable price action is high.
The technicals suggest bullish potential, but the fundamental calendar demands patience and risk management.

OPEN | This Will Rip MUCH Higher | LONGOpendoor Technologies, Inc. engages in the operation of buying, selling, and trading of residential properties online. The company was founded by Eric Wu on December 30, 2013, and is headquartered in Tempe, AZ.

$OPEN – 50 SMA Retest with Trendline Breakout TriggerOpendoor Technologies ( NASDAQ:OPEN ) is setting up for a trendline breakout right as it tests the 50 SMA — a perfect technical spot for dip buyers to step in after a massive run.
🔹 The Setup:
After a strong multi-month rally, NASDAQ:OPEN finally pulled back into the 50 SMA, the first real test of trend support in this cycle.
Price is coiling just under a descending trendline, with an $8.50 trigger marking the breakout zone.
The consolidation is clean, volume is light, and momentum could reload quickly if the market stays hot.
🔹 Market Context:
The broader market is at all-time highs, and NASDAQ:OPEN has been one of the biggest winners in that run.
This pullback looks natural and healthy, not distributional.
Often, the first touch of the 50 SMA after a big run is where institutional buyers step back in.
🔹 My Trade Plan:
1️⃣ Entry: Watching for a breakout through $8.50 with volume confirmation.
2️⃣ Add: On strength above that level or retest of the breakout zone.
3️⃣ Stop: Below the 50 SMA — tight, well-defined risk.
Why I Like This Setup:
Trendline break + 50 SMA retest = classic continuation setup.
Big winner resting while the market is strong = ideal timing for a reload.
Risk is clean, structure is tight, and breakout potential is strong.
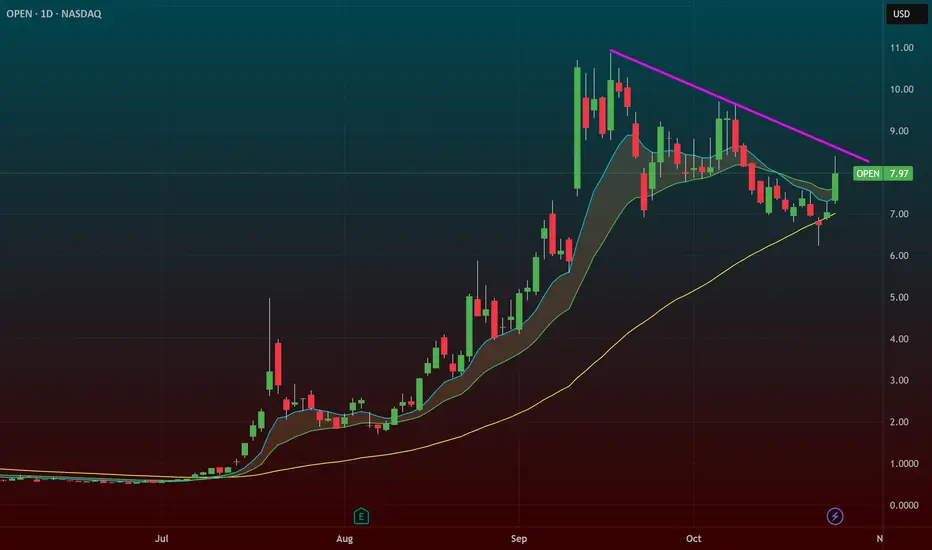
OPEN 1D - Flag Ready for Takeoff?On the daily chart, Opendoor Technologies (OPEN) is forming a clean bullish flag - a consolidation phase following a massive +400% rally since spring 2025. Price action remains tightly contained within the pattern, with strong support from the MA50 and the 6.3–7.4 buy zone, aligning with the 0.618 Fibonacci retracement.
Technically , the setup looks mature: MA50 is trending upward, MA200 sits far below, and volume contraction hints at a breakout ahead. The first target sits at $16.50 (1.618 extension), while the second target lies at $25.60 (2.618 extension) - a potential +200% move from current levels.
Fundamentally, Opendoor is finally emerging from its downturn:
– +37% YoY growth in property transactions;
– operating costs reduced by ~25%;
– positive operating cash flow for the first time in three years;
– partnerships with Zillow and Redfin driving stronger customer acquisition.
With the U.S. housing market showing signs of recovery and potential Fed rate cuts on the horizon, OPEN stands out as a high-upside play in the proptech sector.
Tactical plan: watch for accumulation near 6.3–7.4, add on breakout confirmation. Profit targets: 16.5 → 25.6.
After all, in both trading and real estate - it’s all about timing and location.

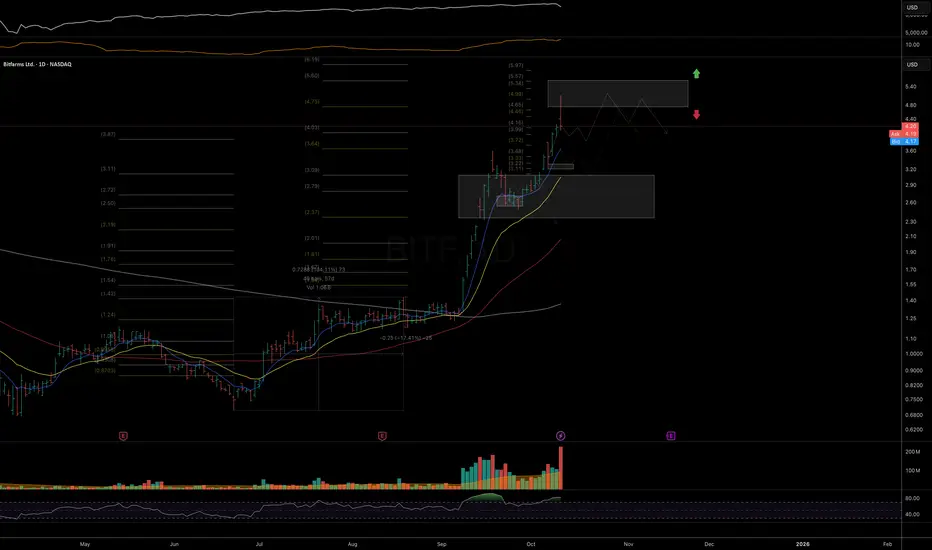
DIA enters breakdown trendDIA has officially entered a breakdown phase after losing its key short-term structure and falling back into the breakdown volume zone.
The sharp rejection from the $0.86 level triggered heavy selling pressure, confirming a shift in short-term trend momentum.
📉 Current outlook:
Price is now consolidating between $0.60 – $0.38 within the breakdown range.
Volume is elevated, suggesting distribution rather than accumulation.
Unless DIA reclaims $0.65+, the trend remains bearish.
📊 Observation:
This move resembles a post-hype correction where early buyers exit and liquidity thins out.
The next key level to monitor for reaction sits near $0.38 support — a potential short-term base if selling slows down.
💬 Summary:
DIA is currently trading in a breakdown trend, with risk leaning to the downside until structure rebuilds above $0.65.

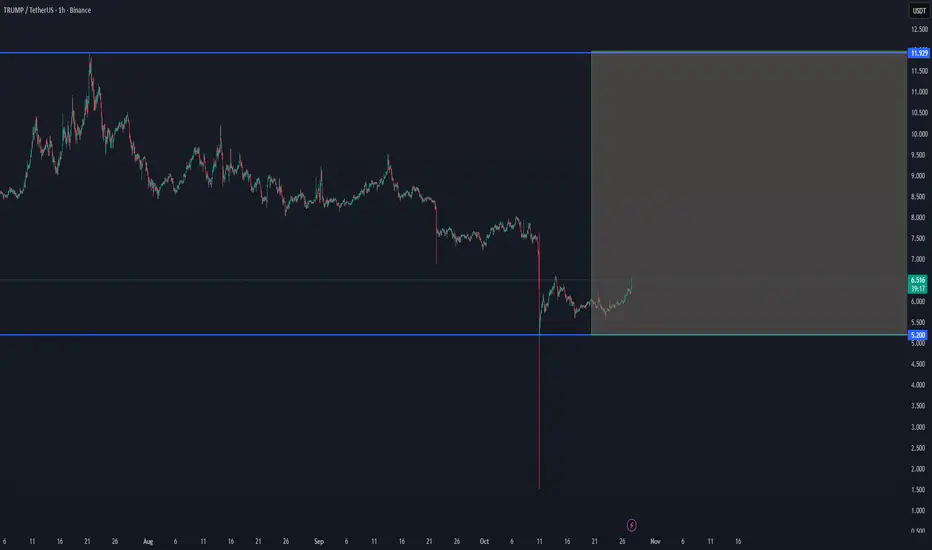
TRUMP/USDT — Reversal Signs After Deep CorrectionTRUMP/USDT — Reversal Signs After Deep Correction ⚡
After a heavy decline, TRUMP is showing early recovery signs from the $5.20 support zone.
If momentum continues, a push toward the $11.90 resistance range could form a short-term bounce setup.
📊 Support: $5.20
📈 Upside Target Zone: $11.90
OPENUSDT Forming Falling WedgeOPENUSDT is showing a strong falling wedge pattern, one of the most powerful bullish reversal signals in technical analysis. This pattern forms when price action compresses between two downward-sloping trendlines, indicating decreasing selling pressure and a potential shift in market sentiment. The pair’s good trading volume adds strength to this setup, suggesting that accumulation is underway and that a major breakout could be close. Once price breaks above the wedge resistance with confirmation, OPENUSDT could experience a powerful upward surge.
Currently, technical indicators such as RSI and MACD are hinting at bullish divergence, supporting the case for a significant rebound. The falling wedge typically resolves with an explosive upside move, and in this case, the expected gain of 390% to 400% highlights the strong upside potential. Such a massive projection points to increased investor confidence and renewed interest in the project’s fundamentals and long-term vision.
Market participants are beginning to recognize OPENUSDT as a high-upside opportunity within the current market cycle. Growing investor interest often precedes major rallies, especially when the technical structure is this favorable. If buying momentum continues to build and volume supports the breakout, this could lead to a new trend reversal, pushing the price toward fresh highs and attracting more traders into the move.
✅ Show your support by hitting the like button and
✅ Leaving a comment below! (What is You opinion about this Coin)
Your feedback and engagement keep me inspired to share more insightful market analysis with you!

OPENUSDT UPDATE#OPEN
UPDATE
OPEN Technical Setup
Pattern: Bullish falling wedge breakout
Current Price: $0.399
Target Price: $0.638
Target % Gain: 192.24%
NASDAQ:OPEN is breaking out of a falling wedge pattern on the 1D timeframe. With the current price at $0.399, the projected target is $0.638 — indicating a potential upside of nearly 192%. This breakout suggests a possible shift in momentum favoring bulls and a move toward higher levels.
Time Frame: 1D
Risk Management Tip: Always use proper risk management.

$OPEN: approaching key support zone NASDAQ:OPEN one more leg lower toward the 6.60–5.95 zone would be ideal to complete the structure, but I’m watching for signs of an upside reversal soon.
Chart:
Previously on downside potential (Oct 8):
Watching a potential short setup on a break below today’s low; first attempt may fail, but a clean break could flush toward 6.60–5.95 before a reversal higher. Persistent supply on the break-out attempts suggests a seller is unloading; a shake-out into the 50DMA also fits the current macro structure before any sustainable turn.
Chart (Oct 8):

$OPEN — 10W MA Pullback, Breakout SetupWeekly chart looks constructive — NASDAQ:OPEN has pulled back to the 10-week MA on lighter volume after a strong prior run. The weekly structure remains intact despite a ~36% pullback, and volume has been drying up, indicating normal consolidation.
A strong-volume breakout through the short-term downtrend could confirm a trend resumption and signal the next leg higher.
I’ll turn cautious if heavy selling volume appears and price breaks below $6.90 — that would invalidate the setup for now.

Weekly Chart Review | Oct 6-10, 2025I wasn’t able to post my analysis on TradingView last week, so here’s a structured summary of my ticker reviews from Oct 6–10, segmented by sector with brief commentary. Each includes an update on trend structure and a link to both the original chart and the latest revision as of Friday’s close.
Technology
NASDAQ:AMD – Clean follow-through off mid-term support into the upper band of resistance. Strong rejection increases the odds that a mid-term top for the uptrend since April is being formed. Any lower-high formation next week should be approached with caution.
Chart:
Previously:
• Upside potential to resistance (Oct 7):
• Downside potential:
• On resistance & bounce potential (Aug 6):
• On macro resistance (Jul 29):
• On macro bottoming potential (Apr):
NASDAQ:NVTS – Followed the Aug–Sep setup and delivered a strong breakout Friday, but late-day reversal increases the odds of a longer consolidation into 7.80–6.80 support.
Chart:
Previously:
• Breakout and local support (Oct 10):
• Consolidation and upside potential (Sep 30):
• Higher-low potential (Sep 26):
• Mid-term support (Aug 25): www.tradingview.com
NASDAQ:MRVL – Reached the key mid-term resistance zone outlined earlier. Friday’s rejection increases odds of a pullback into 80–72 support over the coming weeks.
Chart:
Previously:
• On mid-term top (Oct 10):
• On resistance zone (Oct 2): www.tradingview.com
NASDAQ:WDC – Orderly follow-through to the downside into the 21 EMA.
Chart:
Previously: downside potential to 21 EMA –
NYSE:RBLX – Rejected at local resistance, aligning with the downside structure.
Chart:
Previously: downside potential (Oct 8):
NASDAQ:REKR – Shows strong relative strength with steady consolidation at support; constructive base-building continues.
Chart:
Previously: follow-through and support (Oct 7):
NYSE:AI – Friday breakout attempt faded back into support, increasing odds of prolonged base-building and a potential deeper pullback to 17–16.
Chart:
Previously:
On continuation potential (Oct 8):
NYSE:BB – Failed on immediate continuation and returned to support.
Chart:
Previously:
On continuation potential (Oct 8):
NASDAQ:OPEN – Constructive consolidation stalled as failed breakouts shifted odds toward a deeper pullback into mid-term support.
Chart:
⸻
Blockchain
NASDAQ:BITF – Tagged the ideal macro resistance zone; odds rise for at least a mid-term top/base formation here.
Chart:
Previously:
On upside continuation (Oct 7):
NASDAQ:HIVE – Rejection at the top of mid-term resistance; probabilities favor the start of a reversal phase.
Chart:
Previously:
On macro resistance (Oct 6):
On more immediate upside potential (Sep 24): www.tradingview.com
•On bullish potential (Sep 10): www.tradingview.com
• On bullish trend structure (Jul 21): www.tradingview.com
NYSE:BKKT – No follow-through on continuation setup, but key local support still holds; structure remains intact while above it.
Chart:
Previously:
On continuation (Oct 9):
NASDAQ:BULL – Rotating back toward macro support near 11; monitoring for higher-low formation and reversal trigger.
Chart:
Previously:
On reversal and macro support (Oct 8):
On immediate bullish potential (Sep 26): www.tradingview.com
• On macro support (Sep 19): www.tradingview.com
• On macro support (Sep 4): www.tradingview.com
• On mid-term resistance (Aug 6): www.tradingview.com
• On support and bounce potential (Jul 30): www.tradingview.com
NASDAQ:BTM – Bullish setup invalidated by breakdown into mid-term support.
Chart:
Previously:
On bullish follow-through if LOD holds (Oct 6):
⸻
Biotechnology / Healthcare
NASDAQ:VKTX – Strong follow-through from September update; watching for consolidation back into key EMAs to reset momentum.
Chart:
Previously:
On follow-through (Oct 6):
• On break-out potential (Sep 30): www.tradingview.com
• On resistance zone (Aug 11): www.tradingview.com
• On upside momentum continuation (Jul 18): www.tradingview.com
• Original setup (Jun 30): www.tradingview.com
• Follow-up (Jul 8): www.tradingview.com
NASDAQ:NTLA – Clean follow-through into mid-term resistance; rising odds for a topping/base formation.
Chart:
Previously:
On break-out to resistance zone (Oct 8):
On support and bullish trend-structure (Sep 26): www.tradingview.com
NASDAQ:PGEN – Couldn’t stage a recovery yet but remains within mid-term support; stabilization needed for a constructive setup.
Chart:
Previously:
On potential reversal (Oct 8):
On mid-term support (Sep 15): www.tradingview.com
NASDAQ:ABCL – Momentum attempt resumed but failed to follow-through; still constructive above 21 EMA.
Chart:
Previously:
On local support and continuation potential (Oct 8):
On support and bullish trend-structure (Oct 7):
⸻
Energy
AMEX:GTE – Impulsive advance at risk of morphing into a diagonal correction; elevated probability of retesting September higher lows.
Chart:
Previously:
On constructive looking consolidation (Oct 6):
⸻
Miscellaneous / Other
NASDAQ:SLDP – Rising risk of a local top after Friday’s distribution; while above 21 EMA, a final push into resistance remains possible.
Chart:
Previously:
On follow-through and resistance zone (Oct 6):
On mid-term support and bullish potential (Sep 19): www.tradingview.com
NASDAQ:DPRO – Solid 2.5-day follow-through from the Oct update; Friday’s action suggests increased consolidation or reversal risk.
Chart:
Previously:
On local support and continuation (Oct 7):
NASDAQ:DLO – Disappointing fade after a promising start; must hold above 50-DMA to reassert upside momentum.
Chart:
Previously:
On break-out potential (Oct 8):
On pullback potential (Sep 22): www.tradingview.com
• On downside potential and support (Sep 3): www.tradingview.com
Thank you for your attention and have a great start of the week!
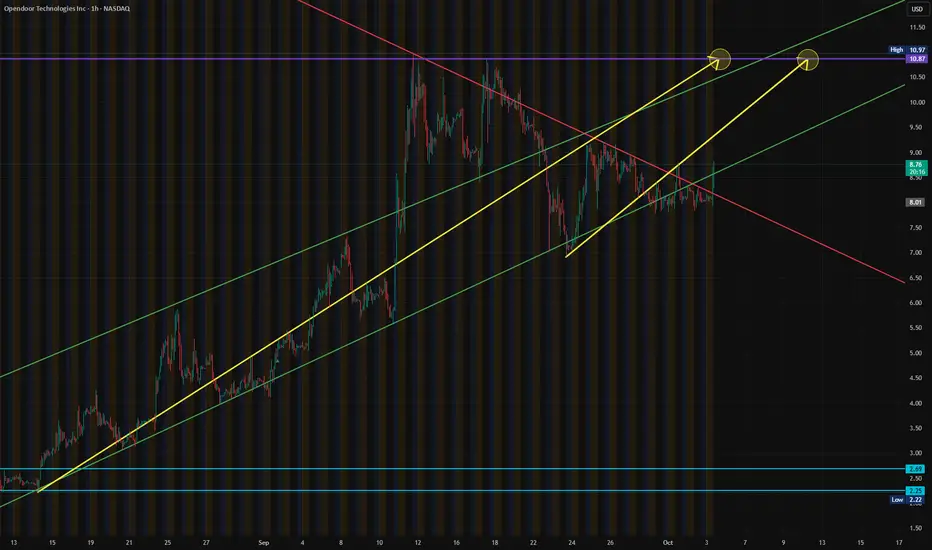
$OPEN - OpenDoor Tech - $9.69 Retest - $10.87 PT🧠 Technical Overview
Ticker: NASDAQ:OPEN (Opendoor Technologies Inc.)
Timeframes: 15-min & 4-hour combo
Current Price: ~$9.30
Trend Summary:
Strong bounce from $8.10 base with two clean BOS (break of structure) signals.
Retested and held $9.19 intraday; momentum candle formed near close.
Channel projection (yellow) shows potential path toward $10.87 → $10.97 short-term.
Volume uptick confirms accumulation — buyers stepping back in.
Key supports: $8.43 / $8.10
Analysis Overview:
NASDAQ:OPEN (Opendoor) is back in motion!
After reclaiming $9.00 support and breaking its short-term structure, the chart shows a clean path toward $10.87–$11.00.
Volume confirms renewed buyer strength after weeks of consolidation near $8.
Watch $9.69 for breakout confirmation — trend remains bullish above $8.43.
#Opendoor #OPEN #NASDAQ #MomentumTrading #RealEstateTech #AIStocks #MyMIWallet

$OPEN has broken its downtrend and is retesting support.NASDAQ:OPEN has broken its downtrend and is retesting support. Holding above 0.57 could trigger a strong move toward 1.20. 🚀
OPENUSDT UPDATE#OPEN
UPDATE
OPEN Technical Setup
Pattern: Bullish falling wedge pattern
Current Price: $0.5617
Target Price: $1.28
Target % Gain: 150.77%
NASDAQ:OPEN is breaking out of a falling wedge pattern on the 4H timeframe. Current price is $0.5617 with a target near $1.28, indicating around 150% potential upside. The breakout highlights strong bullish momentum with price structure supporting continuation. Always use proper risk management.
Time Frame: 4H
Risk Management Tip: Always use proper risk management.

OPENUSDT Forming Falling WedgeOPENUSDT is currently forming a strong falling wedge pattern on the daily chart, a setup that often indicates a major bullish reversal. After an extended downtrend, the narrowing price action within the wedge shows that selling pressure is fading and accumulation is taking place. This structure, combined with healthy volume activity, suggests that a breakout to the upside could soon trigger a significant price movement. The chart’s tightening range reflects growing investor anticipation and an imminent volatility expansion.
The technical outlook points to a potential gain of around 390% to 400%+ once the breakout is confirmed. Such a strong upside target highlights the strength of this bullish setup and aligns with historical wedge breakout behavior in altcoins with rising interest. Increasing volume adds to the confidence, implying strong participation from both retail and institutional traders preparing for a possible surge.
OPENUSDT is starting to attract attention across the market due to its technical alignment with bullish reversal patterns. As investor sentiment shifts from cautious to optimistic, this pair could emerge as one of the high-performing assets in the coming weeks. Traders should watch closely for confirmation candles above resistance to validate the breakout and sustain the bullish trend.
✅ Show your support by hitting the like button and
✅ Leaving a comment below! (What is You opinion about this Coin)
Your feedback and engagement keep me inspired to share more insightful market analysis with you!
OPENUSDT Forming Falling WedgeOPENUSDT is showing a classic falling wedge pattern, a bullish reversal setup that often signals the end of a downtrend and the start of a strong rally. The pattern has been forming with steady consolidation, and with good volume support, there is a strong possibility of a breakout to the upside. Falling wedges are historically known for explosive moves once price breaks resistance, making this setup very attractive for traders.
Market momentum indicates that OPENUSDT could potentially deliver a massive gain of around 390% to 400% if the breakout fully plays out. Such a target aligns with past wedge breakouts in similar altcoins, where prices surged significantly once buying pressure overtook seller dominance. The increasing volume further validates that investors are already positioning themselves ahead of a possible rally.
Investor sentiment is shifting positively toward this project, with more traders recognizing its long-term potential. As accumulation builds around the wedge’s lower boundary, it suggests that smart money is entering before the big move. If OPENUSDT sustains this momentum, the next bullish phase could create a powerful trend that attracts even more market participants.
✅ Show your support by hitting the like button and
✅ Leaving a comment below! (What is You opinion about this Coin)
Your feedback and engagement keep me inspired to share more insightful market analysis with you!

$OPEN - Opendoor Tech - $9.20 RT / $9.80 PT NASDAQ:OPEN broke it's consolidation trend since reaching $10.97 in early Sept. We initially had a $7.95 PT which it exploded past and has since consolidated to retest the $9.20 Level of Resistance, pushing on to retest our $9.80 PT.
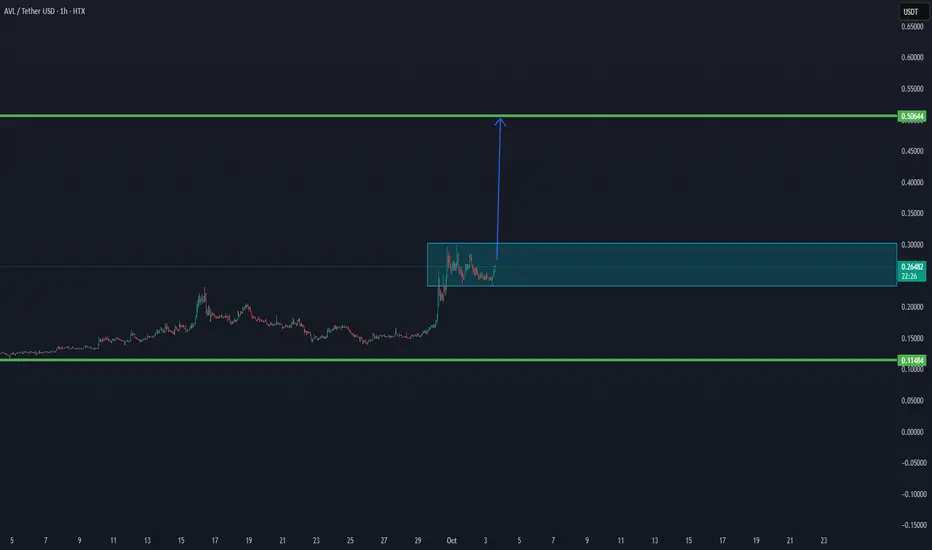
AVL/USDT IS ABLE TO BREAK IN THE COMING TIME TO $0,50✅ AVL has confirmed above both the low time frame and the main trend, showing strong bullish structure.
📈 With this setup, the chart is signaling a potential continuation move toward the $0.50 zone – the next major resistance.
Current support zone is holding well, which adds strength to the bullish case.
As long as AVL stays above the trend confirmations, momentum remains in favor of a breakout.
⚡ Outlook: Structure is positive, and upside potential toward $0.50 is active.