Buy FTSE 100 Index London open & breakoutPrice here is moving in a good Uptrend. MACD ZERO LAG is so bullish . From 11:30am London open Long trade might be a, good for the Aussie currency. we seem to recover better.
Open

OPEN TARGETS!COINEX:OPENUSDT Suggested Signal . . .
You can buy some on the red supports for a profit of 40,000%.
Dont Forget To Follow And Boost!


OPEN - Falling Wedge on the Daily ChartThe price has been fluctuating within a broad range but shows a general downward trajectory as indicated by FALLING WEDGE. There's a noticeable struggle to break above the supply zone, suggesting that any rally towards this zone might be met with selling pressure.

Yearly Bullish OpeningPrice is looking to smash the 78% before retracing back to for HL.
First 6M will smash all buys. And sell really high.
Second 6M will continue its rally but will drop to close bullish above this year OP.
Living half a year at a time.

SOSBreakout could happen soon i have buy order @ $0.00000299 bought some @$0.00000355. Theres posibility it could go lower but its holding its bottom straight. I have a feeling it will might look something like $COPE. I dont have much experience with air drop tokens. I would be cautious.

Market$ CorrelationsICEUS:KC1! Coffee Harvest in Colombia starts in October: Colombia is reported to produce 10-15% of the worlds entire coffee supply, the third largest coffee producer in the world! Speculating ICEUS:KC1! will be +MOVING ABOVE $260. I also speculate ICEUS:KC1! will support the Colombian index NASDAQ:NQCOMC to continue above its $726 highs. Lastly I don't see the present correlation between the NASDAQ:NQCOMC and the AMEX:SPY having a negative effect on the US economy; as it pertains to the fears of a USA recession popping up in recent headlines while approaching the Federal Interest rate decision in the days ahead.

bitcoin going upthis is an advance code for tradingview that would tell someone when they sold buy or sell bitcoin based on moving averages, volume and open interest

Bitcoin nearly 1B of Open interest are still trappedBitcoin nearly 1B of Open interest are still trapped
price did 5% drop into VAL at 66k but failed to do a cascade liquidations because too many short sellers were in
at this moment i wait for clear pattern to take a trade

GUMy Zones for GU this week is just some simple supply and demand zones and some liquidity zones. I will be watching orderflow closely when i enter trades since we begin to slow down a bit in price action and are in a range. I will be using the daily and weekly open as extra confluence as usual for my day-to-day setups and the zones for a Wyckoff schematic setup.

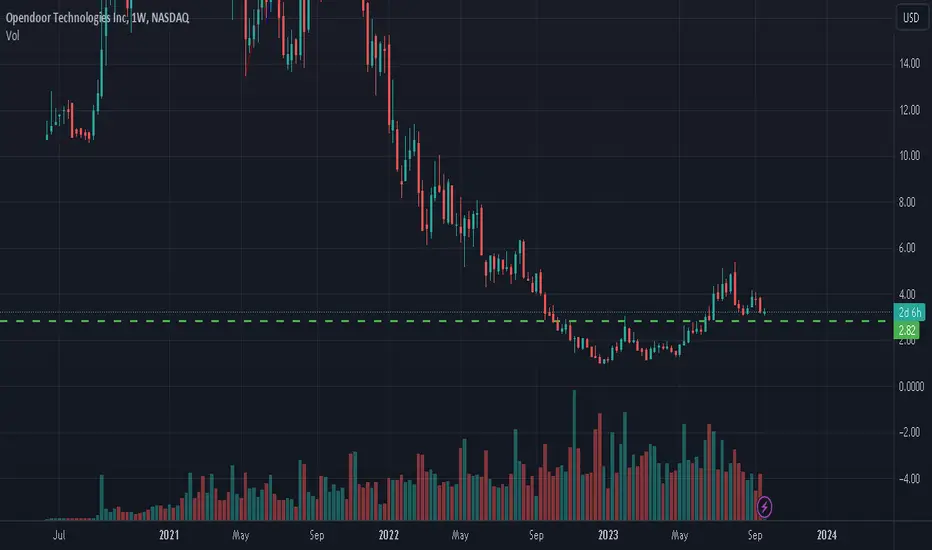
$OPEN Approaching Resistance at $5.30Opendoor Technologies has broken the falling trend channel in the medium long term and reacted strongly up. NASDAQ:OPEN is approaching resistance at 5.30 dollar, which may give a negative reaction. However, a break upwards through 5.30 dollar will be a positive signal.
The short term momentum of the stock is strongly positive, This indicates increasing optimism among investors and further price increase for Opendoor Technologies.

OPEN Opendoor Technologies Options Ahead of EarningsAnalyzing the options chain and the chart patterns of OPEN Opendoor Technologies prior to the earnings report this week,
I would consider purchasing the 2usd strike price Calls with
an expiration date of 2023-11-10,
for a premium of approximately $0.20.
If these options prove to be profitable prior to the earnings release, I would sell at least half of them.
Looking forward to read your opinion about it.

OPENDOOR ($3.15) loong idea long near 3.15 and add at 2.85
sl needs to be weekly close below 2.55
small qty only ive taken
Opendoor Technologies entry pursuit As requested by a follower:
Opendoor Technlogies NASDAQ:OPEN
- Currently this is a high risk trade as we are reaching
oversold on the weekly and price is close to
overhead resistance
Positives and entry levels:
- Above 200 day moving average & sloping upwards
- A pull back to 200 day would be an ideal entry
- Break above the OBV resistance line could indicate
further push through
I would not be entering this trade unless we revisited the 200 day or broke through the OBV resistance.
Opendoor is a small $2.68bln market cap company aiming to make selling your home as easy as clicking a few buttons. There are a lot of unknowns in the housing sector however a new CFO was appointed in Dec 2022 and she seems to have the company back on the front foot which is positive. #opendoor
Opendoors mission statement:
Opendoor is an e-commerce platform for residential real estate that allows people to buy, sell and move online. Our vision is to build a one-stop shop that allows people to move with the tap of a button.

OPEN OpenDoor a Penny Real Estate LONGOPEN has earnings upcoming on 8/3. An analysis of the 4H chart with overlays shows
bullish momentum in the set of zero lag EMA lines as well as upgoing anchored VWAP
landlines. Price crossed over the mean VWAP ( thin black) and the POC line of the
volume profile one month ago. The MACD shows bullish momentum since July 24th.
The dual RSI indicator shows the low time frame green line rising and then crossing the
steady higher black time frame line the past trading day and both being at the 60
level.
OPEN is a long trade setup with earnings around the corner. I will take it.

OPEN breaks out. Can it continue?OPEN a disruptive company in the residential real estate sector as shown on the 1H chart has
continued out of a pullback. Is the continuation sustainable? I believe that inflation has
become imbedded into the economy. Banks have survived the crisis with federal support and
action. The Z score and relative trend index are impressive with the present indications.
In an abundance of caution, the mass index is approaching the reversal zone above and could
be somewhat predictive of a potential reversal. Moreover, the anchored VWAP lines with an
origination ten trading days back shows price at three standard deviations above the mean
VWAP. Overall, I believe that I should not enter a long uptrend this far into its extension
when there are signs based on technical indicators. Instead, I will watch for another
pullback or actual retracement.

SNP 500 Corrective Price ActionThe SNP 500 $SPY is in a corrective pattern which in EW is called an open diagonal where each subwave of 1-5 subdivides as either 5-3-5-3-5 or 3-3-3-3-3. In this chart, I've counted the diagonal as 3-3-3-3-3. Currently, the SNP 500 is making a zig-zag in (b) before continuing in five waves down to complete ((v)) of A. Currently expecting the SNP500 to go to around 300 before turning up and beginning the B wave. I don't expect to see any corrective rally's until after mid term elections in the US.

US30Observations and key trade times. Why do people trade session open times? Price is too volatile and you can get the direction wrong more often than not. Waiting for the lull stops any doubts you might have to get in line with the market and its true direction, use it as a confluence almost.

Gold Setup Idea: Pre New York (Sept 27, 2022)Here is my analysis based on price action during the Asia session and London session, it appears we are retracing after making new lows. This means we have a temporary relief of HTF bearish influence and can possibly expect to see some bullish price action today; but it is certainly more risky to buy than to sell gold right now given the current macro economic conditions. I am ultimately looking to sell since I believe there is a higher probability of it succeeding, but if price break london high and shows bullish strength in NY open, forming LTF support above $1640, then buys are certainly possible.
What do you anticipate price to do in NY open/today?

TSLA SHORTTSLA showing bearish divergence on MACD, RSI. Looking at a breakdown when market opens. Bearish pennate will force breakdown to its local low levels

BTC Open InterestsI can see a diamond being formed and potentially a breakout just happened - treating this as a fakeout based on Trend Exhaustion and RSI being totally oversold - Expecting it to go back inside the diamond soon.

OPEN - WAY OVERSOLD - SHARP FALLING WEDGE - ABC CORRETION All,
Open top of watchlist if market turns. Easily could see 17-19 range + IV spikes would be a solid return. Then it will probably vounce down again fade off then go back to mid 20s would be my guess but intial shot here retest of 19ish would be worth watching.

Spy Futures Looking InterestingFutures looking extremely interesting for SPY, especially with BTC breaking under 24 but it isn't Monday morning yet either so we shall only see what BTC sees and maybe the market follows. Think is a good first step in a gap down, however, all planets must align for this move correctly.

#OP/USDT 15M CHART UPDATE !!Welcome to this quick OP/USDT analysis.
I have tried my best to bring the best possible outcome in this chart.
Reason for trade:- OP is trading in an uptrend channel and respecting the support and resistance level. The support is $1.27 area and the major resistance is $1.59-$1.66 area. Try to grab some OP near support level with tight stop loss.$1.24
Remember:-This is not a piece of financial advice. All investment made by me is at my own risk and I am held responsible for my own profit and losses. So, do your own research before investing in this trade.
Sorry for my English it is not my native language.
Do hit the like button if you like it and share your charts in the comments section.
Thank you...
