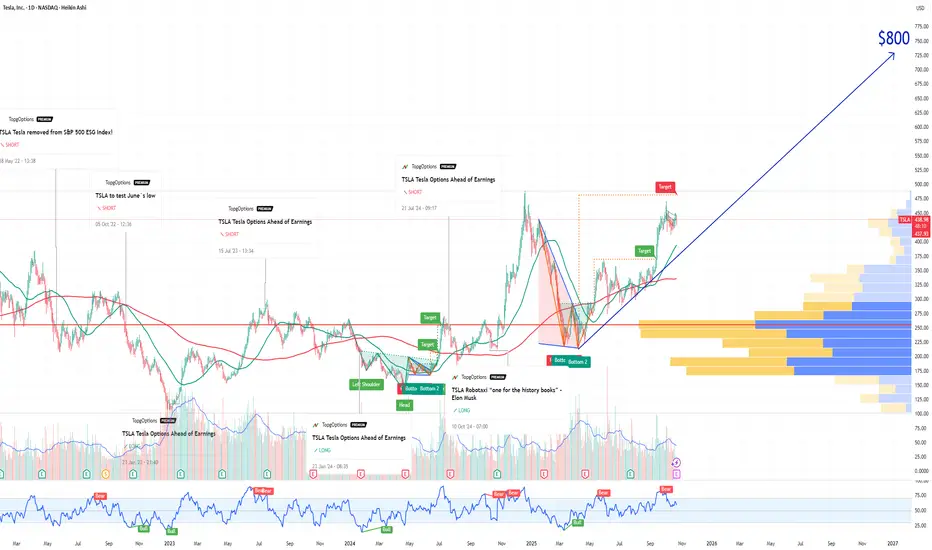
TSLA Tesla Options Ahead of EarningsIf you haven`t bought the dip on TSLA:
Now analyzing the options chain and the chart patterns of TSLA Tesla prior to the earnings report this week,
I would consider purchasing the 800usd strike price Calls with
an expiration date of 2027-1-15,
for a premium of approximately $40.30.
If these options prove to be profitable prior to the earnings release, I would sell at least half of them.
Option
Credit Put Spread: AKROLowest TP by analyst is $49. 200 SMA at $43.45.
Credit Spread Put 42.50/40 expiring 17-Oct
ALong

The Options Mirage: The Jackpot That’s Rigged Against YouMost retail traders fall in love with options because they seem to offer the impossible: with just a few hundred dollars you can dream of outsized returns. Fast money, easy money—at least that’s the story. With the right broker account and a handful of trades, the dream of becoming rich feels just around the corner.
What you’re not told—and what few truly understand given the complexity of the product—is that the “explosive payout” is not an opportunity. It’s a price. A very high one. And often inflated by the industry itself, knowing that the average investor (or rather, gambler) has no real way to calculate what they’re actually paying for. What you’re really buying is access to an extremely low probability of success, dressed up as a sophisticated strategy.
Yes, it’s the same psychology that drives lotteries and sports betting. And in finance, the odds aren’t any kinder.
The Baseline: the Where
At its simplest, speculation is about anticipating an up or down move in price.
Think it’s going up? Buy and aim to sell higher.
Think it’s going down? Sell and aim to buy back lower.
It sounds simple, but anyone with more than a month of trading experience can tell you it’s anything but. No one can predict the future with certainty. Still, this is at least a binary game: two mutually exclusive outcomes, like flipping a coin.
In technical terms, the market starts as a 50/50 distribution. With skill, analysis, and discipline, you might bias those odds slightly—say, 60/40 in your favor. That bias, repeated consistently, is what we call an edge. And with an edge, the path to long-term success is paved.
The Illusion of Acceleration
But let’s be honest: who wants to grind out a 60/40 edge slowly? We’re here for the Lamborghini, right? And the sooner the better.
That’s where the industry steps in with its “solution”: options. The promise is seductive—leverage the process, accelerate the outcome. With little money down, you can aim for massive returns. What’s not to like?
The problem is that the acceleration doesn’t come for free. To deliver those explosive payouts, the game adds layers of complexity.
From Where… to How and When
In options, you don’t just need to be right about where price is going.
You also need to be right about how it moves. That’s volatility—the speed and amplitude of the move. Even if you guess the direction correctly, if the move isn’t strong enough to beat strike + premium, you lose.
And then comes the when. Options expire. Time works against you. With the rise of 0DTE options, this window has shrunk to a single day. You might be perfectly right on direction and volatility—but if it happens tomorrow instead of today, your trade is worthless.
Now here’s the key point: this isn’t additive complexity. It’s multiplicative. Each layer collapses your probability of success exponentially. Even though the mathematical proof could be enlightening, I have promised not to use heavy math in this blog. All you need to know is this: in the majority of cases, that collapse in probability is not evenly compensated by the outsized payout. And this is exactly what most retail traders fail to perceive.
It’s not just that you’re playing a harder game—it’s that you’re playing a biased one, where the odds are stacked even further against you.
The Lottery Bias: The Cognitive Trap
Here’s where psychology plays its cruelest trick. The lower the probability of success, the higher the payout offered. In fact, it’s not even the full payout you deserve—it’s a discounted, haircut payout, cleverly packaged so you don’t notice because the potential number is so large. And that number lights up the brain like a jackpot.
The industry knows this. It builds its business on the fact that humans systematically overestimate tiny probabilities and underestimate the certainty of losing. Retail traders convince themselves they’re being clever: risking little for the chance at something huge. But the math is merciless—the expected value is brutally negative.
The market is not handing you an edge. It’s dismantling any possibility you had of one. That giant payout you see? It’s not a gift—it’s a warning label.
And yes, I know you can point to stories about the guy who hit the jackpot, who “proved the math wrong.” But let me ask you this: do you know what survivorship bias is? If you don’t, and you’re trading options, here’s some professional advice for free—go and read about it before you place your next trade.
The Real Path to the Lambo
What gets sold as “smart leverage” is, in truth, just a lottery ticket wearing a suit. The Lambo doesn’t come from hitting jackpots. It comes from consistency—from repeating disciplined decisions with positive expectancy until compounding does its quiet but powerful work.
And yes, I know most traders are in a hurry. The good news? The process can be accelerated—but not by gambling on options with negative expectancy. It can be accelerated using technical, rational tools. Once an edge is established, leverage makes sense. That’s where concepts like the Kelly criterion come in: scaling growth aggressively, but without walking straight into ruin. (I’ve already written about Kelly earlier in this blog: here.)
Conclusion
We’ve stripped the illusion bare: more conditions don’t make you smarter, they make you less likely to succeed. What feels like a shortcut is nothing more than a statistical mirage—the financial equivalent of a lottery ticket, marketed to you as a “highway to riches,” exploiting your belief that complexity equals intelligence.
Unfortunately, the narrative is powerful, because it preys directly on cognitive bias. I know I’m swimming against the tide here. I know this post won’t go viral. I don’t expect many to believe what the math has to say about options trading.
But maybe, just maybe, a small number of traders reading this will see beneath the surface and save their time, energy, and money for better pursuits. If that’s you, then this post has already done its job.
If you can resist the mirage and stick to building real edges, you’ve already won a key battle—and most likely saved yourself a costly trading lesson.

NVDA NVIDIA Corporation Options Ahead of EarningsIf you haven`t bought NVDA before the previous earnings:
Now analyzing the options chain and the chart patterns of NVDA NVIDIA Corporation prior to the earnings report this week,
I would consider purchasing the 150usd strike price Calls with
an expiration date of 2025-9-19,
for a premium of approximately $13.35.
If these options prove to be profitable prior to the earnings release, I would sell at least half of them.

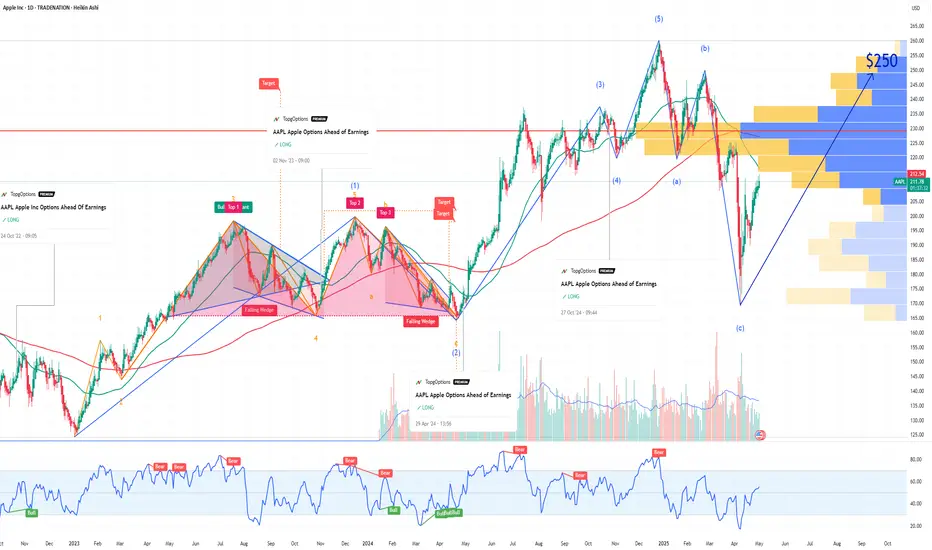
AAPL Apple Options Ahead of EarningsIf you haven`t bought AAPL before the previous rally:
Now analyzing the options chain and the chart patterns of AAPL Apple prior to the earnings report this week,
I would consider purchasing the 255usd strike price Calls with
an expiration date of 2026-1-16,
for a premium of approximately $7.30.
If these options prove to be profitable prior to the earnings release, I would sell at least half of them.
Disclosure: I am part of Trade Nation's Influencer program and receive a monthly fee for using their TradingView charts in my analysis.
MU Micron Technology Options Ahead of EarningsIf you haven`t bought MU before the rally:
Now analyzing the options chain and the chart patterns of MU Micron Technology prior to the earnings report next week,
I would consider purchasing the 155usd strike price Calls with
an expiration date of 2025-10-17,
for a premium of approximately $9.55.
If these options prove to be profitable prior to the earnings release, I would sell at least half of them.
Disclosure: I am part of Trade Nation's Influencer program and receive a monthly fee for using their TradingView charts in my analysis.

TSLA (daytrading) 2 plan for itPlan 2 could be possible because:
(p1 price is on sma 50 d1,p2 could be sma 200)
TSLA still has a small gap below that might need to be filled.
This week doesn’t look good for the overall market.
I will continue to watch it closely

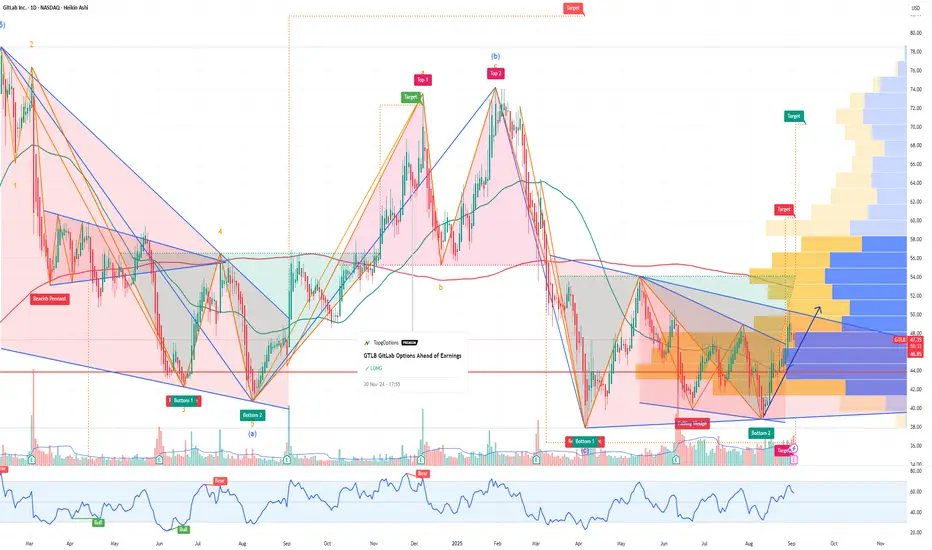
GTLB GitLab Options Ahead of EarningsAnalyzing the options chain and the chart patterns of GTLB GitLab prior to the earnings report this week,
I would consider purchasing the 50usd strike price Calls with
an expiration date of 2026-3-20,
for a premium of approximately $7.80.
If these options prove to be profitable prior to the earnings release, I would sell at least half of them.
TSLA (daytrading) small tradeI already entered but didn’t post earlier because I was too busy. You guys can wait for a small pullback tomorrow. Take profit whenever you feel comfortable.
1. Bullish doji candle on the daily (D1).
2. Uptrend still intact on D1 and higher timeframes.
3. Retest of the 50 SMA on D1.
4. Price touched the trendline.
Plan: Buy call options at the closest strike price with expiry this week. Don’t forget to set a stop loss.

TSLA (swingtrade) Bull flag1. Pattern : Bull flag breakout
2. retest: done
3. sma 50 on hold in D1,W
* could fake break out alway stoploss

#OP/USDT#OP
The price is moving within a descending channel on the 1-hour frame, adhering well to it, and is heading for a strong breakout and retest.
We are seeing a bounce from the lower boundary of the descending channel, which is support at 0.653.
We have a downtrend on the RSI indicator that is about to be broken and retested, supporting the upward trend.
We are looking for stability above the 100 moving average.
Entry price: 0.702
First target: 0.757
Second target: 0.805
Third target: 0.865

#OP/USDT#OP
The price is moving within a descending channel on the 1-hour frame and is expected to break and continue upward.
We have a trend to stabilize above the 100 moving average once again.
We have a downtrend on the RSI indicator that supports the upward move with a breakout.
We have a support area at the lower limit of the channel at 0.600, acting as strong support from which the price can rebound.
Entry price: 0.616
First target: 0.630
Second target: 0.641
Third target: 0.658

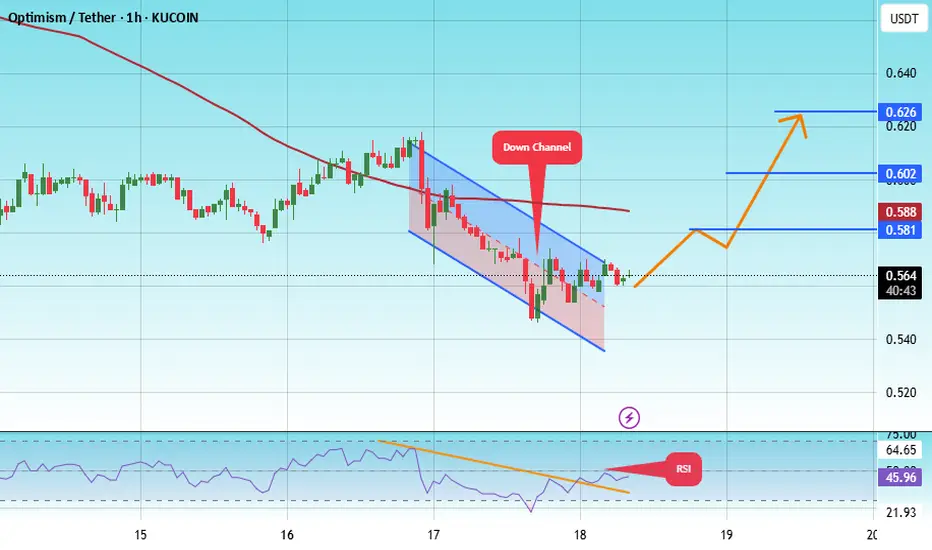
#OP/USDT#OP
The price is moving within a descending channel on the 1-hour frame, adhering well to it, and is heading toward a strong breakout and retest.
We are experiencing a rebound from the lower boundary of the descending channel. This support is at 0.544.
We have a downtrend on the RSI indicator that is about to be broken and retested, supporting the upward trend.
We are heading toward stability above the 100 moving average.
Entry price: 0.564
First target: 0.581
Second target: 0.602
Third target: 0.626
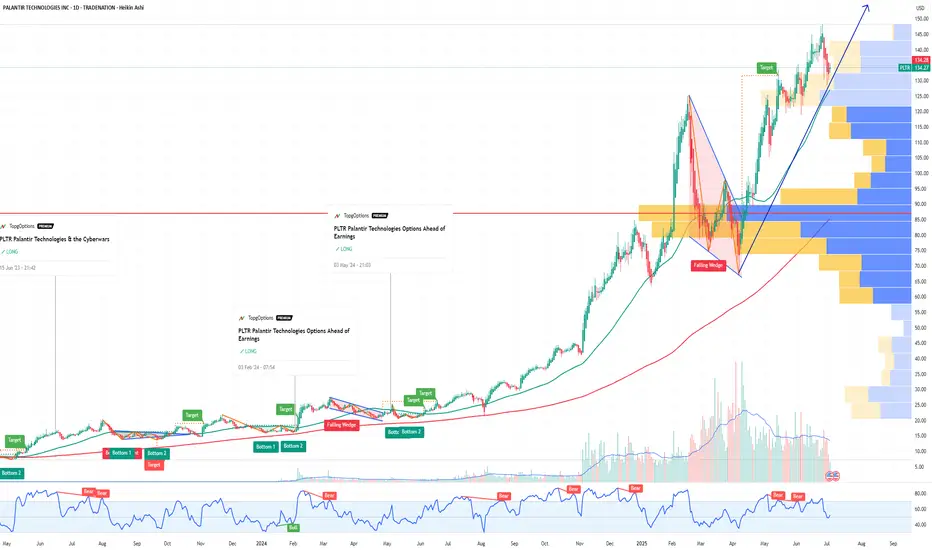
Why Palantir (PLTR) Could Be the NVDA of Government AI If you haven`t bought PLTR before the massive rally:
Palantir Technologies (PLTR) is proving it’s more than just another AI hype play — it’s becoming a core piece of the secure AI infrastructure for governments and large enterprises worldwide.
Key Bullish Arguments
1) Strong Government Moat
PLTR’s deep relationship with the U.S. government, NATO, and allies provides sticky, long-term revenue streams. In an age of geopolitical tension, this is exactly the type of mission-critical AI spending that stays funded.
2) Expanding Commercial Footprint
The commercial segment is no longer a side project. Palantir’s Foundry and Apollo platforms help enterprises deploy AI at scale — securely, in-house, and without sending sensitive data to open systems. Recent deals in healthcare, energy, and critical infrastructure show they’re broadening their customer base.
3) Profitability & Balance Sheet
Palantir is GAAP profitable for six consecutive quarters, with strong free cash flow and zero debt. For a growth stock in AI, this gives it rare staying power if macro conditions tighten.
4) Technical Strength
The stock broke out above ~$125–$130 support and is now testing key resistance in the $140–$148 range. Weekly momentum remains bullish, and institutional accumulation (A/D line) remains strong.
5) AI Tailwinds Remain
While the general AI trade has cooled for some names, PLTR’s unique moat in secure and domain-specific AI makes it more defensible than generic “AI SaaS” stocks. New contracts or AI platform updates could reignite momentum this summer.
Possible Summer Catalysts
New multi-year government deals — especially in defense and cybersecurity.
Major commercial partnerships — especially in healthcare or energy.
AI platform upgrades — more integrations with LLMs or domain-specific AI.
Inclusion in AI-focused ETFs — or further index rebalancing inflows.
Disclosure: I am part of Trade Nation's Influencer program and receive a monthly fee for using their TradingView charts in my analysis.
META Meta Platforms Options Ahead Of EarningsIf you haven`t bought META before the rally:
Now analyzing the options chain and the chart patterns of META Platforms prior to the earnings report this week,
I would consider purchasing the 710usd strike price in the money Calls with
an expiration date of 2026-6-18,
for a premium of approximately $89.30.
If these options prove to be profitable prior to the earnings release, I would sell at least half of them.
Disclosure: I am part of Trade Nation's Influencer program and receive a monthly fee for using their TradingView charts in my analysis.

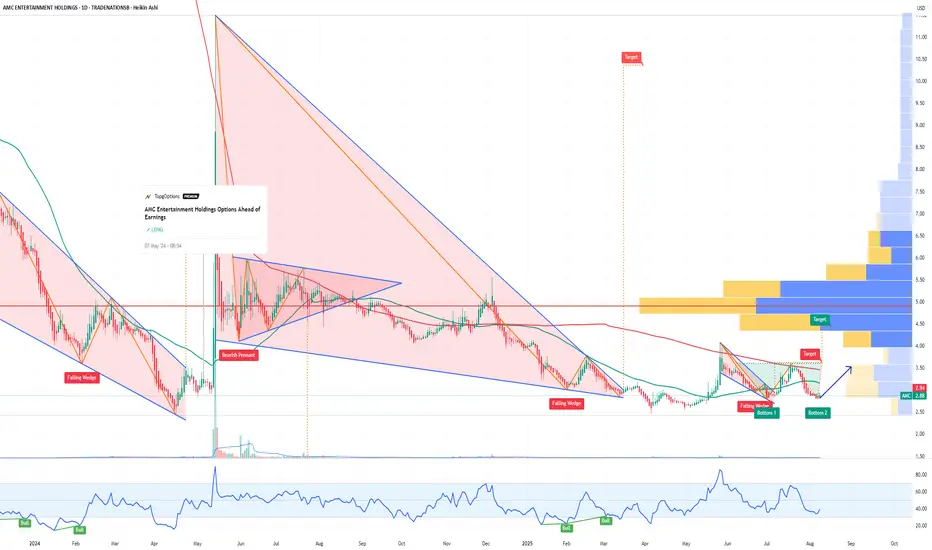
AMC Entertainment Holdings Options Ahead of EarningsIf you haven`t bought AMC before the last breakout:
Now analyzing the options chain and the chart patterns of AMC Entertainment Holdings prior to the earnings report this week,
I would consider purchasing the 2.50usd strike price Calls with
an expiration date of 2025-8-29,
for a premium of approximately $0.52.
If these options prove to be profitable prior to the earnings release, I would sell at least half of them.
Disclosure: I am part of Trade Nation's Influencer program and receive a monthly fee for using their TradingView charts in my analysis.
PINS Pinterest Options Ahead of EarningsIf you haven`t bought PINS before the previous earnings:
Now analyzing the options chain and the chart patterns of PINS Pinterest prior to the earnings report this week,
I would consider purchasing the 39usd strike price Calls with
an expiration date of 2025-8-8,
for a premium of approximately $2.22.
If these options prove to be profitable prior to the earnings release, I would sell at least half of them.

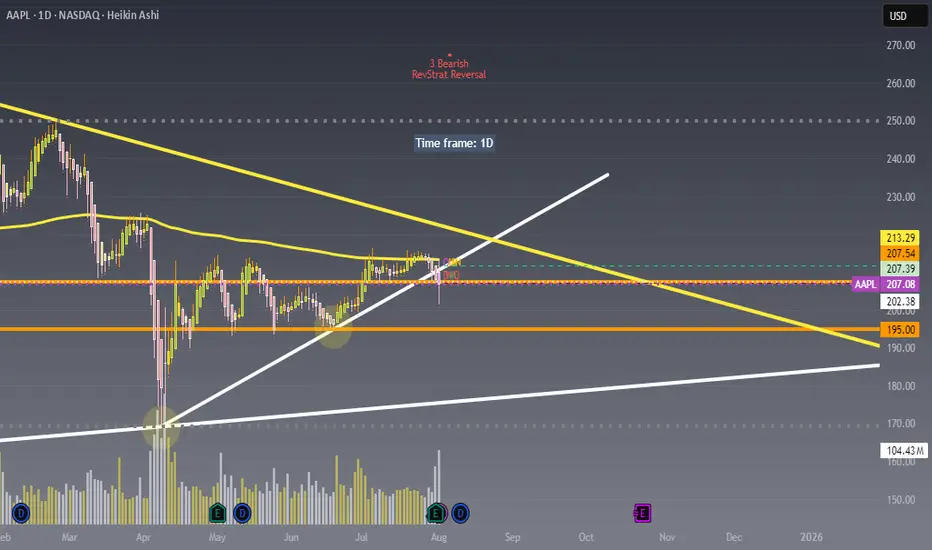
Watching AAPL closely here !!!Not financial advice – just sharing my outlook. 📉📈
Price is currently rejecting the upper trendline resistance around $213 and struggling to hold above the $207-$208 zone.
Looking for potential puts as long as price remains under this key resistance area.
Will be buying the dip near the $195 or $185 zone where strong demand and trendline support intersect.
Key levels :
Resistance: $213.29 / $207.54
Support: $202.38 / $195.00
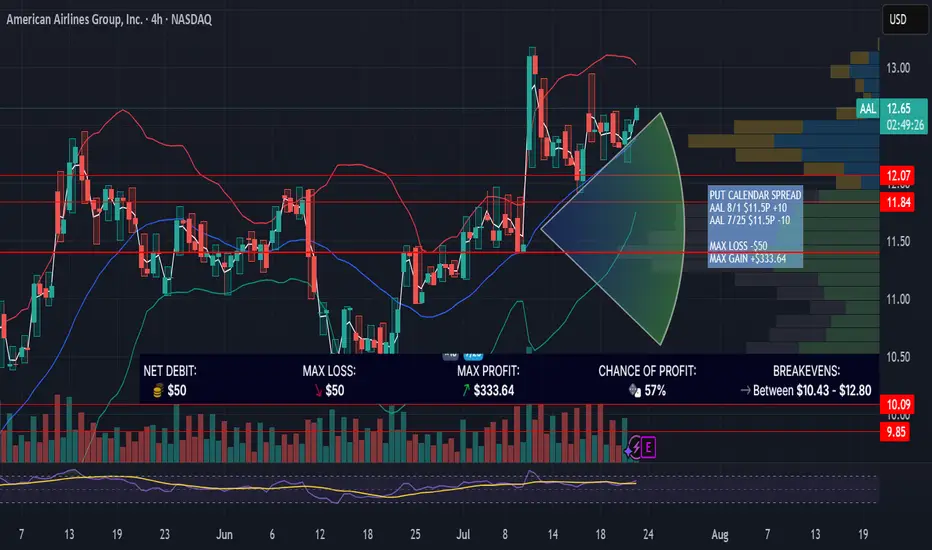
AAL PUT CALENDAR SPREAD / EARNINGSAAL is up 11% since 7/9/25 with a gap up riding on earnings of its competitor DAL. AAL earnings are in the morning on 7/24/25. Looking for a "sell the news" event with a good risk/reward options trade. This trade is designed for price to settle near the high volume node at $11.50 near expiration on 7/25/25.
PUT CALENDAR SPREAD
AAL 8/1 $11.5P +10
AAL 7/25 $11.5P -10
MAX LOSS -$50
MAX GAIN +$333.64
Gold. 14.07.2025. The plan for the next few days.The nearest resistance zones are where it's interesting to look for sales. It's not certain that there will be a big reversal, but I think we'll see a correction. We're waiting for a reaction and looking for an entry point.
The post will be adjusted based on any changes.
Don't forget to click on the Rocket! =)

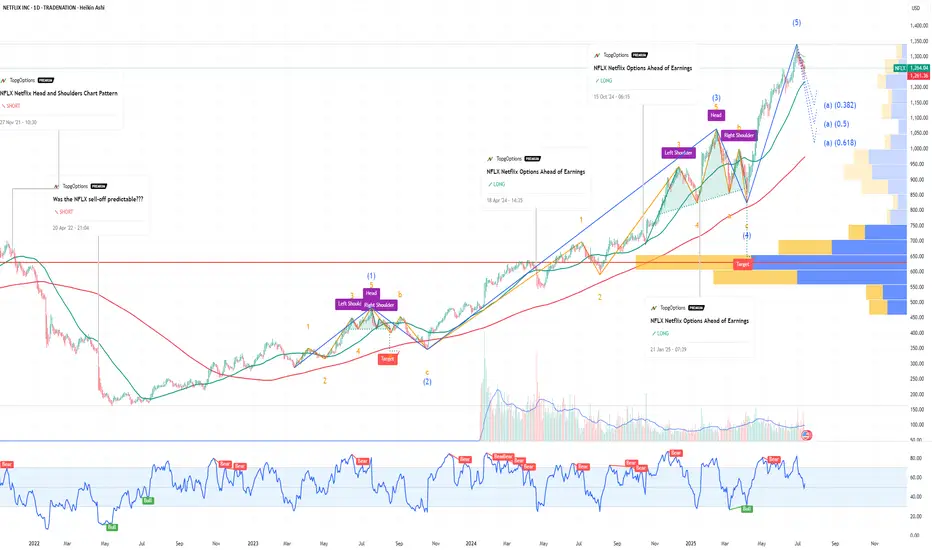
NFLX Netflix Options Ahead of EarningsIf you haven`t bought NFLX before the previous earnings:
Now analyzing the options chain and the chart patterns of NFLX Netflix prior to the earnings report this week,
I would consider purchasing the 1260usd strike price Puts with
an expiration date of 2025-9-19,
for a premium of approximately $71.10.
If these options prove to be profitable prior to the earnings release, I would sell at least half of them.
Disclosure: I am part of Trade Nation's Influencer program and receive a monthly fee for using their TradingView charts in my analysis.
(Daytrading) APPL going upH1 chart is respecting the uptrend.
Price has retested the 50 SMA on the H1 timeframe.
Price also touched the Ichimoku Cloud on H1.
→ Based on the risk-to-reward ratio, I’m expecting a Call position.

CRSP Could Crack the Holy Grails of Medicine: Cancer & AlzheimerWhen Tesla (TSLA) started, few believed a scrappy EV startup could transform the entire auto industry and ignite a green energy revolution. But it did.
Today, CRISPR Therapeutics (NASDAQ: CRSP) is quietly doing something similar for medicine — and if you squint, its upside might be even bigger than Tesla’s.
Gene Editing: The Next Industrial Revolution — For Your Cells
CRISPR/Cas9 gene editing is like biological software. It gives scientists the power to cut, delete, or rewrite genes — the source code of life — with surgical precision.
CRISPR Therapeutics was co-founded by Dr. Emmanuelle Charpentier, a Nobel Prize winner who helped pioneer this breakthrough. The company’s lead therapy, exa-cel — just FDA approved in the U.S. — is the first-ever CRISPR-based gene-editing treatment to hit the market.
First up: curing devastating blood disorders like sickle cell disease and beta-thalassemia — a $10 billion+ opportunity. But that’s only the start.
Aging: The Ultimate Disease
What if we treated aging itself as a disease?
Many scientists now argue that growing old is the result of accumulated genetic errors, cellular damage, and mutations — processes that can be slowed or even reversed.
Gene editing holds the promise to repair DNA damage, reprogram cells, and treat the root causes of age-related decline. If successful, it could extend healthy human lifespan by decades.
Think about that: Tesla made cars last longer and burn cleaner. CRSP could make you last longer and live healthier.
The Two Holy Grails: Cancer and Alzheimer’s
Beyond blood disorders, CRISPR Therapeutics is working on a pipeline targeting solid tumors, diabetes, and more. But the real game-changers are cancer and Alzheimer’s disease — the twin mountains every biotech company dreams of conquering.
With gene editing, we could one day rewrite the genetic mutations that fuel cancer growth or remove the faulty proteins that clog the brain in Alzheimer’s. These are trillion-dollar problems — and the company that cracks them will reshape human history.
Built for Scale — Like Tesla
CRSP isn’t going at it alone. Partnerships with Vertex, Bayer, and ViaCyte help spread risk and amplify impact. With over $2 billion in cash, it has the runway to execute — just as Tesla used capital to build factories and charging networks at scale.
The market still underestimates that this is a platform company — not a single-drug biotech. If Tesla went from cars to batteries, solar, and AI, CRSP could go from blood disorders to rewriting the code for life itself.
Bottom Line
Aging. Cancer. Alzheimer’s. These are the holy grails of medicine.
If you missed Tesla at $20 a share, CRISPR Therapeutics could be your second chance — the TSLA of Gene Editing.
Because the greatest disruption of all is not electric cars. It’s the chance that, one day, growing old will be optional.
