BX Blackstone Options Ahead of EarningsIf you haven`t bought BX before the rally:
Now analyzing the options chain and the chart patterns of BX Blackstone prior to the earnings report this week,
I would consider purchasing the 145usd strike price Calls with
an expiration date of 2026-2-20,
for a premium of approximately $3.90.
If these options prove to be profitable prior to the earnings release, I would sell at least half of them.
Optiontrading

TSLA(daytrading)bearback to retest
2 option to watch
1 hit sma50 in h1 also hit sma 200 h1
2 hit 0.5-0.615 fibonacci, resistant

HOOD Weekly Swing: Catch the Bearish Move Before Expiry!HOOD Weekly Signal | 2026-01-22
📊 TRADE DETAILS 📊
🎯 Instrument: HOOD
🔀 Direction: PUT (SHORT)
🎯 Strike: 100.00
💵 Entry Price: 0.97
🎯 Profit Target: 1.94
🛑 Stop Loss: 0.58
📅 Expiry: 2026-01-30
📏 Size: 1.0
📈 Confidence: 60%
MODERATE RISK WARNING: Consider reducing position size due to moderate confidence level.
🚨 IMPORTANT NOTES
Wide bid-ask spreads (e.g., $0.95/$1.00 for the $100 PUT) pose significant slippage risk on entry and exit.
The provided options tables lack strikes near the current price ($106.56), forcing the selection of a deep out-of-the-money option with a low delta (-0.199).
Trade Strategy / Edge:
Targets potential downside from technical divergences aligned with AI’s subtle bearish trajectory.
Very small position size (1%) limits capital at risk.
Manage this trade actively. Consider taking partial profits at Target 1 if reached.

NVDA (swingtrading) Downtrend break outSame as the title: NVDA broke its downtrend and is now retesting the trendline. We can wait for an entry.
I’ll add one more thing —the larger pattern.

BULL – In My Top 10 Picks for 2026: Is Webull the Next HOOD?I’ve been following BULL (Webull) closely, and it’s firmly in my top 10 picks for 2026. Structurally, the story is very compelling.
Retail participation in financial markets continues to grow, and platforms that serve these investors—brokerages like Webull—are direct beneficiaries of this trend.
When I think about the trajectory, BULL reminds me a lot of our early calls on HOOD.
Robinhood currently trades at a market capitalization of roughly $97 billion. BULL, on the other hand, is valued at only around $4 billion.
That gap highlights the potential upside if Webull can continue to grow its user base and improve monetization.
The numbers alone are not the full story, of course. Financial results and execution matter, and Webull will need to prove that it can convert its growing user base into consistent revenue streams.
But structurally, the ingredients are there. As user monetization improves, I expect financial performance to start reflecting this, which could be a major catalyst for the stock.
The stock's 52-week range of $7.57 to $79.56 further fuels my bullish stance.
After dipping to its lows amid broader market volatility, BULL has shown resilience, trading around $8.16 as of mid-January 2026.
This setup strongly reminds me of our early HOOD call positions when the stock was trading around $9, back in its post-IPO correction phase. Robinhood eventually surged as retail trading boomed, and I anticipate a similar catalyst for Webull—perhaps through strategic partnerships, international expansion, or even acquisition interest in a consolidating industry.
In my view, BULL represents a rare combination of structural tailwinds, compelling valuation, and optionality. For those looking for a top pick for the year, it checks all the boxes.

Weekly Market Outlook,Nifty, BankNifty,S&P 500Nifty closed the week at 25,694, almost flat vs last week, after making a high of 25,899 and a low of 25,473.
As discussed earlier, once again Nifty respected the broader range of 26,150–25,250, keeping the market in a balance phase.
This week’s candle reflects indecision — such structures often act as compression, and once price accepts beyond the range, moves can turn fast.
🔼 Nifty Upside
If Nifty manages to sustain above 25,811 on a 1-hour close, upside levels to watch:
25,900
26,000
26,150
Acceptance above this zone will be key.
🔽 Nifty Downside
If Nifty sustains below 25,600, downside levels open towards:
25,500
25,400
25,200
📌 Structure Summary
25,600–25,811 → balance zone
Above 25,811 → bullish acceptance
Below 25,600 → downside expansion
For now, broader range remains
👉 26,150 – 25,200, unless any major global trigger changes sentiment.
🏦 BankNifty View
BankNifty closed near an important fib zone around 60,092.
If it gives a consecutive close above 60,150, upside levels:
60,360
60,437 (ATH)
60,500
60,700
60,950
Broader range remains
👉 61,200 – 59,000.
🌎 S&P 500
Weekly candle remains indecisive.
Above 6,986 → 7,026 / 7,122
Below 6,885 → 6,780 / 6,700 / 6,469
⚠️ Final Note
Market remains volatile and range-bound.
In such phases, patience matters more than prediction.
Respect levels — let price decide direction.

TSLA (swingtrading)this is a topic where we can talking about TSLA's next move.
-Looks like TSLA is still respecting its trendline support.
-Should we enter now, or wait for a correction?

GOOGL (daytrading)-D1 (Daily chart):
The price is moving inside a channel (read comment)
It touched the support line (the bottom line).
-H1 (1-hour chart):
Price is moving sideways (no clear up or down).
Expect going up
-R:R = 1:2 (Risk : Reward)
You risk $1 to try to make $2.
👉 This is good risk management

Positive GEX Profile Points Toward 700 Gap FillMETA – Holding Above HVL, 50 DMA Reclaim in Progress, Upside Call Resistance at 700
META is currently trading below the 200-day moving average , but recent price action suggests a potential structural improvement rather than continued weakness.
From an options perspective, the broader structure remains Positive GEX , indicating that dealer positioning is still supportive on pullbacks. At the same time, IV remains low , which typically favors range expansion and directional follow-through once key technical levels are reclaimed.
On the daily chart, price is now starting to reclaim the 50-day moving average , a level that previously acted as dynamic resistance. Importantly, META is also holding above the High Volatility Level (HVL) , which keeps the short-term regime constructive rather than defensive.
Volatility conditions remain favorable:
Call Pricing Skew is elevated (~31.6%), showing persistent call demand
IV remains controlled, allowing price to move without immediate volatility compression pressure
Looking forward, the most important upside call resistance is the 700 level, which represents:
Highest core call resistance on the Feb 20 (Optimal Monthly) expiration
A major gap fill from the prior breakdown
A clear technical resistance zone visible on the daily chart
This confluence makes 700 a logical upside target if price can hold above HVL and fully reclaim the 50 DMA.
Key structure to watch:
200 DMA – higher timeframe resistance overhead
50 DMA – short-term trend reclaim in progress
HVL – holding above keeps structure constructive
700 – primary upside target (gap fill + core call resistance)
As long as price holds above HVL with supportive GEX structure, rotational upside toward 700 remains the higher-probability path .

Nifty 50 Chart Ananlysis for MondayThis chart analysis for Monday 22 December 2025
here 15 minutes time frame chart analysis that is also help in 5 minutes time frame
Imortant Note: Lines/Boxes for Support & Resistance.
Thank You for support with Boost/Follow
Regards
PROFIT MANTRA

HDFC Bank Option Chart Near Major Support AreaHDFC Bank – 1 Hour Timeframe Analysis OPTION 980 CE Chart .
This is the 1-hour timeframe chart of HDFC Bank. The stock is currently moving within a descending parallel channel, with a key support zone near ₹12–13.
A bullish candle formation is visible at this support level.
If the price sustains above this zone, a potential reversal can be expected, with the stock likely to move towards higher resistance levels from here.
Thank you.

DRI Darden Restaurants Options Ahead of EarningsIf you haven`t bought DRI before the rally:
Now analyzing the options chain and the chart patterns of DRI Darden Restaurants prior to the earnings report this week,
I would consider purchasing the 180usd strike price puts with
an expiration date of 2025-12-19,
for a premium of approximately $3.75.
If these options prove to be profitable prior to the earnings release, I would sell at least half of them.

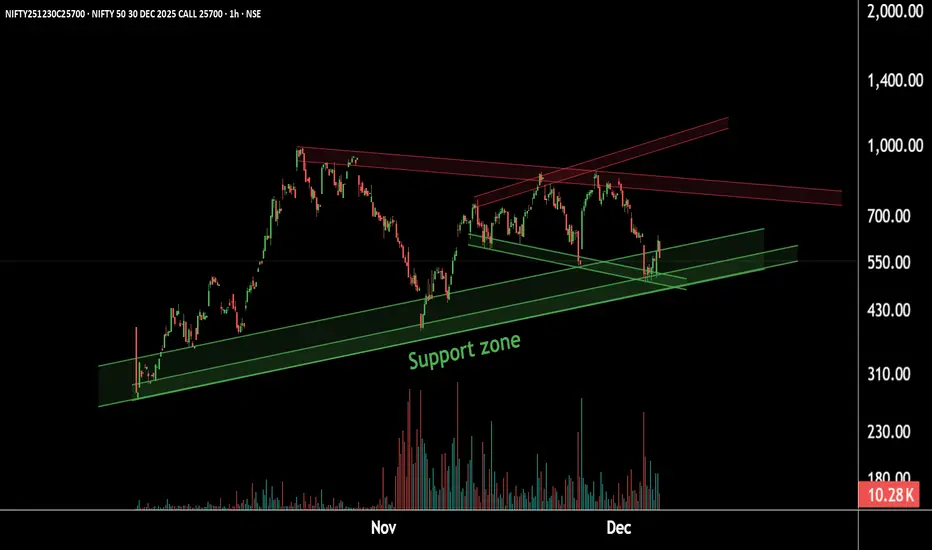
Nifty Option Chart Setting Up for a Big Bull WaveThis is the 1-hour timeframe chart of the NIFTY 25,700 CE.
The option is currently trending near a strong support zone at ₹450–₹500.
The chart indicates that the call is taking support at this level, and any dip into this zone may trigger a bullish reversal.
If this support holds, we may witness an upside move toward the potential resistance area of ₹800–₹850 , short term level 680 and 730 .
Thank you.
AAOI Applied Optoelectronics potential rally by EOYApplied Optoelectronics AAOI is well-positioned for a strong rally toward $24 per share by the end of 2025, supported by multiple operational and strategic catalysts. A key recent development—the warrant agreement with Amazon—adds a powerful endorsement and financial backing that enhances the bullish case.
1. Amazon’s Strategic Warrant Agreement: A Major Vote of Confidence
On March 13, 2025, AAOI issued a warrant to Amazon.com NV Investment Holdings LLC, granting Amazon the right to purchase up to approximately 7.95 million shares at an exercise price of $23.70 per share.
About 1.3 million shares vested immediately, with the remainder vesting based on Amazon’s discretionary purchases, potentially up to $4 billion in total purchases over time.
This agreement signals Amazon’s strong confidence in AAOI’s technology and its critical role as a supplier of high-speed optical transceivers for Amazon Web Services and AI data center infrastructure.
The warrant price near $24 effectively sets a floor and a valuation benchmark, supporting the thesis that AAOI’s stock could reach or exceed this level by year-end.
2. Major Data Center Wins and Hyperscale Customer Re-Engagement
AAOI recently resumed shipments to a major hyperscale customer, with volume shipments of high-speed data center transceivers expected to ramp significantly in the second half of 2025.
This re-engagement with a key customer aligns with the surging demand for AI-driven data center infrastructure, providing a strong revenue growth catalyst.
3. Robust Revenue Growth and Margin Expansion
Q1 2025 revenue doubled year-over-year to nearly $100 million, with gross margins expanding to over 30%, reflecting operational efficiencies and favorable product mix.
The company expects to sustain strong quarterly revenue ($100–$110 million) and ramp production capacity to over 100,000 units of 800G transceivers per month by year-end, with 40% manufactured in the U.S.
4. Manufacturing Expansion and Supply Chain Resilience
AAOI is scaling manufacturing in the U.S. and Taiwan, enhancing supply chain robustness and positioning itself to benefit from potential government incentives for domestic production.
Its automated, largely in-house manufacturing capabilities provide a competitive edge in meeting hyperscale and AI data center demand.
In conclusion:
Amazon’s warrant agreement at a $23.70 strike price not only provides a direct valuation anchor near $24 but also serves as a powerful strategic endorsement of AAOI’s technology and growth prospects. Combined with robust revenue growth, expanding manufacturing capacity, and key customer re-engagement, AAOI has a compelling case to reach or exceed $24 per share by the end of 2025.

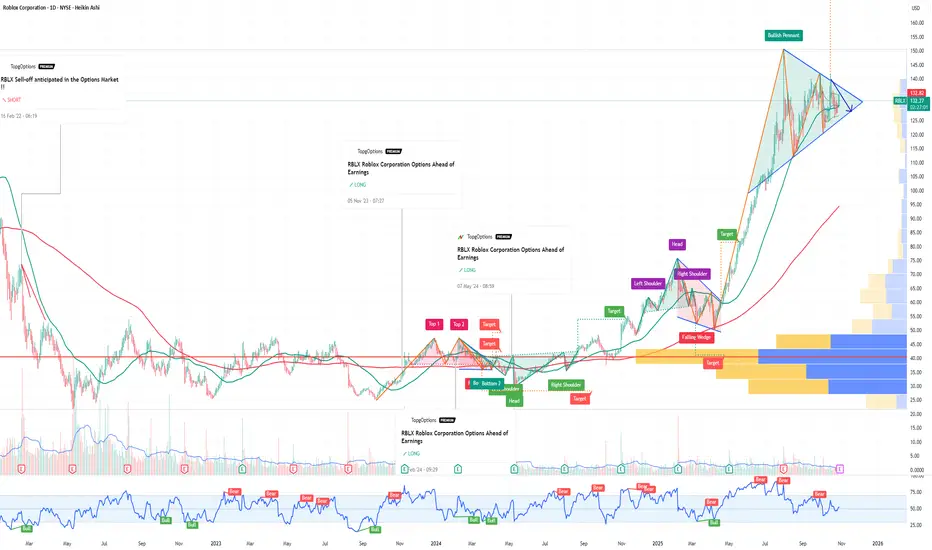
RBLX Roblox Corporation Options Ahead of EarningsIf you haven`t bought RBLX before the rally:
Now analyzing the options chain and the chart patterns of RBLX Roblox Corporation prior to the earnings report this week,
I would consider purchasing the 130usd strike price Puts with
an expiration date of 2026-1-16,
for a premium of approximately $13.80.
If these options prove to be profitable prior to the earnings release, I would sell at least half of them.
Unlocking Potential: Power Finance Corporation Analysis! 💼📈Traders, let's delve into Power Finance Corporation today ! 🌟 In the daily timeframe, we're witnessing a range-bound movement, with the price testing previous swing highs. 🔄 Anticipate a breakout above this level(red box), potentially targeting Rs. 450 and beyond. But before that it may come around at Rs.400 to go up further. PFC appears poised for bullish action! 🚀 Options traders, explore 400 CE or below 400 CE options with ample liquidity. Let's capitalize on this opportunity! 💼📊
Thank you. See you again in the next post!
Best regards,
Alpha Trading Station

IMPP Imperial Petroleum Options Ahead of EarningsIf you haven`t bought IMPP before the rally:
Now analyzing the options chain and the chart patterns of IMPP Imperial Petroleum prior to the earnings report this week,
I would consider purchasing the 7usd strike price Calls with
an expiration date of 2026-4-17,
for a premium of approximately $0.85.
If these options prove to be profitable prior to the earnings release, I would sell at least half of them.

SLS SELLAS Life Sciences Group Options Ahead of EarningsAnalyzing the options chain and the chart patterns of SLS SELLAS Life Sciences Group prior to the earnings report this week,
I would consider purchasing the 3.50usd strike price Calls with
an expiration date of 2027-1-15,
for a premium of approximately $0.52.
If these options prove to be profitable prior to the earnings release, I would sell at least half of them.

NOK Nokia Options Ahead of EarningsAnalyzing the options chain and the chart patterns of NOK Nokia prior to the earnings report this week,
I would consider purchasing the 5.50usd strike price Calls with
an expiration date of 2025-11-21,
for a premium of approximately $0.34.
If these options prove to be profitable prior to the earnings release, I would sell at least half of them.

Tesla Correction ahead ? - Levels to be aware Of !In this video I present to you the idea of a Tesla correction into the 340/350USD price zone .
I mark out a potential short setup as well as a strong area for longs/accumulation.
Tools used TPO chart, Fibs, Anchored V wap , Volume Profile, Parallel channels
Good luck with your trading and thanks for your support

The Options Mirage: The Jackpot That’s Rigged Against YouMost retail traders fall in love with options because they seem to offer the impossible: with just a few hundred dollars you can dream of outsized returns. Fast money, easy money—at least that’s the story. With the right broker account and a handful of trades, the dream of becoming rich feels just around the corner.
What you’re not told—and what few truly understand given the complexity of the product—is that the “explosive payout” is not an opportunity. It’s a price. A very high one. And often inflated by the industry itself, knowing that the average investor (or rather, gambler) has no real way to calculate what they’re actually paying for. What you’re really buying is access to an extremely low probability of success, dressed up as a sophisticated strategy.
Yes, it’s the same psychology that drives lotteries and sports betting. And in finance, the odds aren’t any kinder.
The Baseline: the Where
At its simplest, speculation is about anticipating an up or down move in price.
Think it’s going up? Buy and aim to sell higher.
Think it’s going down? Sell and aim to buy back lower.
It sounds simple, but anyone with more than a month of trading experience can tell you it’s anything but. No one can predict the future with certainty. Still, this is at least a binary game: two mutually exclusive outcomes, like flipping a coin.
In technical terms, the market starts as a 50/50 distribution. With skill, analysis, and discipline, you might bias those odds slightly—say, 60/40 in your favor. That bias, repeated consistently, is what we call an edge. And with an edge, the path to long-term success is paved.
The Illusion of Acceleration
But let’s be honest: who wants to grind out a 60/40 edge slowly? We’re here for the Lamborghini, right? And the sooner the better.
That’s where the industry steps in with its “solution”: options. The promise is seductive—leverage the process, accelerate the outcome. With little money down, you can aim for massive returns. What’s not to like?
The problem is that the acceleration doesn’t come for free. To deliver those explosive payouts, the game adds layers of complexity.
From Where… to How and When
In options, you don’t just need to be right about where price is going.
You also need to be right about how it moves. That’s volatility—the speed and amplitude of the move. Even if you guess the direction correctly, if the move isn’t strong enough to beat strike + premium, you lose.
And then comes the when. Options expire. Time works against you. With the rise of 0DTE options, this window has shrunk to a single day. You might be perfectly right on direction and volatility—but if it happens tomorrow instead of today, your trade is worthless.
Now here’s the key point: this isn’t additive complexity. It’s multiplicative. Each layer collapses your probability of success exponentially. Even though the mathematical proof could be enlightening, I have promised not to use heavy math in this blog. All you need to know is this: in the majority of cases, that collapse in probability is not evenly compensated by the outsized payout. And this is exactly what most retail traders fail to perceive.
It’s not just that you’re playing a harder game—it’s that you’re playing a biased one, where the odds are stacked even further against you.
The Lottery Bias: The Cognitive Trap
Here’s where psychology plays its cruelest trick. The lower the probability of success, the higher the payout offered. In fact, it’s not even the full payout you deserve—it’s a discounted, haircut payout, cleverly packaged so you don’t notice because the potential number is so large. And that number lights up the brain like a jackpot.
The industry knows this. It builds its business on the fact that humans systematically overestimate tiny probabilities and underestimate the certainty of losing. Retail traders convince themselves they’re being clever: risking little for the chance at something huge. But the math is merciless—the expected value is brutally negative.
The market is not handing you an edge. It’s dismantling any possibility you had of one. That giant payout you see? It’s not a gift—it’s a warning label.
And yes, I know you can point to stories about the guy who hit the jackpot, who “proved the math wrong.” But let me ask you this: do you know what survivorship bias is? If you don’t, and you’re trading options, here’s some professional advice for free—go and read about it before you place your next trade.
The Real Path to the Lambo
What gets sold as “smart leverage” is, in truth, just a lottery ticket wearing a suit. The Lambo doesn’t come from hitting jackpots. It comes from consistency—from repeating disciplined decisions with positive expectancy until compounding does its quiet but powerful work.
And yes, I know most traders are in a hurry. The good news? The process can be accelerated—but not by gambling on options with negative expectancy. It can be accelerated using technical, rational tools. Once an edge is established, leverage makes sense. That’s where concepts like the Kelly criterion come in: scaling growth aggressively, but without walking straight into ruin. (I’ve already written about Kelly earlier in this blog: here.)
Conclusion
We’ve stripped the illusion bare: more conditions don’t make you smarter, they make you less likely to succeed. What feels like a shortcut is nothing more than a statistical mirage—the financial equivalent of a lottery ticket, marketed to you as a “highway to riches,” exploiting your belief that complexity equals intelligence.
Unfortunately, the narrative is powerful, because it preys directly on cognitive bias. I know I’m swimming against the tide here. I know this post won’t go viral. I don’t expect many to believe what the math has to say about options trading.
But maybe, just maybe, a small number of traders reading this will see beneath the surface and save their time, energy, and money for better pursuits. If that’s you, then this post has already done its job.
If you can resist the mirage and stick to building real edges, you’ve already won a key battle—and most likely saved yourself a costly trading lesson.

Why IonQ (IONQ) Could Be the NVDA of Quantum ComputingIf you haven`t bought IONQ before the rally:
Now you need to know that IonQ isn’t just another speculative quantum stock — The company is building a robust ecosystem around its best‑in‑class trapped‑ion architecture and targeting fault‑tolerant, networked quantum systems. With record bookings, major acquisitions, and a strong balance sheet, IonQ could emerge as the NVIDIA equivalent for quantum infrastructure.
Key Bullish Arguments
1) Superior Quantum Tech – Trapped‑Ion Advantage
IonQ’s trapped-ion processors boast 99.9% two-qubit fidelity, demonstrating higher accuracy and scalability than superconducting alternatives
These systems also operate at room temperature, meaning simpler deployment and lower costs
2) Ecosystem Strategy & Acquisitions
The $1.08B acquisition of Oxford Ionics (expected close in 2025) expands IonQ’s qubit control tech, pushing toward planned 80,000 logical‑qubit systems by decade’s end
Combined with ID Quantique and Lightsynq, IonQ is building a full-stack quantum and networking offering
3) Strong Revenue Growth & Cash Runway
Revenue soared from $22M in 2023 to $43.1M in 2024, with bookings of $95.6M
. Q1 2025 saw $7.6M revenue and EPS –$0.14, beating expectations; cash reserves near $697M provide years of runway
4) Real Commercial Deployments
IonQ sold its Forte Enterprise quantum system to EPB ($22M deal) for hybrid compute and networking, marking real-world commercial applications
5) AI & Quantum Synergy
Involvement in NVIDIA’s Quantum Day and hybrid quantum‑classical AI demos (e.g., blood pump simulation with Ansys, ~12 % faster) indicates strategic synergy and positions IonQ as a critical piece in the future AI stack
Recent Catalysts:
Texas Quantum Initiative passes – positions IonQ at forefront of U.S. state-backed innovation
Oxford Ionics acquisition pending – major expansion in qubit scale & tech
Barron’s analyst buys – industry analysts see long-term potential; IonQ among top quantum picks
Broader quantum optimism – McKinsey & Morgan Stanley forecasts highlight synergy between quantum and AI, benefiting IonQ

KMX CarMax Options Ahead of EarningsIf you haven`t sold KMX before the previous earnings:
Now analyzing the options chain and the chart patterns of KMX CarMax prior to the earnings report this week,
I would consider purchasing the 90usd strike price in the money Calls with
an expiration date of 2027-1-15,
for a premium of approximately $4.25.
If these options prove to be profitable prior to the earnings release, I would sell at least half of them.
Disclosure: I am part of Trade Nation's Influencer program and receive a monthly fee for using their TradingView charts in my analysis.
