November - December Price Predictions: Half way to the moonSo the orange line is from my original TA's did not change anything. Readjusted the blue prediction path based on our current market price. Overall, lines up with my original analysis.
First of all ,this might be one of my weaker TA's. Very tired as of writing this with less than 4 hours of sleep. Brain dead. My last three TA's have thus far been fairly accurate and I am glad people in my group chats made $$$ and pocketed some nice change. I personally splurged out and bought my self some new pants from @bananarepublic, but hey they were 60% off, so... worth! Haven't hit that Lambo money yet.
Going to be difficult predicting the market movements as we are currently in a consolidation phase and formulating a support line between $64-68. Litecoin has been holding up fairly well considering BTC's decline of $600. We are seeing more independent movement between LTC and BTC, however, if a large BTC correction hits we can expect LTC to follow.
We have great news to look forward to from a technological advancement standpoint. We can see that Charlie Lee and the Litecoin Foundation making strides in development with lightning network, automatic swaps, etc. 2018 will be a very interesting year for this coin as more developers join the team and the FUD and FOMO of Bitcoin and its "forks" continue to progress.
NOWWW FOR WHAT YALLLSS BEEN WAITING FORR~~~~~~~~~~~~~
Current short-term analysis: Price will consolidate between $64-68. I do not expect a huge dip unless BTC undergoes another fork or some crazy shit happens, as it usually does in the crypto world. We are in a great position to go long. Resistance lines were so weak yesterday I thought we were going to bust towards $75. Sadly momentum died and we are sitting on low volume. Resistance levels are now up and the big boys are reassessing their strategy for Litecoin. It took us about 5 days to push from $59 to breaking $66. Expect the same timeframe for us to pop to $75. Yesterday was the largest momentum and buying volume i have seen in a long time. We will need the same level of momentum to propel us to $80 and beyond.
So as of now be patient with LTC breakout is imminent. You can enter 30% of your portfolio between $67-64 and potentially wait for more dips. Let's hope not. It would reverse everything we have been fighting for the past couple months. For Nov 17-20 it should be relatively quiet. BTC is down from $8,000 and we will slowly be consolidating.
$72 will be hit by next week with a possible touch of $75. You can leverage positions in high $60's then. I will update this TA on the daily for a more accurate prediction. As of now, my magic orb is a little foggy and i need some R&R.
Long-term analysis: Hold your money until $75,80,85,90. get rich. donate to someone else that is less fortunate, because you are blessed. Pass it forward
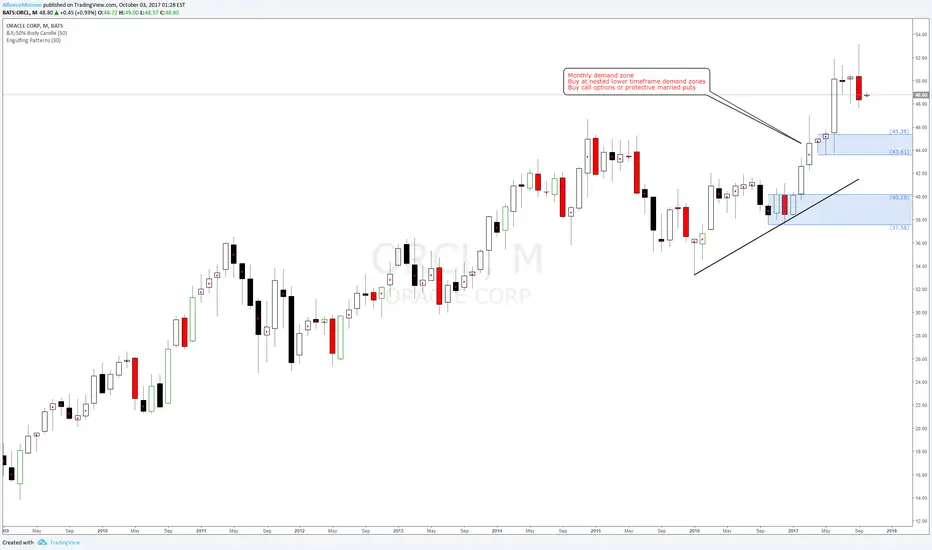
Oracle

Oracle American Stock buy setup at monthly demand zoneClear uptrend on Oracle #ORCL american stock. Planning longer term longs at Monthly demand zone. Buy at nested lower timeframe demand levels and imbalances. Buy call options or protective married puts
Oracle ORCL American Stock long bias at weekly demand zone 45.50Oracle ORCL American Stock long bias at weekly demand zone 45.50. Waiting for a retracement at weekly demand level in order to go long on this american stock

A Big Boy Oracle For The Bucket? Well, it looks real... Oracle is already traded the highs, technical the stock is distributing. So It is question of whether we upthrust or we go straight through the Ice. Not one I want to bet on...

Bullish OracleStochastic created two divergences simultaneously.
There is a ~75% chance of price following the stochastic this time.
If it does, expect the price to trade in the box given.
So be bullish on Oracle.

ORACLE: Daily MonitorWe appreciate your interest in our analysis, if you agree (or not) with our work, and would like to continue reading our opinions, be part of it with your "I Like"... Thanks you!
SignalSuisse
www.nonsolotrading.com

Oracle Corp Daily (14.08.2014) Technical Analysis TrainingThe Oracle Corp (NYSE:ORCL) Daily Diagram Technical Analysis Training shows the following:
The ORCL share after some consolidations finally got itself under the KUMO. The weekly diagram is turning slowly to bullish and it is above the KUMO. The monthly diagram is weakly bullish too.
MACD is marginally bullish and RSI walks the 50. The volume is moderate.
There is no special candlestick pattern. The share is under the KUMO and it is below Kijun Sen (blue line) and Tenkan Sen (green line) too.
I suggest to stay aside because the bullishness is weak under the KUMO and the volume is less than the usual.
Long in a case of breaching the Kijun Sen today at close.

Oracle Corp Daily (29.07.2014) Technical Analysis TrainingThe Oracle Corp (NYSE:ORCL) Daily Diagram Technical Analysis Training shows the following:
The ORCL share after some consolidations finally got itself under the KUMO. The weekly diagram is bullish and above the KUMO. The monthly diagram is bullish too. MACD is bullish and RSI walks above 50. The volume is moderate.
There is no special candlestick pattern. The share is under the KUMO but it is above Kijun Sen (blue line) and Tenkan Sen (green line) too.
I suggest to stay aside because under the KUMO the bullishness is weak and the volume is less than the usual. Otherwise hold as long as support line holds.

Oracle Corp Daily (19.07.2014) Technical Analysis TrainingThe Oracle Corp (NYSE:ORCL) Daily Diagram Technical Analysis Training shows the following:
The ORCL share after some consolidations finally got itself under the KUMO. The weekly diagram is bearish. The monthly is under a local top until now. MACD is bearish and RSI is near 38. The volume is as more than usual on declines.
There is no special candlestick pattern. The share is under the KUMO and with these declines is under Kijun Sen (blue line) and Tenkan Sen (green line) too.
I think that there is a SHS pattern. I cannot place a fib measurement. Head of pattern to neckline shows a projection to EMA 200 if it break the neckline.

Oracle Corp Daily (09.07.2014) Technical Analysis TrainingThe Oracle Corp (NYSE:ORCL) Daily Diagram Technical Analysis Training shows the following:
The ORCL share has made a long term development with the support of the trend line (light blue). This support line was over the KUMO, which means that the ORCL was bullish in long term. The weekly diagram shows bearish. The monthly is on a local top until now. In the daily diagram the share consolidates in the KUMO from Top to Bottom.
MACD is bearish and RSI is near 38. The volume is as usual.
We have no special candlestick pattern. The share is in the KUMO and with this declines is under Kijun Sen (blue line) and Tenkan Sen (green line) too.
There is no special pattern. I cannot place a fib measurement.
The strategy here is to stay aside until the share choose its way against the KUMO. Long above the KUMO short under it.
