1/16 GAMEPLAN! 🔔 TRADESWITHB – Pre-Market Breakdown (MNQ / NQ)
📍 Higher-Timeframe Context
• Market is balanced → expanding, not trending cleanly.
• Price already completed a full overnight rotation:
• PM Low → PM High → retrace → consolidation
• This tells us today is likely a reaction-based day, not a runaway trend.
⸻
🐻🐂 Key POIs (Levels That Matter Today)
🔴 Upper Resistance / Sell Zones
• POI 4 – 26,006
• POI 5 – 26,079
• Strong HTF supply
• Prior rejection + overnight highs
• Expect reaction first, continuation only if acceptance occurs
⸻
🟡 Mid-Range / Decision Zone
• POI 2 – ~25,875
• POI 3 – ~25,924
• This is the battle zone
• Chop, fakeouts, and liquidity grabs likely
• No bias here — wait for confirmation
⸻
🟢 Lower Support / Buy Zones
• POI 1 – ~25,690
• FVG Mid – ~25,670
• Strong demand from prior session
• If swept and reclaimed → high-probability bounce area
• Failure below = opens downside expansion
⸻
⏱️ Session Levels in Play
• Asia High / Low → already respected
• London High (~25,873) → acting as intraday pivot
• NY AM High (~25,954) → key rejection / breakout level
• NY AM Low (~25,803) → downside trigger if broken
⸻
📊 Game Plan for Today
✅ Bullish Scenarios
• Hold POI 1 / FVG Mid
• Reclaim London High
• Acceptance above NY AM High
• Targets:
• POI 3 → POI 4 → POI 5
⸻
❌ Bearish Scenarios
• Rejection at POI 3–4
• Loss of NY AM Low
• Failure to reclaim London High after rejection
• Targets:
• POI 1 → FVG Mid → lower POIs
⸻
⚠️ Trader Reminders
• This is a reaction day, not a prediction day
• Let price come to your levels
• Entries come from confirmation, not anticipation
• No confirmation = no trade
Orbstrategy

1/15 recap - Tears are real and we cannot have all winning daysPremarket POI map
Key levels I marked:
NY AM High: 25,954.25
PDH: 25,878.75
NY AM Low: 25,803.50
POIs above: 25,871.25 / 25,920.50 / 26,006.00 / 26,083.50 / 26,106.25
Lower POIs: 25,690.00 / 25,670.25 / 25,622.50 / 25,596.25 / 25,579.50 (and lower)
Gameplan (simple):
Bull case: reclaim/hold PDH + POI1 → push to POI2/POI3.
Bear/flush case: lose AM Low → next POIs below.
What price actually did (chart story)
Early session: Price was strong (green trend/structure), then sold off from the upper POI zone, showing “decision candle” rejection near your POI2 area.
Mid-morning: The drop drove into the NY AM Low (25,803.50) zone (I highlighted this). That level acted like the decision point.
Reversal confirmation: You caught the key idea—hold AM Low → reclaim back into PDH/POI1 area. Your later screenshots show LONG valid entry printing around the POI1 / PDH reclaim area and then continuation.
Clean takeaway: Today’s “A+” idea was the AM Low hold + reclaim (your circled 25,803.50).
Your Trades (QQQ 1/15 Calls) — lined up & totaled
From your trade screenshot list:
Sequence (CST)
11:18 – Buy QQQ 1/15 $627C x3 @ 0.43 → -129
11:23 – Buy $627C x3 @ 0.40 → -120
11:31 – Buy $627C x4 @ 0.28 → -112
12:05 – Buy $627C x5 @ 0.21 → -105
12:15 – Buy QQQ 1/15 $626C x2 @ 0.54 → -108
13:40 – Buy QQQ 1/15 $625C x1 @ 0.18 → -18
Late-day closes / salvage:
14:11 – Sell $625C x1 @ 0.05 → +5
14:17 – Sell $626C x2 @ 0.02 → +4
14:37 – Sell $627C x15 @ 0.01 → +15
P/L Summary
Winners: +$24
Losers: -$592
✅ Net P/L: -$568.00
What this means in plain English: you kept a bullish thesis (calls) while price/IV/theta didn’t pay fast enough, so the position decayed and you ended up “selling for pennies” into the close.

MNQ Premarket Plan (POI Map) — 1/15🚨 MNQ Premarket Plan (POI Map) — 1/15
Bias/Context: We’re pressing the 25,870–25,880 decision zone (POI1 / near PDH). This is where trend day continuation OR rejection can start.
📍 Upside POIs (targets)
• POI1 25,871.25
• POI2 25,920.50
• POI3 26,006.00
• POI4 26,083.50
• POI5 26,106.25
📍 Downside POIs (supports)
• 25,738.75 → 25,652.75 → 25,615.50
• then 25,554.50 / 25,538.00
• deeper: 25,502.25 → 25,450.25 → 25,388.00 → 25,357.75 (FVG mid)
• worst case: 25,295.75
✅ Gameplan
Bull case: Hold/reclaim above 25,871–25,879 → push 25,920.50 then 26,006.00. If momentum stays strong, runner toward 26,083.50–26,106.25.
Bear case: Rejection at 25,871/25,920 → break back under 25,738.75 → target 25,652.75 then 25,615.50. If weakness accelerates, look for the next shelves below.
Rules today: First 15m range + POI retests only. No chasing mid-candle. If spreads/volatility spike → size down.

1/14 Recap – POI Breakdown Day (Bear Trend)
POI map did its job today — market gave us a clear bearish continuation and respected levels like stair-steps.
Key Levels (POIs):
26106.25 / 26083.50 / 26006.00 / 25920.50 / 25871.25
25738.75 / 25652.75 / 25615.50 / 25554.50 / 25538.00
25498.75 / 25464.75 / 25425.25 / 25385.50 / 25356.25 (FVG Mid)
Refs: PDH 26046.25 • PDL 25803.25 • NY AM High 26043 • NY AM Low ~25469.5
How it played:
• Bearish pressure stayed in control → breaks below POIs → retests failed → continuation to next POI.
• Best edge was confirmation + retest, not chasing.
Trades (QQQ 0DTE puts):
1. 618P x2 1.58 → 2.37 (+$158)
2. 617P x1 0.91 → 1.36 (+$45)
3. 614P x1 0.58 → 0.87 (+$29)
4. 613P x1 0.27 → 0.01 (-$26) (late/decay lesson)
Stats: 4 trades | 3W/1L | +$206 | 75% WR
Lesson of the day:
✅ Take the first clean continuation and retest failures at POIs.
❌ Avoid midday/late entries unless there’s a fresh A+ setup (decay eats).
Not financial advice — just journaling + execution review.

1/14 Pre-Market Read - Game plan Pre-market POIs / Game Plan (MNQ 15m)
Key context from the chart:
• We mapped the session range + prior levels and stacked POIs to create a clean “ladder” for targets.
• Important nearby references on your screenshot: Asia High ~25926, Asia Low ~25852.50, London High ~25878.75, London Low ~25701, PDL ~25803.25, and upside POIs.
My POI Ladder (targets)
Upside
• POI 1: 25,871.25
• POI 2: 25,920.50
• POI 3: 26,006.00
• POI 4: 26,083.50
• POI 5: 26,106.25
Downside
• Bear POI 1: 25,738.75
• Bear POI 2: 25,652.75
• Bear POI 3: 25,615.50
How I’m trading it today (simple rules)
Bullish idea
• If price reclaims/holds POI 1 (25,871) and starts holding above POI 2 (25,920) → I’m looking for step-ups into POI 3 (26,006) then POI 4/5.
• Best entries: retest/hold of POI after a breakout candle (confirmation > guessing).
Bearish idea
• If price loses PDL (~25,803) and can’t reclaim, that’s a warning.
• Break + hold below POI 1 (25,871) opens the door to Bear POI 1 (25,738) then Bear POI 2 (25,652).
What to watch at open
• Reaction at POI 1 / POI 2 (they’re your “decision levels”).
• Sweeps into a POI then immediate reclaim = reversal trigger.
• Clean hold above POI = continuation trigger.
Not financial advice — just my plan + levels from my system.

Liquidity Grab into Reversal (PDH / AM High → Sellside Move)1/13 Session Recap — Liquidity Grab into Reversal (PDH / AM High → Sellside Move)
Today’s price action gave a clean, teachable sequence:
Market Structure
• Price pushed into an upside resistance pocket (PDH + upper POI area / AM High zone).
• After the tag, the market showed rejection + displacement down, signaling the reversal was active.
• The rest of the session delivered a sellside expansion into lower levels.
What I looked for
1. Tag of key upside level (PDH / AM High region)
2. Rejection candles / failure to hold above level
3. Shift in momentum → continuation lower
Execution (Options)
I executed the move using QQQ puts and scaled:
• 626P (starter / main)
• 624P and 620P (adds as confirmation strengthened)
Outcome
✅ Clean reversal execution
✅ Scaled entries + profit-taking into the dump
✅ Net: +$165.68
Key takeaway
The edge was NOT predicting — it was waiting for price to reach the level, then reacting to confirmation.
(Educational only, not financial advice.)

Market Re-cap and structure of the dayMarket Type: Breakout → Trend Day Up
Bias: Bullish once PDH reclaimed
Result: + $128 | 4W / 1L
Key Levels I respected
PDH: 25,844.75
NY AM High: ~25,880
POI ladder acted as clean targets + reaction zones (POI4/5/6 area)
What price did today (simple)
Early AM was choppy / ORB filters blocked some entries (good… no forced trades).
Once price reclaimed PDH, it confirmed buyers.
Breakout pushed into NY AM High, then we got continuation candles = the edge window.
Later in the day, entries started showing “too late / low volume” → that’s the sign momentum is extended and risk increases.
My best trades / why they worked
✅ Took longs after PDH reclaim + strength candles
✅ Used POIs as targets, not hope
✅ Stayed with the trend during the best time window
The mistake (and the lesson)
❌ One late trade = reduced edge (post push / extension / “too late” conditions)
Rule reminder: If the system is warning “too late,” either size down or shut it down.
What I’m focused on next session
Wait for PDH reclaim + pullback continuation
Don’t chase after big candles
Trade the clean window, protect the green

All Cylinders Firing: VWAP → Valid Entry → ORB → Expansion (MNQ/Today was one of those “all cylinder's firing” sessions — clean structure and clean execution.
✅ The Blueprint (A+ Sequence)
Retest to VWAP (white line)
Context Indicator prints “Valid Entry” (confirmation)
ORB breakout (market chooses direction)
ORB retest / pullback hold (best risk entry)
Expansion to the upside into targets/POIs
📌 MNQ Read (Structure)
Price respected VWAP/structure and gave a controlled move.
Once momentum started slowing near highs / volume cooled, it wasn’t “press for more” time — it was protecting profit time.
🎯 QQQ Execution (0DTE Scalps)
Took calls only when the sequence lined up with MNQ context.
No chasing. No forcing. Focused on retest entries and profit-taking into strength.
🎓 Teaching Moment
Breakouts are optional — the retest is the paycheck.
If we break ORB but can’t hold the retest, we wait.
If we break ORB and hold the retest with VWAP + Context aligned, we execute with confidence.
Not financial advice — educational purposes only.

Trades with B – Daily Recap (Nov 10 2025)Ticker: QQQ / NQ1!
Strategy: ORB Pro with Filters + 5 min / 15 min Multi-Timeframe Confluence
Result: Green day ✅ (+$97.78 total gain)
🧭 Market Context
The market opened inside an early consolidation range with mixed momentum. The 5-minute chart gave the first confirmation through a clean ORB signal rejection, while the 15-minute held the higher-timeframe structure and kept the EMA slope intact.
The plan today was simple — trade the first valid signal from ORB Pro, confirm with the higher timeframe trend, and respect stops.
🎯 Trade Execution Recap
9:37 AM: First Call entry (ORB signal + fib retest) — caught the initial push before stall. + $172.94
9:44 AM: Locked profits on strength into EMA resistance.
11:14 AM: Put entry after ORB Pro signaled a short on the 5 min matching 15 min trend.
11:40 AM: Exit for + $194.94 after momentum follow-through.
Cumulative Options P/L:
QQQ $618 Put (11/10/25) → + $67.89
QQQ $621 Call (11/10/25) → + $29.89
Net: + $97.78
💡 What Went Right
Followed the ORB signal with confirmation from the higher-timeframe trend filter.
Perfect execution on the Put trade — clean entry and timely exit.
Didn’t overstay the welcome once the move completed.
⚠️ What to Improve
Stay patient for stronger confluence before taking early entries.
Avoid re-entries once price returns to mid-range (less edge after initial break).
🧘♂️ Reflection
“The 5 min showed me the trigger, the 15 min confirmed the story. ORB Pro did its job — I just had to listen.”

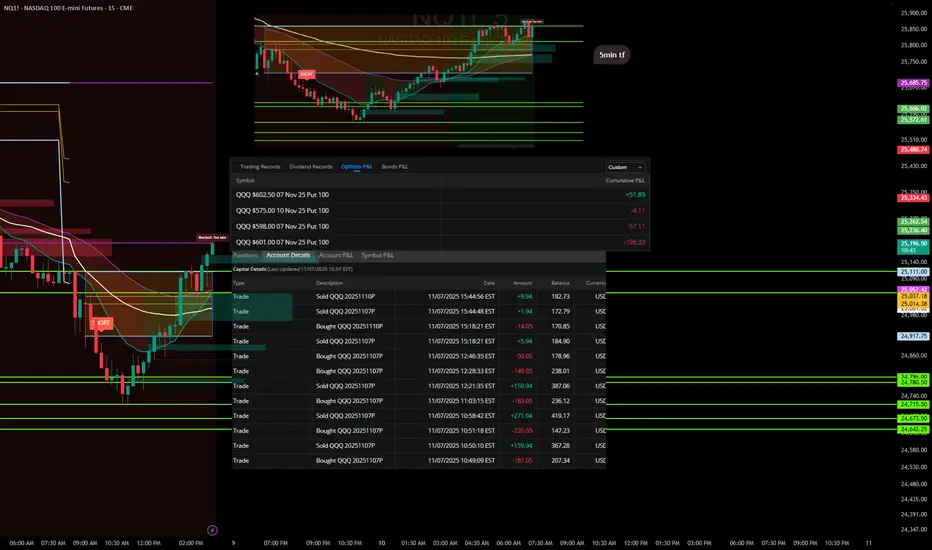
Trades with B – Daily Recap (Nov 7, 2025) "Lesson Learned"Ticker: QQQ / NQ1!
Strategy: ORB Pro + Fib Confluence + EMA Trend Filters
Result: Small red day – self-inflicted
🧭 Market Context
Today’s price action gave a clear short opportunity during the mid-morning fade, but momentum stalled mid-session. The first entries lined up beautifully with the ORB breakdown and EMA confluence, offering solid profits early on.
Where it fell apart was after the first wins — I overstayed, chasing secondary flushes that never came. The market started to base, and I kept expecting continuation instead of taking what the chart gave me.
📉 Trade Summary
Multiple put entries between $601–$602 levels
Early trades locked quick gains (+$271.94, +$159.94)
Gave back a chunk re-entering late into chop
Final P/L across contracts: -$205.66 total
Cumulative Options P/L breakdown:
QQQ $602.50 07 Nov 25 Put – +$51.89
QQQ $575 10 Nov 25 Put – -$4.11
QQQ $598 07 Nov 25 Put – -$57.11
QQQ $601 07 Nov 25 Put – -$196.33
💡 Lessons & Takeaways
The first clean move is often the best move. Don’t overcomplicate a confirmed win.
Late-day trades = low probability. Volume dries up, conviction fades.
Protect the capital, not the ego. There’s no “making up” missed points — only protecting what’s already earned.
🧘♂️ Reflection
“The setup worked, but I didn’t. I tried to extract more from a move that was already complete. Next time, once my target hits, I’m walking away.”
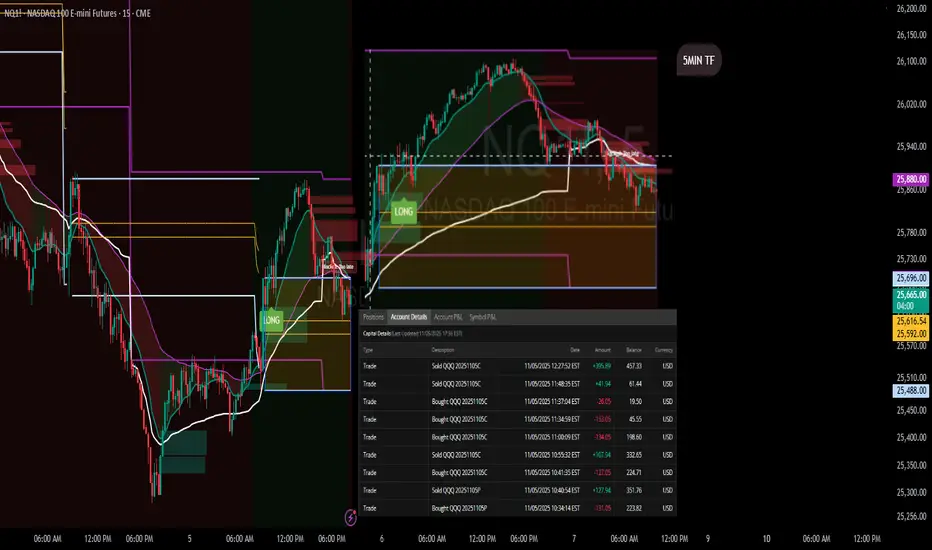
Trades with B – Daily Recap (Nov 6 2025)Ticker: QQQ / NQ1! (5 min & 15 min TF)
Strategy: ORB Pro + Golden Pocket Retest + Volume Filter
Focus: Confirmation Entry + HTF Trend Confluence
🧭 Market Context
The Nasdaq futures (NQ1!) opened with a sharp push into a key supply zone marked by the previous day’s Golden Pocket.
After an early fake push up, the market rolled over cleanly beneath the EMA cluster and the ORB box on both timeframes.
The first true confirmation signal came mid-morning — the 15 min and 5 min timeframes synced short, and the volume aligned perfectly with trend continuation.
🧠 Trade Review
Entry: 11:02 EST QQQ $613 Put (ORB Pro Short Trigger)
Exit: 11:35 EST — ORB extension target hit → secured profit into momentum flush
System Validation: Perfect alignment across EMA trend + HTF bias + retest rejection signal
P/L: +$199.78 net profit ( + $289.94 closed gain – $190.05 entry cost )
This trade was clean — confirmation entry, defined risk, and no over-trading.
📊 Performance Snapshot
Metric Value
Win Rate 100 % (today’s single trade)
Best Trade +$289.94
Largest Loss – $190.05
Net Result +$199.78 (Realized)
Setup Accuracy Excellent – Full confirmation alignment
📈 Chart Breakdown
The ORB Pro short triggered as price retested the upper Golden Pocket zone and failed to hold above the purple EMA band.
Both the 15 min and 5 min charts show a clean EMA curl-down with volume confirmation.
The short target zone was hit precisely before a small midday bounce, validating the system’s filter timing.
💡 Key Takeaways
Wait for alignment – when HTF and LTF agree, you get momentum moves.
Clean entry > early entry – confirmation beat anticipation again.
ORB Pro filter precision – blocked late entries, protecting the green.
🧘♂️ Reflection
“The setup was textbook — patience finally paid off. One trade, one signal, and one profit. The goal now is simple: keep filtering for these perfect alignments and size up responsibly as consistency builds.”
🧩 Next Steps
✅ Focus only on HTF + LTF confirmation signals
✅ Avoid re-entries once target zone is hit
✅ Document each setup screenshot for pattern library

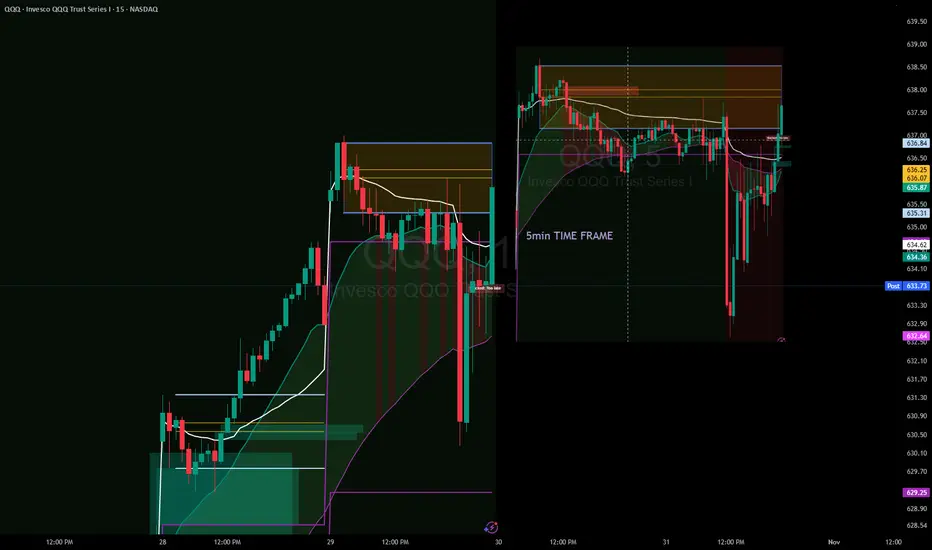
ORB Pro Signal Recap – Nov 5, 2025 | “Respect the Levels”Ticker: QQQ / NQ1! (5-min + 15-min TF)
Strategy: ORB Pro + Trendline Breakdown + Previous Day High Rejection
Focus: Signal confirmation & reaction zones
🧭 Market Context
The morning started strong, with buyers pushing off the open toward the previous day’s high (PDH) and ORB extension zone.
As price tapped the upper band, the ORB Pro system generated a clean long confirmation, aligned with the higher timeframe momentum.
But the rally quickly stalled at the PDH — a textbook reaction zone where the structure shifted.
From there, trendline breakdowns on both 5-min and 15-min charts confirmed exhaustion, and the system correctly prevented new long entries once momentum failed.
💹 Trade Breakdown
Initial Long: Taken on ORB Pro signal confirmation near the intraday retest (strong follow-through into PDH).
Profit-Take Zone: Price rejected sharply at the PDH and VWAP cluster — partials locked.
No Chasing: After the rejection, ORB Pro flagged “Blocked / Too Late,” keeping risk managed while trend flattened.
Result: Finished the day green with multiple small wins across calls — +$89.68 net on the $623C and +$15.89 on $626C.
📊 Performance Summary
Symbol Side Contracts Net Result
QQQ $623C Long 2 +$89.68
QQQ $626C Long 1 +$15.89
QQQ $622P Short hedge 1 –$3.11
Total P/L + $102.46 (Realized)
📈 Chart Recap
Price pushed through the early range with momentum but stopped exactly at the previous day’s ORB high and Fib confluence.
That rejection aligned perfectly with the HTF resistance zone on both 5-min and 15-min TFs.
The chart shows two green “LONG” entries and a clean signal fade once volume dropped —
a prime example of respecting structure over bias.
💡 Key Takeaways
PDH = Reaction Zone: Don’t ignore prior highs — they mark algorithmic defense zones.
Trust the Filters: ORB Pro prevented chasing the failed continuation after PDH rejection.
Structure First: The trendline breakdown confirmed what price was already telling us.
🧘♂️ Reflection
“The system signaled the move early, and I followed structure. PDH rejection confirmed the top, and discipline locked the profit. The goal wasn’t to predict — it was to react with control.”
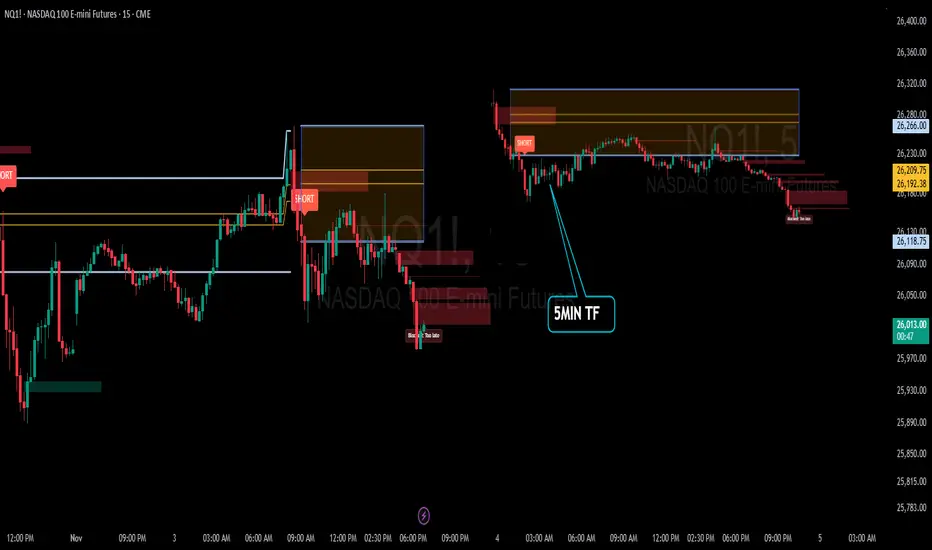
Recap: ORB Pro in Action | “Discipline > Direction”Date: November 3rd 2025
Ticker: QQQ / NQ1! (5-min TF)
Strategy: ORB Pro + Golden Pocket Retest + Volume Filter
Focus: Trend confirmation & controlled execution
🧭 Market Context
The morning opened sideways inside the ORB range — no clean conviction early on.
Around mid-morning, sellers gained control as lower highs formed beneath the EMA band and the Golden Pocket retest (0.5/0.618) failed with volume confirmation.
That break produced the clean short setup of the day, perfectly aligned with the higher-timeframe (HTF) downtrend.
🧠 Trade Review
Early Entries: Entered pre-confirmation and took initial heat.
Mid-Morning Setup: All filters aligned — EMA, volume, HTF direction. This was the textbook short that delivered follow-through.
Late Session Attempts: Momentum faded after lunch, with signals correctly blocked as “Too Late.”
Result: Several small wins offset by early losses, closing the day + $7.34 realized P/L after fees.
📊 Performance Snapshot
Metric Value
Win Rate ≈ 42 %
Best Trade + $287.94
Largest Loss – $189.05
Net Result + $7.34 (Realized)
Setup Accuracy High — execution mixed
📈 Chart Breakdown
The 5-minute chart highlighted a short trigger around 26 260 – 26 280, with smooth continuation into ORB extensions.
The ORB Pro filter marked “Blocked / Too Late” after the move — confirming that the system logic protected capital from late chases.
💡 Key Takeaways
Patience > Prediction — early entries rarely pay off.
Protect Green — partial profit lock once 1 R:R is reached.
System Strength — ORB Pro continues to validate structure when filters align.
🧘♂️ Reflection
“The system nailed the move — I jumped early. Still finished green, proving that execution discipline is the real edge. Tomorrow’s goal: one clean setup, one confident hold, and protect the profit.”
🧩 Next Steps
✅ Wait for full confirmation before entry
✅ Hold until 1:2 R:R min
✅ Avoid re-entries once HTF zone is tapped
Daily Recap – The Patience Play (QQQ ORB Setup)Fellow traders,
Today was one of those sessions that remind us: sometimes the best trade is no trade at all.
The morning ORB (9:30 – 9:45 NY) gave us a wide initial range with very little conviction in either direction. We saw price flirt with both edges, but no candle could close decisively outside the box. Each push quickly reversed, leaving nothing but wicks and false momentum.
Volume stayed neutral and the EMAs never truly separated — a classic sign of indecision. Even the higher-timeframe (30-min) trend stayed flat, confirming there was no clean alignment to give us the confidence we needed.
Mid-session, price finally poked above the ORB high — but it immediately failed and rolled right back into the range. Later in the day, the real move came to the downside… well past the optimal ORB window. By then, discipline meant staying out.
👉 No setup, no entry — and that’s perfectly fine.
The goal isn’t to trade every day; it’s to trade only when probability lines up.
Tomorrow, we reset with the same rules:
Wait for a clean break and retest outside the ORB.
Confirm volume and trend.
Let the market come to us.
Stay patient, stay disciplined, and remember — consistency is built on the days you don’t force it.
— Trades with B
RECAP TODAY. USING THE SIGNALS AND TOOLS Fellow traders - followers,
I have some today to recap on the day.
Now I will say this. Today went the way they said it would go UP! All the overnight new, the morning media and the tech headlines all made today a profitable day for the bulls! I will also say this: it is a scary situation, because we have no resistance levels up here, so where does all this up trend movement stop? What do we know or where to put our stop losses?
In building these indicators, I'm learning a few things. I'm learning more about myself and about what to look for exactly. There will be days where I will lose. Just like Friday: -$280! The price action was just not as consistent and friendly like it was today.
Let me break down today:
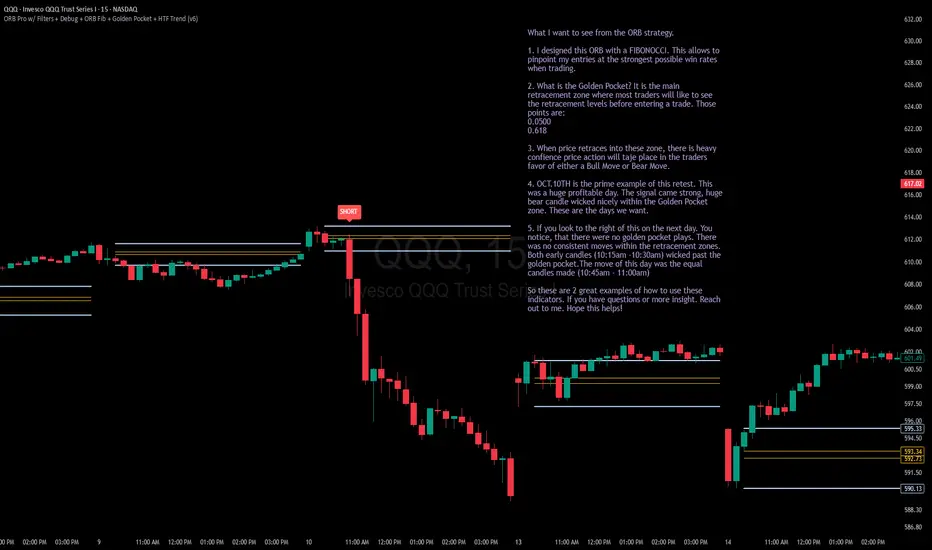
1. I attached the 5min chart to show you what the " Golden Pocket " of my indicator resembles.
A confirmation of price action and direction.
It reacted perfectly. 10:15am Bear candle - 10:20am Bull Doji inside pocket - 10:30am Engulfing Bull candle with a long signal! You couldn't ask for a better set up to the upside to make your money!
2. The 15min time frame was a little more of a bulky solid read. Bull candles with wicks.
The 10:15am candle carried the long signal with it. The wick within that candle was our 5min candles playing out.
Weather you waited for the 15min plays or you entered in the 5mins. You won.
3. So, with all this, there is another indicator I play. That is my 0dte Context bundle. How this works in our favor is that in this specific situation you want to make sure your trends are moving where they need to go. The EMA, SMA and VWAP lines all had same up direction. The Green EMA/SMA Cloud all indicated up is where it's going.
You have the tools to assist in decisions. If you need more help with reading these indicators. Let me know. I'm always down to help out.
Patient is still key. Confirmations are still key. Remember that when trading. Do not get antsy and enter in trades that are not strong or that will not check all your entry boxes.
Thank you again for the follows and the support. I hope these are helpful.
God Bless,
Trades with B!

Some notes to reflect on. A little how to for the indicatorHey everyone,
Hope you guys & gals are doing well using these indicators. I'm publishing a chart that I wrote some notes for. Notes are offering some insight on what look for when using this indicator. If you have any questions, let me know. I am planning to get videos up soon when I get some extra free time.
Thank you again for the support!
NQ Power Range Report with FIB Ext - 6/24/2025 SessionCME_MINI:NQU2025
- PR High: 22217.00
- PR Low: 22065.75
- NZ Spread: 337.75
Key scheduled economic events:
10:00 | CB Consumer Confidence
- Fed Chair Powell Testifies
Session Open Stats (As of 12:35 AM 6/24)
- Session Open ATR: 384.68
- Volume: 45K
- Open Int: 240K
- Trend Grade: Neutral
- From BA ATH: -2.8% (Rounded)
Key Levels (Rounded - Think of these as ranges)
- Long: 22096
- Mid: 20383
- Short: 19246
Keep in mind this is not speculation or a prediction. Only a report of the Power Range with Fib extensions for target hunting. Do your DD! You determine your risk tolerance. You are fully capable of making your own decisions.
BA: Back Adjusted
BuZ/BeZ: Bull Zone / Bear Zone
NZ: Neutral Zone

US30 BUYwe are currently in a US30 long, we are using the 15min ORB clean break and retest of the range we have also retested the previous day high, put stops at the low of the range, we target 1-1.5 RRR lets see how it goes

ORB Breakout PullbackWaiting for SPY to break my 15 min ORB on the 5 and/or 15 min time-frame then I'll enter on pullback if it holds, especially if it hold at the 9 EMA, Volume supports and the VIX is inline as well. If VIX up SPY down and vice versa. Also, will confirm on 30 min timeframe for more confirmation. Let's see. Patience is key.

Is ORBS/USDT Poised for a Massive Breakout? Don't Miss Yello, Paradisers! Are you ready for some potential big moves with ORBSUSDT? Let's dive into the analysis to see what's brewing!
💎#ORBS is currently showing signs of a probable bullish continuation from a support zone at $0.02415. We've observed ORBS following a descending channel for quite some time. Recently, after breaking above the descending resistance, it's gaining momentum at this key support level.
💎If the price holds strong at this level, there's a high probability of a bullish rally, similar to previous trends. A breakout above the probable resistance at $0.03323 could lead to targeting the next resistance zones and beyond. However, if the momentum doesn't hold at the key support, we might see a bullish rebound from the lower support area around $0.01821.
💎It's crucial to stay vigilant and monitor #ORBS price movements closely. A daily closure below the support area could invalidate the bullish outlook and potentially lead to further declines.
💎Remember, Paradisers staying disciplined and patient is key in these volatile markets. Consistently profitable trading comes from waiting for the best opportunities. Stay focused and avoid emotional decisions!
MyCryptoParadise
iFeel the success🌴

Timely Opening Range Breakout Strategy (TORB)Today, I’ll tell you about an amazing research study back from 2019 by a team of Taiwanese researchers, “Assessing the Profitability of Timely Opening Range Breakout on Index Futures Markets.”
Takeaway: The study's results are compelling. Implementing the TORB strategy yielded over 8% annual returns across the tested markets. Remarkably, the TAIEX index showcased a staggering 20.28% annual return. These numbers underline the potential of TORB in maximizing trading gains.
█ What is Open Range Breakout?
Open Range Breakout (ORB) is one of the simplest and safest strategies day traders use in a relatively low-volatility market. Opening Range means exactly just that. You check an asset's highest and lowest price in a certain time frame (usually 15 to 60 minutes) from the market's opening time.
These levels become your resistance and support that guide your trading plan for that day. Say if your chosen stock price goes higher than the highest level after the opening range; it indicates a bullish run for the day. Conversely, it indicates a bearish run if the price loses support in a downward trend.
█ Timely Opening Range Breakout Strategy
ORB has a certain set of challenges, especially for volatile markets. The Timely Open Range Breakout (TORB) strategy has been proposed in response to these challenges.
TORB leverages high-frequency intraday data and aligns trading strategies with the active hours of the underlying stock markets.
By analyzing one-minute intraday data from 2003 to 2013 across various markets, including DJIA, S&P 500, NASDAQ, HSI, and TAIEX, the study by Yi-Cheng Tsai et al. demonstrates the effectiveness of this strategy.
The key lies in identifying the 'active hours' of the market, aligning with the opening range of the underlying index.
█ 1. PMMV and PMVR:
The research paper introduces two critical variables for the TORB strategy: Per-Minute Mean Volume (PMMV) and Per-Minute Variance of Return (PMVR). These metrics are essential in identifying the most active hours for futures market trading.
PMMV provides a snapshot of the market's activity level at each minute of the trading day. PMVR is crucial for understanding the volatility or the degree of fluctuation in the market at each minute.
PMMV (Per-Minute Mean Volume) is calculated by averaging the trading volume in a one-minute interval over a specified number of trading days.
The graph shows that the German 40 is most active during the London opening and 30 minutes into the New York opening.
PMVR (Per-Minute Variance of Return) measures the variance of the one-minute returns, calculated as the logarithmic difference between the closing prices of one-minute intervals.
Using PMVR, the German 40 is most active during the London opening session and approximately one hour into the New York session.
█ 2. TORB Trading Rules:
Basic ORB trading rules are applied here.
Buying pressure dominates if the price moves above the resistance level, suggesting potential upward price movement. Conversely, selling pressure prevails if the price falls below the support level, indicating a possible downward trend.
These rules are applied within the active trading hours, defined by the PMMV and PMVR metrics.
Buy Signal
Sell Signal
The strategy also defines three key time points: the beginning of the observed period, the end of the observed period (probe time), and the time of closing the position. The prices at these specific times determine the conditions for buying and selling.
█ 3. Data Sets:
The study utilized two main datasets for its experiments:
Intraday Data of Five Futures Markets: This dataset includes one-minute intraday data of the E-mini futures of the DJIA, S&P 500, NASDAQ 100, HSI (Hong Kong), and TAIEX (Taiwan). The period covered ranges from 2001/2003 to 2013, providing a comprehensive overview of these markets over a decade.
Transaction Data for TAIEX Index Futures: This dataset contains detailed transaction data for the TAIEX index futures, covering the period from 2006 to 2013. It analyzes the relationship between TORB signals and trader behavior in the Taiwanese market.
Interestingly, the research even considers the global financial crisis of 2007-2008, presenting test results for two sub-periods: before and after 2007. This approach ensures a thorough understanding of the strategy's performance across different market conditions.
█ Results and Analysis
1. TORB Profitability Test:
The TORB profitability test involved back-testing the strategy for the five futures markets.
DJIA, S&P, and NASDAQ results revealed that strategies with probe times in the early stages yielded significantly higher annual returns.
DJIA: The results showed that TORB transactions decreased as the probe time moved away from the beginning of active hours. This implies that the strategy was most effective when applied close to market opening times.
S&P and NASDAQ: Similar to the DJIA, these markets also showed that strategies with early-stage probe times earned higher annual returns.
Additionally, the TAIEX results demonstrated that TORB strategies earned significantly higher returns with probe times of less than 200 minutes.
2. Impressive Returns:
The study's results are compelling. Implementing the TORB strategy yielded over 8% annual returns across the tested markets. Remarkably, the TAIEX index showcased a staggering 20.28% annual return. These numbers underline the potential of TORB in maximizing trading gains.
It also found that the best probing times were shorter in the U.S. markets and longer in Asian markets.
The research demonstrated that TORB strategies yielded consistently higher returns than traditional TRB (Trading Range Breakout) strategies, with no significant results in profitability tests for all TRB strategies across the five futures markets.
To provide a clear picture, here's a summary of the daily returns for each market analyzed:
E-mini DJIA: See Table 1 from the research paper
E-mini S&P: See Table 2 from the research paper
E-mini NASDAQ and HSI: See Tables 3 and 4 from the research paper
TAIEX: See Table 5 from the research paper
The active hours, identified by peaks in PMMV and PMVR, played a crucial role in the strategy's success.
For instance, the E-mini DJIA showed peaks around 8:30 AM and 3:15 PM, coinciding with the opening and closing times of the underlying market. Similarly, peaks were observed for HSI around the opening, closing, and lunch break times.
█ Relationship Between TORB Signals and Trader Behavior
The study also examined the relationship between TORB signals and trader behavior, particularly in the TAIEX futures market.
It was observed that the daily volume for individual traders was about twice that for institutional traders. The returns of the TORB strategies were positively related to the net buy positions of institutional traders both before and after the breakout.
This suggests that by following the TORB signals, one could trade in the same direction as institutional traders and obtain positive returns.
Specifically, the returns of the TORB strategies were significantly and positively related to foreign investment institutions, both before and after the breakout, indicating that TORB signals align with the trading direction of the most informed traders in the Taiwan market.
█ Reference
Y.-C. Tsai, M.-E. Wu, J.-H. Syu, C.-L. Lei, C.-S. Wu, J.-M. Ho, and C.-J. Wang, "Assessing the Profitability of Timely Opening Range Breakout on Index Futures Markets," IEEE Access, vol. 7, pp. 32061- 32071 Mar. 2019.
-----------------
Disclaimer
*Our results are approximate. We encourage you to test the assumption yourself. We do not guarantee that you will get the same results. This is an educational study for entertainment purposes only.
The information in my Scripts/Indicators/Ideas/Algos/Systems does not constitute financial advice or a solicitation to buy or sell securities. I will not accept liability for any loss or damage, including without limitation any loss of profit, which may arise directly or indirectly from the use of or reliance on such information.
All investments involve risk, and the past performance of a security, industry, sector, market, financial product, trading strategy, backtest, or individual's trading does not guarantee future results or returns. Investors are fully responsible for any investment decisions they make. Such decisions should be based solely on evaluating their financial circumstances, investment objectives, risk tolerance, and liquidity needs.
My Scripts/Indicators/Ideas/Algos/Systems are only for educational purposes!
