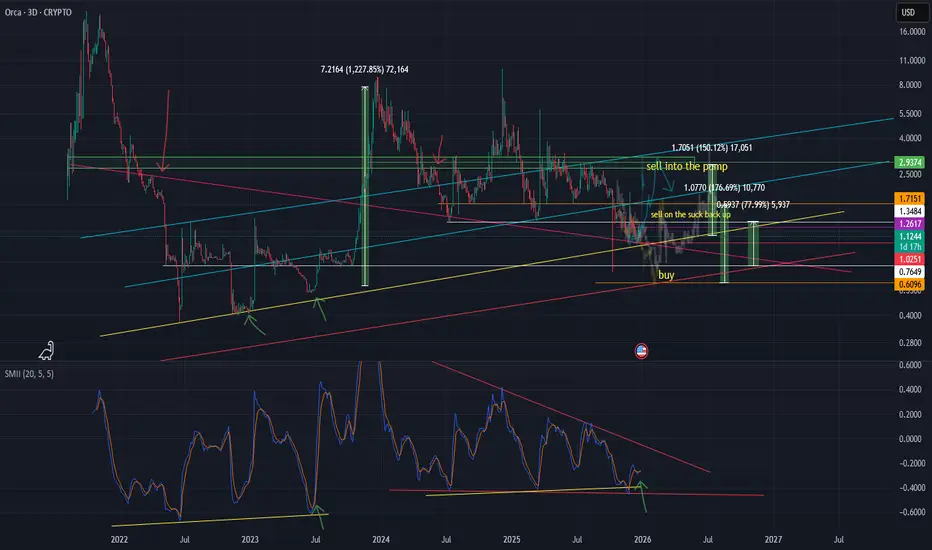
Orca - The Crypto Whale SanctuaryOrca - The Crypto Whale Sanctuary
plan is to see if the price action turns to poo here, ie doesn't just green di$$o right to the sanctuary. should be reasonably obvious. edging higher like this and ramping is good.
momentum is trending up on higher time frames. could be good.
btc looking very scary bad. so theres that on the negative bias.
if it is a pump its a sell-into one imo.
risky
ORCA
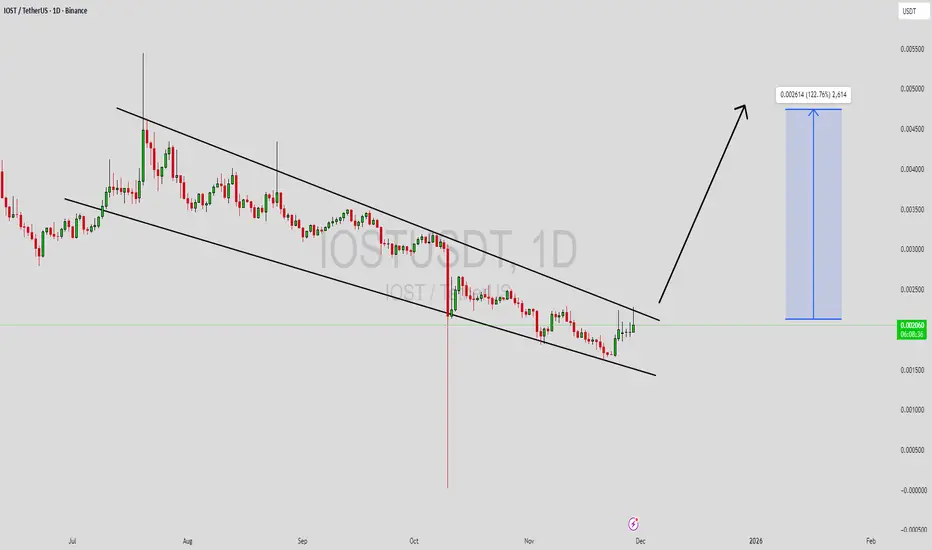
ORCAUSDT Forming Falling WedgeORCAUSDT is forming a clear falling wedge pattern, a classic bullish reversal signal that often indicates an upcoming breakout. The price has been consolidating within a narrowing range, suggesting that selling pressure is weakening while buyers are beginning to regain control. With consistent volume confirming accumulation at lower levels, the setup hints at a potential bullish breakout soon. The projected move could lead to an impressive gain of around 90% to 100% once the price breaks above the wedge resistance.
This falling wedge pattern is typically seen at the end of downtrends or corrective phases, and it represents a potential shift in market sentiment from bearish to bullish. Traders closely watching ORCAUSDT are noting the strengthening momentum as it nears a breakout zone. The good trading volume adds confidence to this pattern, showing that market participants are positioning early in anticipation of a reversal.
Investors’ growing interest in ORCAUSDT reflects rising confidence in the project’s long-term fundamentals and current technical strength. If the breakout confirms with sustained volume, this could mark the start of a fresh bullish leg. Traders might find this a valuable setup for medium-term gains, especially as the wedge pattern completes and buying momentum accelerates.
✅ Show your support by hitting the like button and
✅ Leaving a comment below! (What is your opinion about this Coin?)
Your feedback and engagement keep me inspired to share more insightful market analysis with you!

ORCA/USDT — Symmetrical Triangle Apex: The Calm Before the Storm🔎 Chart Overview
ORCA/USDT has been forming a massive Symmetrical Triangle since early 2024. The pattern is defined by lower highs (gradual selling pressure) and higher lows (steady accumulation by buyers). This represents a phase of tight consolidation, and as the price approaches the apex, the probability of a strong impulsive move ahead increases dramatically.
Currently, the price trades around 2.41 USDT, right inside the demand zone at 2.3 – 2.6 (yellow box). This zone has acted as a critical support multiple times since 2024, making it the key battleground for the next directional move.
---
🔼 Bullish Scenario (Breakout)
Trigger: A confirmed 4D candle close above the descending trendline and reclaim of the 3.00 – 3.41 USDT zone.
Confirmation: A breakout accompanied by rising volume would signal strong bullish momentum.
Upside Targets:
🎯 3.41 (first key resistance)
🎯 5.20 (psychological level)
🎯 7.48 (historical resistance)
🎯 9.90 (ATH / ultimate mid-term target)
Invalidation: A breakdown and 4D close below 2.3 USDT would invalidate the bullish setup.
---
🔽 Bearish Scenario (Breakdown)
Trigger: A breakdown below the 2.3 – 2.6 demand zone and loss of the ascending trendline support.
Downside Targets:
🛑 1.60
🛑 0.90
🛑 0.42 (historical Low) if capitulation unfolds.
Invalidation: A swift reclaim above 2.3 – 2.6 and re-entry into the triangle structure.
---
📌 Pattern Implications
The Symmetrical Triangle is a neutral pattern, but once a breakout occurs near the apex, it often leads to powerful trending moves.
The closer the price gets to the apex, the less time remains before volatility spikes.
Volume expansion will be the most reliable confirmation to separate a genuine breakout from a fakeout.
---
🎯 Extra Insight
The 2.3 – 2.6 demand zone is more than just support — it’s a strategic accumulation area where buyers have consistently defended their ground.
Holding this zone and breaking the descending resistance could trigger a multi-month rally.
Conversely, losing this zone could push ORCA into a capitulation phase before the next major cycle begins.
#ORCA #ORCAUSDT #Crypto #Altcoins #Breakout #PriceAction #TrianglePattern #TechnicalAnalysis #BullishScenario #BearishScenario

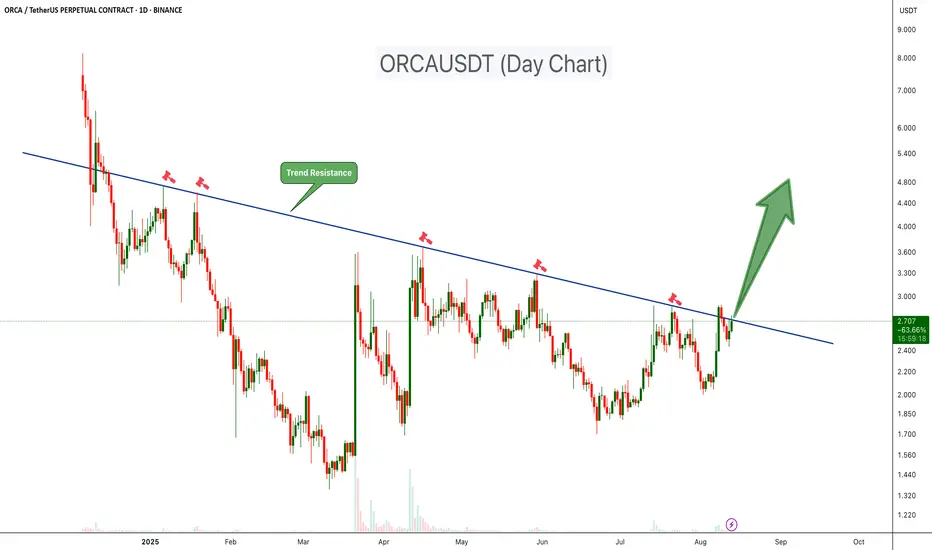
ORCAUSDT at Key Trendline: Big Move Loading!ORCAUSDT has been trading under a clear descending trendline resistance since late 2024, with multiple failed breakout attempts marked by sharp rejections. This trendline has consistently acted as a strong supply zone, pushing prices lower each time it was tested.
Key Points:
-Trend Resistance: Price is once again testing the long-term descending trendline. This level has rejected rallies multiple times in the past (January, March, May, and early August 2025).
-Volume Pickup: Recent price action shows increasing bullish volume, suggesting growing buying pressure as the resistance level is approached.
-Potential Breakout Setup: A strong daily close above $2.90 could signal a confirmed breakout, flipping long-term resistance into support.
Upside Target: If a breakout is confirmed, we could expect a 50%-200% move coming weeks
Risk Factor: A rejection from this zone could see price revisit support at $2.20–$2.00 before any renewed attempt higher.
Buy Level: Above $2.90 (After daily breakout)
ORCA is at a crucial decision point. This is the fifth test of the descending trendline since early 2025; a breakout now could trigger a significant bullish move, while another rejection may extend the consolidation phase.
Cheers
Hexa
ORCA/USDT NEW VOLUME ENTERYORCA shows for the first time in long time ago a new volume uptrend, which can get confirmed in the next hours to a new volume.
When there are new confirmations or updates, they will be listed here below.
If there is new confirmations coming, we could see this coin soon to targets
$3.17
$4.20
Best target $5
The trend study shows there is new interest in ORCA
Orca Moving Fast, Altcoins Market Heats Up (Easy 275% PP)Think fast, act fast, move fast! The altcoins market is heating up and it is not for the faint hearted. Either you take action now, fast, or the market moves away. Low prices to be available never again...
Good afternoon my fellow Cryptocurrency trader, I hope you are having a wonderful day.
A bull market means up. It means growth, up, up, up, up and then higher. Yes, some pairs will retrace but that is because these pairs already moved ahead. Once the action stops on one group, another group moves forward and this pattern will continue to repeat long-term. What this means is that there will always be something going up. And this is awesome if you are a trader as more opportunities become available every single day.
Here ORCAUSDT is already bullish, we have the higher low and the full green candle above EMA55 on the daily timeframe. This is as good as it gets. An advance is confirmed so this becomes an easy hold. But, since we are looking at it short-term, after our target hits we collect profits and move on.
Not all trades are short-term not all trading works this way. We have long-term chart setups, leveraged positions, short-term spot and so on. Make sure not to confuse one with the other to avoid mistakes.
Some projects we catch the bottom and let the bull market unravel, others we enter "in-the-action" collect profits and move on.
Whichever way works for you, that's up to you. Some people like to be relaxed while trading others want to take action.
Thanks a lot for your continued support.
Namaste.

ORCAUSDT Forming Symmetrical Triangle ORCAUSDT is currently forming a symmetrical triangle pattern on the daily chart, a technical setup that often signals strong breakout potential. This type of consolidation pattern typically indicates a period of indecision that could lead to a significant price move once a breakout occurs. With ORCA trading at the apex of the triangle and volume gradually increasing, a bullish breakout looks increasingly probable in the near term.
The volume profile supports the idea of a coming rally, as we see accumulation within the pattern and recent volume spikes suggesting renewed investor interest. ORCA’s fundamentals and recent market developments are also attracting attention from both retail and institutional players. If the upper trendline of the triangle is broken convincingly, we could expect a 40% to 50% upward surge, potentially reaching near the $4.50 zone.
Technical traders are watching closely, especially with broader market sentiment improving across altcoins. ORCA’s formation of higher lows within the triangle adds confidence to the bullish thesis. The symmetry of the pattern and breakout projection aligns with historical moves in similar market conditions, reinforcing the anticipated gain targets.
Given its current technical posture, ORCAUSDT presents a high-reward setup. A confirmed breakout could trigger momentum buying, driving price rapidly toward the target. Stay vigilant and watch for confirmation signals like increasing volume and a strong close above resistance.
✅ Show your support by hitting the like button and
✅ Leaving a comment below! (What is You opinion about this Coin)
Your feedback and engagement keep me inspired to share more insightful market analysis with you!

ORCA Buy/Long Setup (4H)The ORCA structure is bullish and shows strong bullish momentum. Therefore, we can look for buy/long positions at the origins of the moves.
We have identified two entry points on the chart, where we will be looking for buy/long setups.
Target levels are marked on the chart.
A daily candle closing below the invalidation level will invalidate this analysis.
Do not enter the position without capital management and stop setting
Comment if you have any questions
thank you

ORCAUSDT – First Support at the Blue Box!🐋 ORCAUSDT – First Support at the Blue Box! 🚀
“Patience is key—the blue box is our first support area, but confirmation is everything!”
🔥 Key Insights:
✅ Blue Box = First Support Zone – A reaction here could be a strong buy signal.
✅ No Blind Entries! – We wait for CDV, LTF breakouts & volume confirmation.
✅ If Support Holds, Expect a Strong Bounce – Otherwise, we wait for the next level.
💡 The Smart Plan:
Monitor Price Action at the Blue Box – Buyers must step in.
Wait for Market Structure Break on LTF – No breakout = No trade.
CDV & Volume Profile Must Confirm Strength – We only follow smart money.
“Discipline wins. If confirmation comes, we strike—otherwise, we wait.” 📈🔥🐋
A tiny part of my runners:
🎯 ZENUSDT.P: Patience & Profitability | %230 Reaction from the Sniper Entry
🐶 DOGEUSDT.P: Next Move
🎨 RENDERUSDT.P: Opportunity of the Month
💎 ETHUSDT.P: Where to Retrace
🟢 BNBUSDT.P: Potential Surge
📊 BTC Dominance: Reaction Zone
🌊 WAVESUSDT.P: Demand Zone Potential
🟣 UNIUSDT.P: Long-Term Trade
🔵 XRPUSDT.P: Entry Zones
🔗 LINKUSDT.P: Follow The River
📈 BTCUSDT.P: Two Key Demand Zones
🟩 POLUSDT: Bullish Momentum
🌟 PENDLEUSDT.P: Where Opportunity Meets Precision
🔥 BTCUSDT.P: Liquidation of Highly Leveraged Longs
🌊 SOLUSDT.P: SOL's Dip - Your Opportunity
🐸 1000PEPEUSDT.P: Prime Bounce Zone Unlocked
🚀 ETHUSDT.P: Set to Explode - Don't Miss This Game Changer
🤖 IQUSDT: Smart Plan
⚡️ PONDUSDT: A Trade Not Taken Is Better Than a Losing One
💼 STMXUSDT: 2 Buying Areas
🐢 TURBOUSDT: Buy Zones and Buyer Presence
🌍 ICPUSDT.P: Massive Upside Potential | Check the Trade Update For Seeing Results
🟠 IDEXUSDT: Spot Buy Area | %26 Profit if You Trade with MSB
📌 USUALUSDT: Buyers Are Active + %70 Profit in Total
🌟 FORTHUSDT: Sniper Entry +%26 Reaction
🐳 QKCUSDT: Sniper Entry +%57 Reaction
📊 BTC.D: Retest of Key Area Highly Likely
I stopped adding to the list because it's kinda tiring to add 5-10 charts in every move but you can check my profile and see that it goes on..

ORCAUSDT(ORCA) Updated till 21-03-25ORCAUSDT(ORCA) Daily timeframe range. we can see a massive pump today, peoples filled their bags. alltho the pump retraced if PA can stay above 2.578 it can pull back to 4.433. local support still at 1.446.

Just In: $ORCA Surged Nearly 300% Today Amidst a Falling Wedge Orca ( LSE:ORCA ) one of the first general-purpose AMMs launched on Solana where users can swap assets, provide liquidity, and earn yield through an easy-to-use interface saw its native token ( LSE:ORCA ) spike nearly 300% today amidst a bullish pennant that has been formed on the first week of December 2024.
This steep falling wedge that has occurred last year led to LSE:ORCA losing about 78% of market value, causing a liquidity sweep and low demand for LSE:ORCA which made the token to undergo about 3 months of consolidation phases.
As of the time of writing, LSE:ORCA has cool-off consolidating to the $0.0214 support point with the Relative Strength Index (RSI) at 62 this is a healthy state for LSE:ORCA to form a demand territory for buyers to step in.
Orca Price Live Data
The live Orca price today is $2.89 USD with a 24-hour trading volume of $554,878,139 USD. Orca is up 83.76% in the last 24 hours, with a live market cap of $161,365,451 USD. It has a circulating supply of 55,776,561 ORCA coins and the max. supply is not available.

ORCAThis currency is likely to fall another 25%
It is a very good opportunity to buy and hold
My price prediction for this currency in a bullrun 2025 is $8-$10

Immediate Scalp Short On OrcaOrca Heavy pump deserves a small pullback and we will utilise it for short. Let's bring that dip in...

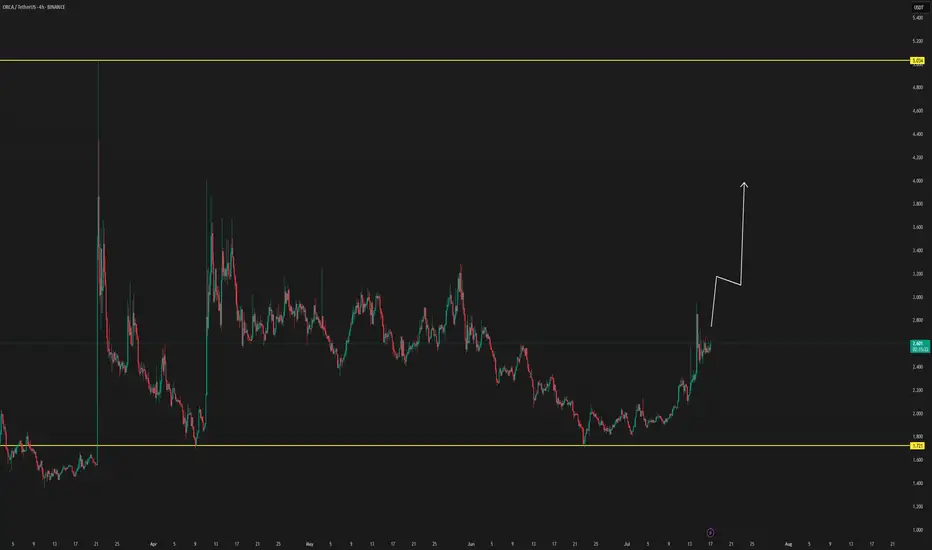
$ORCA ready for next leg to $5.66-$6.15?Orca has been consolidating inside of a bull flag and looks like it's set to break higher here.
Should we see a move above $3.80, we should see the next leg continue up to $5.66 - $6.15.
Invalidation below $3.10.

Orca is Set to Flip Ray!COINBASE:ORCAUSD 🐋 BINANCE:SOLUSDT KRAKEN:RAYUSD COINBASE:SOLUSD BITSTAMP:BTCUSD
Orca is on track to surpass Raydium (RAY) as the top DEX in the Solana ecosystem! With an incredibly user-friendly interface, rapidly growing trading volume, and a limited token supply, Orca is attracting more users and major investors daily. Orca not only delivers speed and efficiency but also provides incentives that make it the favored choice among DeFi traders, setting the stage to flip Ray very soon!
Why Orca Will Flip Ray:
Superior Interface and User Experience: Orca makes DeFi accessible to everyone, whereas Raydium remains more technical and less user-friendly.
Growing Volume and Liquidity: Orca’s volume is rising fast, a clear sign that the market is shifting in its favor.
Attractive Tokenomics: With only 55 million tokens, Orca’s scarcity offers greater potential for value growth than Raydium.
Incentives and a Community Focused on Growth: Orca invests in its community with incentives that boost engagement and sustainable growth.
Orca is solidifying itself as the premier DeFi opportunity on Solana, and the anticipated flip of Ray is only a matter of time.
Get ready to see this DEX revolutionize the ecosystem!

Orca DEX: The Next Big Opportunity in the Solana EcosystemCOINBASE:ORCAUSD BINANCE:BTCUSDT COINBASE:BTCUSD BINANCE:SOLUSDT COINBASE:ETHUSD
Orca is gaining impressive momentum, fueled by the rapid expansion of the Solana ecosystem! 🌐 As one of the most promising decentralized exchanges, Orca boasts incredible trading volume compared to its market cap, capturing the attention of investors worldwide. With a limited token supply and a growing community, Orca might be on the verge of breaking barriers and reaching new highs! 📈
📊 Technical Signals:
High entry volume, indicating strong market interest
Potential for growth on an upward trajectory, especially with the expansion of the Solana ecosystem
Limited token supply supporting rapid value appreciation 🚀
⚠️ Why Orca? Orca isn’t just another DEX; it’s a platform that combines speed and usability in DeFi, aiming to become a cornerstone of the Solana network. Now’s the time to watch closely and consider positioning yourself while the token remains accessible!
💥 $100 Target in Sight? With growing volume and adoption, we could see Orca hitting the $100 milestone soon. Don’t miss the chance to follow one of the market’s most promising tokens. #Orca #SolanaEcosystem #DeFi #ToTheMoon #Orca100

$ORCA to 41x in the near future?Looking at the Logarithmic chart, LSE:ORCA seems to have been at a down trend since January 2024 after doing a 10x in just 63 days. The coin seems to have been going through a decent correction for the past 140-160 days. Pulling up the Fib retracement we see a clear bounce off of the 50% level(log scale) which gives an indication that the correction is coming to an end. This gives us a good 1-2 setup per Elliot Wave Theory. Further the RSI seems to have bottomed out on the daily and shows signs of bullish divergence and accumulation of smart money. Looking at the long-term trend based on Modified Shiffs Pitchfork, it seems to be bouncing off of key levels parallel to the trend with great upside potential. Considering the incoming third wave being the longest and comparatively faster the Fib Extension targets of $74-$223 look positively attainable and within the assets long term trend. As we enter the Altcoin Season, Orca can be one of the early gainers considering the fact that ORCA went up to $29 a week into launch. I'm thinking the 3rd wave has already started and just needs a little momentum to go exponential. Considering the 1st wave lasting for 63 days the 3rd wave should be even faster and massive. The project is amazing and has good growth potential as it scales. A good investment overall. Do your own research before you Ape into this amazing project!!!! :-D

$ORCA short term bounce? 90-150% upside?LSE:ORCA has broken out of it's downtrend and has now retested the falling wedge as support which leads me to believe a big move higher is coming in the near future.
I could see the move taking us up to the $4 or $5 resistance before consolidating and having one last leg lower.
Should be a good trade though.
I've entered at $2.37.
Let's see how it plays out.

ORCA - The Best Scenario? Hi, this is my new update for ORCA. In the last 3-4 months Orca has fallen over 60%. Now it seems like that we are reaching the bottom. Right now we are in a descending triangle pattern on both the chart and the RSI.
We have a major support level around $3.30-3.60 and at the same time we have the 200D SMA (Red line). I expect if these levels holds then we are going to break the blue trendline and we are ready to takeoff. You can find the next stop for Orca after the breaking the trendline on full chart, it's around $10.50-13.50.
Things will get very ugly if the support level $3.30-3.60 breaks, the next support will be around $2.50.

Orca (Solana chain) 75% potential tradeWe have a Solana ecosystem and memecoin-trading explosion - Orca, Solana-exchange, are probably next to follow.
I see a nice set up with a daily break of trend, squeeze between 20 Moving Average and 200 Moving Average.
One idea (depending on your trading style) is to place a stop loss under previous candles low.
If Solana continue to run, I see this 75% trade play out quite fast (on daily time frame).

Long Orca to 8.73Traders,
I’ve been at work testing some new indicators lately and they have been working very well so far. I want to give them a true test in predicting a pullback, but so far, they haven’t had that chance. Anyways, right now, they are all flashing green on ORCA. And it makes sense too. We’ve cracked the top of that down-trending channel, signaling that an upward break is coming soon. Additionally, we have very solid support on the underside of price. Finally, look at that beautiful bull flag that has formed. We are on the precipice of upward trajectory here. I’ve entered at 4.64 with a final target of 8.73, a SL of 3.61, and a RRR of 4.3. See you on the moon.
Stew
