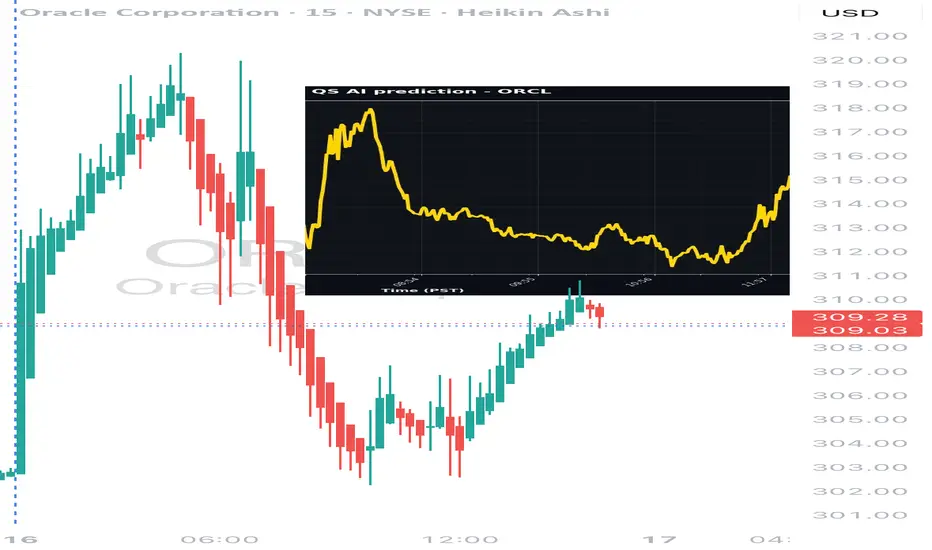
ORCL Rockets and Pullbacks: Today’s Ride 🔥AI powerful prediction—who wins next? 🐂
🚀 ORCL Intraday Move – Sept 16, 2025
💵 Close: $306.65 (+1.49%)
📈 High / Low: $320 / $302
📊 Volume: 51.7M
#ORCL #StockMarket #TradingView #Bullish #AI #Finance
Orclsignals
ORCL Weekly Bullish Scalp – $320 CALL, 50% Target!
🚀 **ORCL Weekly Play | 2025-09-11** 🚀
**Directional Bias:** STRONG BULLISH ✅
**Reason:** Multi‑timeframe momentum (Daily RSI 77 / Weekly RSI 83.5) + 4.1x institutional volume 📊
⚠️ Note: Weekly options flow bearish (call/put 0.77) → likely hedging, **don’t overthink it**.
**💡 Trade Recommendation:**
* **Instrument:** ORCL weekly call
* **Strike:** 320.00 💰
* **Expiry:** 2025-09-12
* **Entry Price (ask):** \$3.10
* **Direction:** LONG ✅
* **Position Size:** 1 contract (scale to 2% account risk max)
**🎯 Targets & Stops:**
* **Profit Target:** \$4.65 (+50%)
* **Stop Loss:** \$1.55 (-50%)
* **Entry Timing:** Market open 🕒
* **Exit:** Prefer by 2–3 PM ET to avoid gamma/pin risk
**⚡ Why This Strike:**
* Higher delta (\~0.35–0.45) → better chance to move ITM in 1 day
* Liquid OI (1,695) → smoother execution
* Premium allows **controlled position sizing**
**Alternative Options:**
* \$322.50 call (ask \$2.41) → more conservative, slightly lower delta
* \$335 call (ask \$0.62) → high-leverage “lottery” ticket, tiny size only
**📈 Key Risks:**
* HIGH gamma / accelerating theta ⚡
* Options flow put dominance → possible short interest
* Intraday news shocks can wipe out premium
**Confidence Level:** 70% ✅
**📊 JSON Trade Snapshot:**
```json
{
"instrument": "ORCL",
"direction": "call",
"strike": 320.0,
"expiry": "2025-09-12",
"confidence": 0.70,
"profit_target": 4.65,
"stop_loss": 1.55,
"size": 1,
"entry_price": 3.10,
"entry_timing": "open",
"signal_publish_time": "2025-09-11 10:16:53 UTC-04:00"
}
```
💥 **TL;DR:** ORCL is firing on all cylinders. Strong bullish momentum + heavy volume → tactical 1-day call for high-gamma intraday play. Tight stops, small size, exit early.
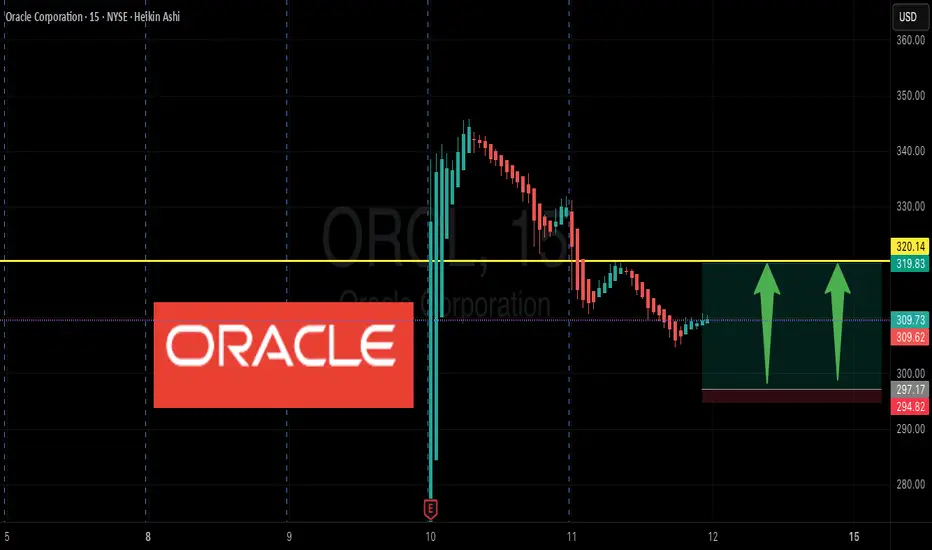
ORCL Earnings Put Play $205 Puts – Are You In?
# 🔥 ORCL Earnings Play – Bearish Tail Hedge 🚨
**📊 Setup:** Oracle (ORCL) – Earnings 09/09 AMC
**🎯 Direction:** PUT (Short Bias)
**💵 Entry:** \$0.93 (205 Put)
**🛑 Stop:** \$0.47 (−50%)
**🎯 Target:** \$2.79 (+300%)
**📅 Expiry:** 2025-09-12
**📈 Confidence:** 66%
---
### ⚡ Why this trade?
* 📉 Weak technicals → price < 20d & 50d MAs, RSI \~42
* 🏦 Institutional flow → heavy OI/volume at \$205 puts
* 💣 Leverage risk (Debt/Equity > 500%)
* 🎯 Cheap asymmetric bet → defined premium risk vs. big payoff
---
### ⚠️ Risks to watch
* ❌ Small move + IV crush = full premium loss
* 🚀 Big beat → upside squeeze
* 📰 Macro (Fed/inflation data) could override stock move
---
### ✅ Trade Plan
* Enter: **Pre-earnings close (09/09 AMC)**
* Position size: ≤2% portfolio
* Profit scale: +100% / +200% / +300%
* Exit rule: If stop hit OR 2 hrs after open post-earnings
---
🔥 **ORCL = High-quality biz but high expectations. This setup = cheap downside hedge with asymmetric payoff.*

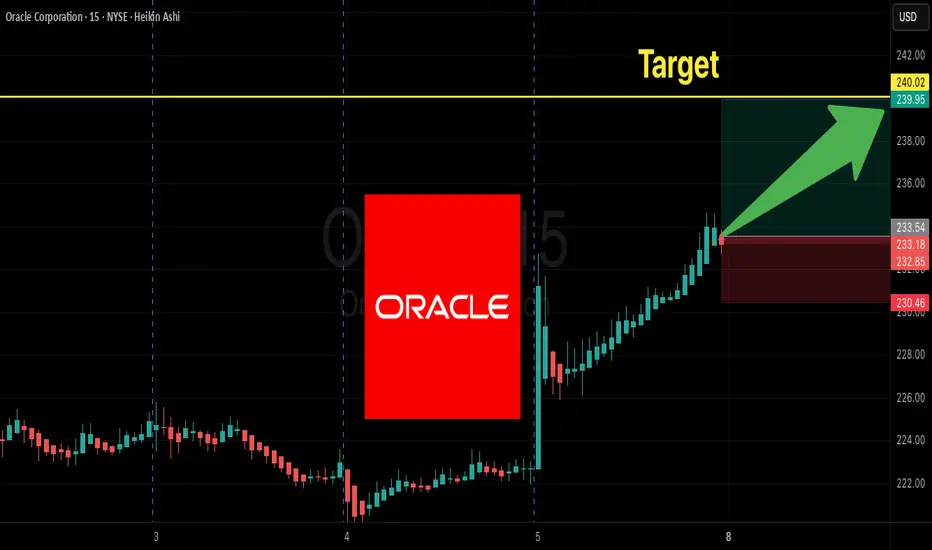
ORCL Weekly Call Setup — $240C Targeting Breakout!
# 🚀 ORCL Weekly Trade Setup (Sep 6, 2025) 🚀
### 🔎 Market Consensus
* **Momentum:** Weekly RSI strong (67.8 ↑), daily RSI improving (47.4).
* **Volume:** 1.5x weekly → institutional activity.
* **Options Flow:** C/P = **1.49** → bullish bias.
* **Volatility:** Low VIX (\~15) → cheap calls.
* **Consensus:** 📈 Moderate Bullish Weekly Bias
---
### 🎯 Trade Plan
* **Instrument:** ORCL
* **Direction:** CALL (LONG)
* **Strike:** 240C
* **Expiry:** 2025-09-12 (6 DTE)
* **Entry Price:** 8.30
* **Profit Target:** 10.40 (+25%) — stretch 12.30–16.40 if momentum holds
* **Stop Loss:** 4.95 (\~-40%)
* **Size:** 1 contract (scale by risk)
* **Entry Timing:** Market Open
* **Exit Rule:** Take profits in strength, exit **by Thu Sep 11** (avoid Friday decay/earnings risk)
* **Confidence:** 🔥 68%
---
### ⚖️ Key Risks
* Earnings risk inside 6-day window → binary volatility.
* High weekly volume could mean **distribution** if no follow-through.
* Theta/gamma crush into late week.
---
### 🧠 Alternative View
* Grok/xAI flags “No Trade” due to binary earnings event risk.
* Conservative traders may stay flat.
---
📊 **TRADE DETAILS (JSON)**
```json
{
"instrument": "ORCL",
"direction": "call",
"strike": 240.0,
"expiry": "2025-09-12",
"confidence": 0.68,
"profit_target": 10.40,
"stop_loss": 4.95,
"size": 1,
"entry_price": 8.30,
"entry_timing": "open",
"signal_publish_time": "2025-09-06 12:07:08 EDT"
}
```
---
🔥 \ NYSE:ORCL | \ AMEX:SPY | \ NASDAQ:QQQ | #OptionsTrading #TradingView #UnusualWhales #SP500 #StocksToWatch #UnusualWhales#GammaSqueeze#OptionsFlow#FlowTrading#WeeklyOptions#CallOptions#StockMarket#TradingView #Bullish#SP500Inclusion#StocksToWatch#MarketMoves#EarningsSeason#MomentumTrading#RiskReward
ORACLE Channel Up targeting $200.Oracle (ORCL) broke above its previous High last week and even though the current one is under a certain degree of volatility (reasonable due to the Fed), this confirmed the upward continuation of the trend.
Technically, the stock has been trading within a long-term Channel Up since the September 2022 market bottom and after a prolonged test this year of the 1W MA50 (blue trend-line) as Support, it has started the new Bullish Leg with the current phase being the last one.
An ideal 1W RSI symmetry suggests that we might be printing a sequence similar to March - June 2023, which peaked after a +110% rise from its bottom.
As a result, we remain bullish on Oracle, targeting $200.00 by the end of the year.
-------------------------------------------------------------------------------
** Please LIKE 👍, FOLLOW ✅, SHARE 🙌 and COMMENT ✍ if you enjoy this idea! Also share your ideas and charts in the comments section below! This is best way to keep it relevant, support us, keep the content here free and allow the idea to reach as many people as possible. **
-------------------------------------------------------------------------------
💸💸💸💸💸💸
👇 👇 👇 👇 👇 👇

ORCL show an engulfment patternORCL show an engulfment pattern
This chart shows the weekly candle chart of Oracle's stocks over the past year. The graph overlays the bottom to top golden section at the end of 2022. As shown in the figure, the high points of Oracle's stock in June of this year and this month formed a small level double top shape, and were suppressed by the 3.414 digits of the golden section at the bottom of the figure! Although the weekly chart of Oracle's stock has not yet closed, it has now shown a large-scale engulfment pattern, completely engulfing the gains of the past three months!

ORACLE Bullish as long as the 1D MA50 supports.Oracle Corporation (ORCL) is on a Channel Up within a Channel Up (blue) that is rising despite the Channel Down (bearish divergence) on the 1D RSI. We are now exactly on the 0.618 Fibonacci retracement level, which is the highly critical Golden Ratio. As long as the 1D MA50 (blue trend-line) is holding, then the Channel Up will eventually push higher towards the 0.786 Fibonacci (96.50). A break below the 1D MA50, should re-test the 0.382 Fib (78.20) and depending on the time it breaks, potentially the 1D MA200 (orange trend-line) as well.
-------------------------------------------------------------------------------
** Please LIKE 👍, FOLLOW ✅, SHARE 🙌 and COMMENT ✍ if you enjoy this idea! Also share your ideas and charts in the comments section below! **
-------------------------------------------------------------------------------
💸💸💸💸💸💸
👇 👇 👇 👇 👇 👇

ORACLE Broke above the 1D MA50, first time in more than a monthThe Oracle Corporation (ORCL) broke today above its 1D MA50 (blue trend-line) for the first time since September 14. Within the long-term Channel Down pattern that the price has been trading in since January 12, this is the fastest break-out after a Lower Low bounce. Basically it resembles the fast rebound after the February 24 Low and in order for you to see the similarities I have plotted it on the current price action.
Technically, the top should be either on the 1D MA200 (orange trend-line) or the Lower Highs trend-line of the Channel Down. A break above the Lower Highs though, and more importantly the 0.382 Fibonacci retracement level, can potentially be a signal that the long-term sentiment has shifted back to being bullish and the upper Fibs should be targeted. It is worth noting that while the price has been trading on Lower Highs, the RSI on the 1W time-frame has been trading on Higher Highs. This divergence could be an early sign of an upcoming trend change.
-------------------------------------------------------------------------------
** Please LIKE 👍, SUBSCRIBE ✅, SHARE 🙌 and COMMENT ✍ if you enjoy this idea! Also share your ideas and charts in the comments section below! This is best way to keep it relevant, support me, keep the content here free and allow the idea to reach as many people as possible. **
-------------------------------------------------------------------------------
You may also TELL ME 🙋♀️🙋♂️ in the comments section which symbol you want me to analyze next and on which time-frame. The one with the most posts will be published tomorrow! 👏🎁
-------------------------------------------------------------------------------
👇 👇 👇 👇 👇 👇
💸💸💸💸💸💸
👇 👇 👇 👇 👇 👇
