Orderblocks

Most Realistic (Yet Profitable) Trading Strategy Signals in 2026CRAZY RESULTS. Setting up and checking the performance reports of one of the most realistic strategy signals on TradingView.
This is what I personally use on all my trades, newly upgraded and refined with new features.

Eureka Forbes LimitedStock has broken out and is ready for the targets mentioned in drawing as TI and T2
Pattern Identified : Symmetrical Triangle breakout on the higher side
CPR Verification : Stock above monthly CPR and R1

GBPUSD Retracement Idea for a new Lower HighHi Traders!
Since my last idea GU reached my short target around 1.30000. I'm now looking for price to retrace to a previous bearish BOS area around 1.32500-1.33000. If price can create a new lower high in that area we could possibly see more bearish movement. In addition, if DXY can hold around 99.000-99.500, and continue reversing to the upside I'd have a new swing target for GU at the next Daily OB around 1.29000-1.28500.
1st alert set just below 1.32500 in case price doesn't make it to my target.
*DISCLAIMER: I am not a financial advisor. The ideas and trades I take on my page are for educational and entertainment purposes only. I'm just showing you guys how I trade. Remember, trading of any kind involves risk. Your investments are solely your responsibility and not mine.*

USDJPY Sell PositionPrice bounced from a resistance confluence, aligning with:
Previous swing highs (horizontal resistance) 157.80
Bearish order block from earlier session 157-158
Price dropped to 156, and made a bullish flag pattern up to 157. Price has broken the flag support line at.
Trade Details
Entry: 156.72
Stop Loss: 157.25
Take Profit: 155.20 (supply zone)
Risk: 53 pips
Reward: 152 pips
Risk/Reward Ratio: 2.8 x
⚠️ Disclaimer ⚠️This journal entry is for educational and documentation purposes only. It does not constitute financial advice or a recommendation to trade. All trading involves risk, and past performance does not guarantee future results. Always conduct your own analysis and consult with a licensed financial professional before making trading decisions.

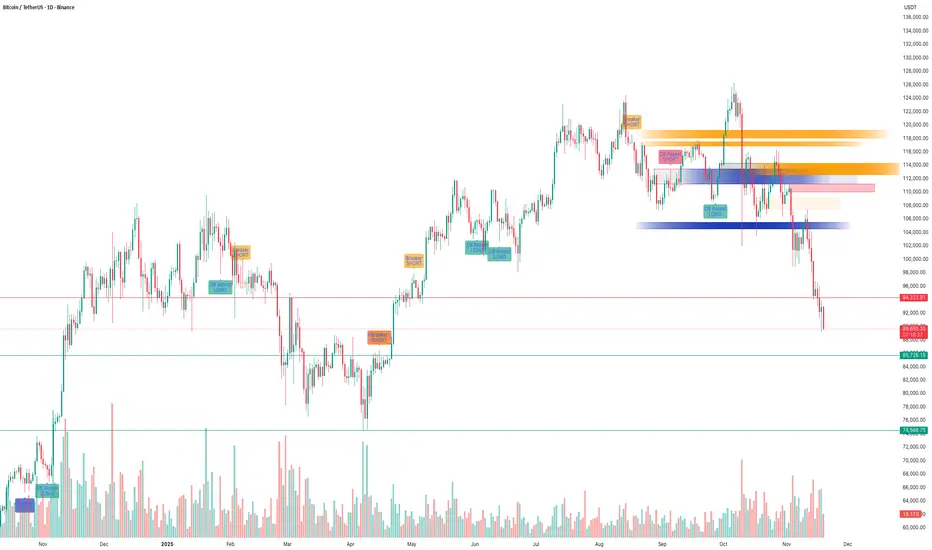
BTC – SMC Suite Follow-Up: Liquidity Grab at 116K and the Drop!!BTC – SMC Suite Follow-Up: Liquidity Grab at 116K and the Drop That Followed
This is a follow-up to my earlier idea “ BTC – Liquidity Grab at $116K Before Deep Correction? ” where I highlighted the danger of price trading into stacked SMC levels on the 1D chart.
1️⃣ Quick recap of the original idea
In the previous post, price was trading around the $112K–$116K zone.
Using the SMC Suite on the 1D chart, I highlighted:
• A high-timeframe supply / OB cluster around 116K.
• A liquidity grab above prior highs – price spiked into fresh liquidity sitting above the range.
• A confluence of Breaker + OB Re-test + FVG acting as a “danger zone” for fresh longs.
• The idea that this move could be a distribution / liquidity grab before a deeper correction.
The key message was: this is not a safe place to be aggressive long; watch for rejection and potential downside.
2️⃣ How price reacted afterwards
Since that post:
• Price respected the 116K zone as supply – every attempt to hold above it failed.
• The highlighted OB + Breaker block acted as a ceiling; price consolidated there and then rolled over.
• After losing the mid-range structure, BTC started a trend of lower highs and lower lows , confirming distribution.
• We have now traded all the way down into the d emand / support zones below 92K and then lower , which were also plotted in advance by the same SMC levels.
In simple terms, the area we marked as a “ danger zone for longs ” turned out to be the top of the move before this large downside leg.
3️⃣ What the SMC levels showed well
This move is a nice case study of how the SMC concepts aligned:
• Liquidity Sweep : Price ran above previous highs into fresh liquidity, then failed to hold.
• Breaker + OB Re-test : Former demand became supply; retest of this breaker block rejected price.
• FVG + Imbalance Zones : Upside imbalances got filled and then flipped into resistance.
• Structure Shift : After the rejection, market structure shifted bearish with clean breaks of prior swing lows.
None of this is about “perfect prediction”, but about reading where smart money might be offloading risk and where retail is most vulnerable.
4️⃣ Takeaways & what I’m watching next
• HTF SMC levels matter. When multiple concepts cluster (Breaker, OB, FVG, previous highs), treat that zone with respect.
• Liquidity grabs at highs are great warning signals – especially when followed by a clear structure shift.
• For now, I’m watching how price behaves around the current demand zones and whether we see:
• Strong rejection + reclaim of broken levels (potential swing-long areas), or
• Continuation of lower highs pointing to further downside.
This post is for educational purposes only, not financial advice.
XAUUSD - REJECTING THE DAILY ORDER BLOCK, BULLISH CONFIRMATION Gold is forming a bullish structure after rejecting the daily Order Block, which is acting as strong support.
🟢 1st Scenario:
Gold may continue pushing up toward 4200 , which is the H4 Order Block acting as resistance.
From this level, price may either reject or break through the area.
🟢 2nd Scenario:
If Gold can break above 4200 and form a clear break-and-retest structure, the trend is likely to continue.
The next important level to watch is 4340 .

WE CAN HOLD OUR POSITIONEUR/USD has remained in a downtrend and is using bullish order blocks only for short-term corrections. However, its downward movement isn't very stable due to the low number of sell orders. This week, the EUR/USD and GBP/USD pairs are stuck in a temporary correction, so we need to be cautious about corrective moves.
If you've been in the downtrend from the beginning, you can secure part of your profit here and set the rest of your position to risk-free

GBPJPY – Targeting the Green WCL After BC RetracementPrice completed a clean green impulse and started a corrective red sequence.
The plan: wait for a retracement into the red BC zone, which overlaps a bearish order block. If price reacts from that region, I’ll ride the next leg down toward the red C target and the green wave’s Whole Correction Level (WCL).
However, note the developing bullish flag pattern — if price breaks above red B, that flag activates and the bearish setup becomes invalid. A breakout there could extend the larger bullish trend.
Strengths:
– BC retracement aligns with a strong order block.
– WCL and C-target overlap, creating a high-probability draw on liquidity.
– Clear invalidation above red B protects the setup.
Weaknesses:
– GBPJPY volatility could trigger premature sweeps.
– A confirmed flag breakout would fully invalidate this setup.
Narrative:
Trading the correction inside a possible flag — shorting structure, not emotion. If the flag fires, I’ll flip bias with it.

GBPJPY | Institutional Sell Setup – D1 & W1 Sweeps AlignGBPJPY has completed a multi-timeframe liquidity sweep, with both W1 and D1 sweeps aligning inside a premium price zone.
The structure has shifted bearish following a clear CHOCH and a rejection from the FVG imbalance area, confirming potential downside continuation.
🔹 Execution Bias: Instant Sell
🔹 Entry Zone: 202.60–202.80
🔹 Stop-Loss: Above 203.40 (protected high)
🔹 Target: 199.00 (liquidity zone)
🔹 Bias: Bearish
Technical Breakdown:
• Weekly sweep confirms distribution.
• Daily sweep adds confluence of liquidity grab.
• CHOCH at discount confirms bearish intent.
• FVG + refined OB = smart-money entry zone.
• Targeting inefficiency and old liquidity lows.

Fertilizers & Chemicals Travancore LtdStock Price is well inside Accumulation Zone and also RSI Divergence can be seen on the daily time frame, Stock has very good fundamentals, Price may reverse from here to hit the Targets as shown in the diagram.
Fundamentals Snap Shot :-
Short Overall View on These Metrics
Sales / Revenue growth:
Long-term revenues have grown strongly from ~₹2,000 cr to a 6,000+ cr peak,
But last two years show clear decline, and 3-year sales CAGR is now negative.
OPM %:
Peaked around 13–17% (FY20–22); now down to 2–4%.
Indicates margin pressure (costs, pricing, or mix issues).
EPS:
Boosted historically by large “Other Income”;
Recent EPS is weak and volatile, far below earlier peaks.
Cash reserves:
Big positive: cash & bank balances of nearly ₹2,800 cr, growing every year;
With borrowings ~₹1,800 cr, FACT now appears net-cash positive.

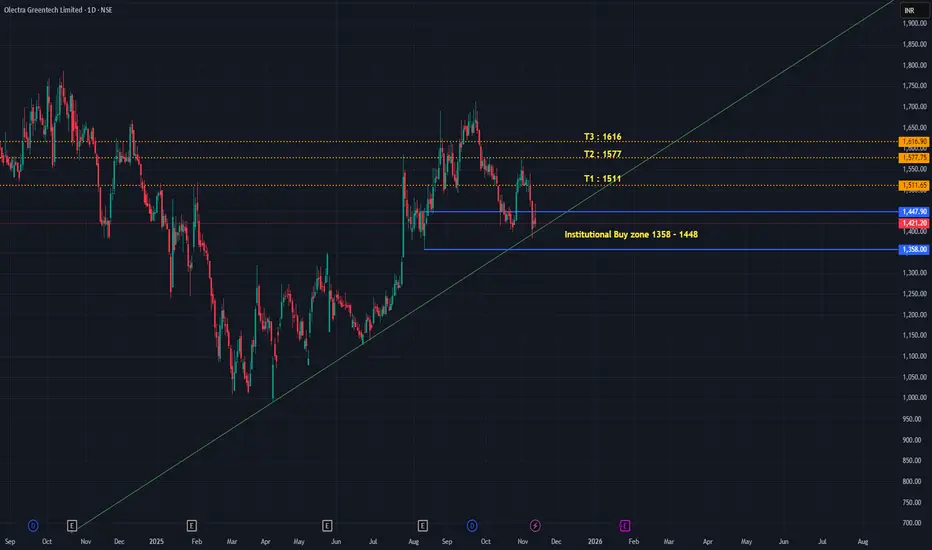
OLECTRA Trade PlanStock Price is well inside Accumulation Zone and also taking support from the Trend Line, Stock has very good fundamentals, Price may reverse from here to hit the Targets as shown in the diagram
Fundamentals Snap Shot :-
Very Short Overall Take (On Just These Metrics)
Sales/Revenue growth: ⭐⭐⭐⭐⭐ – Very strong 5-year ramp, big FY25 jump.
OPM%: ⭐⭐⭐⭐☆ – Stable ~15%, good for a tender-driven manufacturing business.
EPS growth: ⭐⭐⭐⭐⭐ – EPS has multiplied sharply with improving scale.
Cash reserves: ⭐⭐⭐☆ – Adequate but not “cash-rich”; significant money stuck in receivables & inventory.
AUD/USD – Looking for buys off the 4H BC zoneAfter completing a clean bearish correction, price shifted bullish on the 4H.
I’m waiting for a retrace into the BC + Order Block zone (0.6490) to go long.
Targeting 0.6560 , stop below 0.6463 .
If 0.6460 breaks cleanly, setup’s invalid.
R:R ≈ 1:2.6 — let’s see if demand holds 👀
Disclaimer: This post is for educational purposes only and does not constitute financial advice.

Voltamp Transformers LtdStock has broken out and is ready for the targets mentioned in drawing as TI and T2

BTC/USD – Bullish Reversal from 15m Order BlockPrice is currently reacting from a key bullish order block after forming a clear CHoCH near the strong low, suggesting potential accumulation and bullish intent. As long as the order block holds, buyers may drive price toward higher liquidity areas.
Buy Entry: 104,900 – 105,100
Targets:
TP1: 106,400
TP2: 107,200
Invalidation: Break below 104,700

Btc/Usdt - Trendline Break With Order Block RejectionBitcoin has tapped into a well-defined order block where buyers previously stepped in, and the market is showing a clear bullish reaction from that zone. After a prolonged move down under a descending resistance trendline, price has now broken above this trendline, suggesting a potential shift in short-term momentum from bearish to bullish.
The break of the trendline indicates that sellers are losing control, and buyers are starting to gain strength. If price holds above the breakout level and continues forming bullish structure, we could see a continuation toward the next liquidity area. The projected path points to a move toward the 103.8–104K target zone, where previous liquidity and fair-value areas may attract price.
Points to watch:
✅ Strong reaction from the order-block zone
✅ Trendline breakout confirming bullish pressure
✅ Potential higher lows forming to support an upward move
✅ Next target zone sits around 103.8–104K
As long as Bitcoin remains above the broken trendline and maintains bullish structure, upside continuation remains likely.
(Not financial advice.)

TATA Steel LimitedPrice has Bounced from Order Block, hence will go and hit target marked as T1 and T2

Gbp/Usd - Orderblock Retest and Bullish Continuation SetupPrice is currently trading around 1.3167, showing bullish momentum after a strong impulsive move upward. However, the market may need to retrace to a key bullish order block zone before continuing higher.
Key Levels:
Order Block Zone: 1.3110 – 1.3125
Current Price: 1.3167
Target Area: 1.3175 – 1.3180
Expected Price Action:
Short-term pullback expected as liquidity is taken from recent highs.
Price may revisit the order block (highlighted zone) for mitigation.
Look for a bullish reaction or confirmation structure (break of minor high) from the order block.
Potential continuation toward the target area near 1.3180.
Bias: Bullish (after retracement)
Invalidation: Clean break below 1.3100 may invalidate this setup.
Notes:
Watch for confirmation patterns like bullish engulfing or BOS (Break of Structure) before entering.
Manage risk carefully—this setup aligns with smart money concepts (order block + liquidity sweep).

NZDJPY — Waiting for the Sweep Before the ImpulseThe market is setting its own stage.
The green ABC correction is approaching its final C-leg — right into a cluster of confluence: trendline support, an internal order block, and a liquidity pocket resting beneath the prior lows.
I’m waiting for that final sweep into the OB/trendline area before stepping in to ride the pink impulsive C-leg toward the upper channel and buyside liquidity zone near 88.6 – 88.8 .
The plan is simple:
– Let the algorithm complete its cleanup below.
– Watch for an MSS and fair-value-gap confirmation.
– Ride the next displacement toward the liquidity resting above.
Invalidation:
If price violates the order block decisively and structure fails to shift, the setup expires.
Strengths:
– Clear multi-timeframe wave alignment (green correction → pink impulse)
– Strong OB + trendline + liquidity sweep confluence
– High reward potential once the pink C-leg activates
Weaknesses:
– Early entries before sweep risk being trapped
– Yen volatility can disrupt lower-timeframe confirmations
Summary:
Patience before precision. I’m waiting for the sweep to finish — then decoding the next wave of chaos.

EUR/GBP – Corrective C Wave in PlayPrice already tapped the black BC, suggesting the first correction leg is done.
Now, the pink wave’s C target aligns perfectly with both the descending trendline and the order block — a strong confluence zone likely to induce liquidity before a deeper retracement of the black wave.
Setup remains valid as long as the black B isn’t broken. A break above B would invalidate the sequence and shift market structure bullish.
Strengths:
Trendline + order block + C target alignment
Internal correction forming cleanly within larger structure
Clear invalidation and strong confluence logic
Weaknesses:
Liquidity sweeps may occur before confirmation
Requires patience for MSS confirmation before entry

Deep Industries Trade PlanPrice is about to hit institutional zone, once price reaches this zone accumulation will start, which will in-turn Propel the price upwards once again to test the previous highs

AUDUSD – corrective math in motion.Price retraces into the prior order block that broke structure, completing a textbook ABC correction inside a premium zone. Liquidity pools just above IDM hint at a sweep before continuation toward 0.63.
Strengths :
Confluence between wave symmetry, premium retracement, and liquidity structure. Clear invalidation point above IDM keeps risk defined.
Weaknesses :
AUD fundamentals (RBA policy shifts, USD softness) could disrupt structure-based setups. No confirmed momentum shift yet on lower timeframes — patience required.
SmellyTaz — decoding chaos .

SOLUSDTI think have this chart of BINANCE:SOLUSDT buy because breakout trendline and i see order-block in 194$. Target is end measured move (2-Leg) from low latest swing in 208$.
Please control your risk in any position.
