Btc/Usdt - Trendline Break With Order Block RejectionBitcoin has tapped into a well-defined order block where buyers previously stepped in, and the market is showing a clear bullish reaction from that zone. After a prolonged move down under a descending resistance trendline, price has now broken above this trendline, suggesting a potential shift in short-term momentum from bearish to bullish.
The break of the trendline indicates that sellers are losing control, and buyers are starting to gain strength. If price holds above the breakout level and continues forming bullish structure, we could see a continuation toward the next liquidity area. The projected path points to a move toward the 103.8–104K target zone, where previous liquidity and fair-value areas may attract price.
Points to watch:
✅ Strong reaction from the order-block zone
✅ Trendline breakout confirming bullish pressure
✅ Potential higher lows forming to support an upward move
✅ Next target zone sits around 103.8–104K
As long as Bitcoin remains above the broken trendline and maintains bullish structure, upside continuation remains likely.
(Not financial advice.)
Orderblocks

TATA Steel LimitedPrice has Bounced from Order Block, hence will go and hit target marked as T1 and T2

Gbp/Usd - Orderblock Retest and Bullish Continuation SetupPrice is currently trading around 1.3167, showing bullish momentum after a strong impulsive move upward. However, the market may need to retrace to a key bullish order block zone before continuing higher.
Key Levels:
Order Block Zone: 1.3110 – 1.3125
Current Price: 1.3167
Target Area: 1.3175 – 1.3180
Expected Price Action:
Short-term pullback expected as liquidity is taken from recent highs.
Price may revisit the order block (highlighted zone) for mitigation.
Look for a bullish reaction or confirmation structure (break of minor high) from the order block.
Potential continuation toward the target area near 1.3180.
Bias: Bullish (after retracement)
Invalidation: Clean break below 1.3100 may invalidate this setup.
Notes:
Watch for confirmation patterns like bullish engulfing or BOS (Break of Structure) before entering.
Manage risk carefully—this setup aligns with smart money concepts (order block + liquidity sweep).

NZDJPY — Waiting for the Sweep Before the ImpulseThe market is setting its own stage.
The green ABC correction is approaching its final C-leg — right into a cluster of confluence: trendline support, an internal order block, and a liquidity pocket resting beneath the prior lows.
I’m waiting for that final sweep into the OB/trendline area before stepping in to ride the pink impulsive C-leg toward the upper channel and buyside liquidity zone near 88.6 – 88.8 .
The plan is simple:
– Let the algorithm complete its cleanup below.
– Watch for an MSS and fair-value-gap confirmation.
– Ride the next displacement toward the liquidity resting above.
Invalidation:
If price violates the order block decisively and structure fails to shift, the setup expires.
Strengths:
– Clear multi-timeframe wave alignment (green correction → pink impulse)
– Strong OB + trendline + liquidity sweep confluence
– High reward potential once the pink C-leg activates
Weaknesses:
– Early entries before sweep risk being trapped
– Yen volatility can disrupt lower-timeframe confirmations
Summary:
Patience before precision. I’m waiting for the sweep to finish — then decoding the next wave of chaos.

EUR/GBP – Corrective C Wave in PlayPrice already tapped the black BC, suggesting the first correction leg is done.
Now, the pink wave’s C target aligns perfectly with both the descending trendline and the order block — a strong confluence zone likely to induce liquidity before a deeper retracement of the black wave.
Setup remains valid as long as the black B isn’t broken. A break above B would invalidate the sequence and shift market structure bullish.
Strengths:
Trendline + order block + C target alignment
Internal correction forming cleanly within larger structure
Clear invalidation and strong confluence logic
Weaknesses:
Liquidity sweeps may occur before confirmation
Requires patience for MSS confirmation before entry

Deep Industries Trade PlanPrice is about to hit institutional zone, once price reaches this zone accumulation will start, which will in-turn Propel the price upwards once again to test the previous highs

AUDUSD – corrective math in motion.Price retraces into the prior order block that broke structure, completing a textbook ABC correction inside a premium zone. Liquidity pools just above IDM hint at a sweep before continuation toward 0.63.
Strengths :
Confluence between wave symmetry, premium retracement, and liquidity structure. Clear invalidation point above IDM keeps risk defined.
Weaknesses :
AUD fundamentals (RBA policy shifts, USD softness) could disrupt structure-based setups. No confirmed momentum shift yet on lower timeframes — patience required.
SmellyTaz — decoding chaos .

SOLUSDTI think have this chart of BINANCE:SOLUSDT buy because breakout trendline and i see order-block in 194$. Target is end measured move (2-Leg) from low latest swing in 208$.
Please control your risk in any position.

ASTER — OB Tap → WCL Retrace → Macro DownASTER is forming a clean ABC correction within a larger bearish structure. Price hasn’t yet tapped the order block — I expect a final dip to complete the C-leg before retracing toward the WCL zone. From there, the broader bearish wave should resume.
However, if Bitcoin continues its upward expansion, correlations could invalidate this structure and pull ASTER higher, overriding the current wave bias.
High-timeframe trend stays bearish, but intent always belongs to the present.
Strengths:
• Fractal alignment between macro and micro waves.
• Logical liquidity flow between OB and WCL.
• Flexible bias — corrective long, then macro short continuation.
Weaknesses:
• Requires precise OB tap and strong reaction.
• Bitcoin-driven expansion could neutralize bearish context.
• LTF volatility may distort confirmation signals.
SmellyTaz — decoding chaos

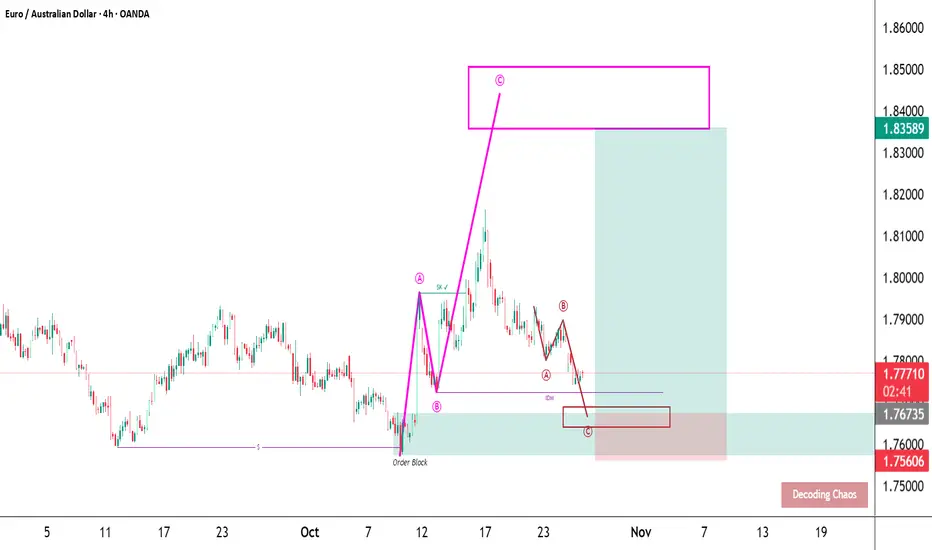
EURAUD – structure breathes in waves.Price retraces toward a clean order block within a discount zone after a strong impulsive leg. Correction is forming a precise ABC pattern, likely to complete near 1.767 before the next wave resumes toward 1.835.
Strengths:
Wave symmetry, confluence with order block, and IDM liquidity structure all align. Setup maintains bullish context from higher timeframe while defining risk clearly below C.
Weaknesses:
Momentum confirmation pending; daily RSI could signal exhaustion if recovery stalls. EUR fundamentals remain sensitive to data shocks that can distort technical structure.
SmellyTaz — decoding chaos.
Dip Buying Levels on TSLA Post Earnings"Abide in me, and I in you. As the branch cannot bear fruit by itself, unless it abides in the vine, neither can you, unless you abide in me. I am the vine; you are the branches. Whoever abides in me and I in him, he it is that bears much fruit, for apart from me you can do nothing."
- John 15:4-5
Hello Traders!
As part of my weekly equity trade analysis, I will be uploading my recordings of what I am seeing and intending to trade for the week. A quick summary of what's in the video is as follows:
- TSLA earnings are highly anticipated with most retail traders expecting bullish continuation from its breakout from previous consolidation
- We are expecting a retracement to resolve some imbalances, but to structurally hold key levels either above $408 or $385, and to close the week above last week's high over $440
- Our vehicle of choice this week are the $430 weekly calls or $415 calls (if price retraces further to $390)
Cheers,
DTD
Financial Risk Disclaimer |
DISCLAIMER: I am not a financial adviser. The videos on my channel are for educational and entertainment purposes only. I'm just showing you guys how I invest and day trade, but remember, investing of any kind involves risk. Your investments are solely your responsibility and not mine. While day trading can bring substantial gains, it can also bring serious losses! So make sure you do your research to fully understand the market before diving in. The possibility exists that you could sustain a loss of some or all of your initial investment, and therefore should not invest money that you can't afford to lose. The fluctuation of the market can work for you or against you. You should carefully consider your investment objectives and experience before deciding to trade in the market. Again, what you invest in is solely your responsibility.

AUDCAD: Wait for the Close – 0.9130 vs 0.9057AUDCAD is sitting at a make-or-break spot. It’s been climbing in a 4H channel but just topped out and pulled back to support. I won’t guess mid-range—I'll trade the break:
Bull: H4 candle closes above 0.9130 → room toward 0.9165/0.9180, then 0.9230–0.9250.
Bear: H4 candle closes below 0.9057 → opens 0.9000, then 0.8950–0.8920.
I prefer a close and quick retest/hold for confirmation. Watch AUD/CAD news and oil (for CAD).

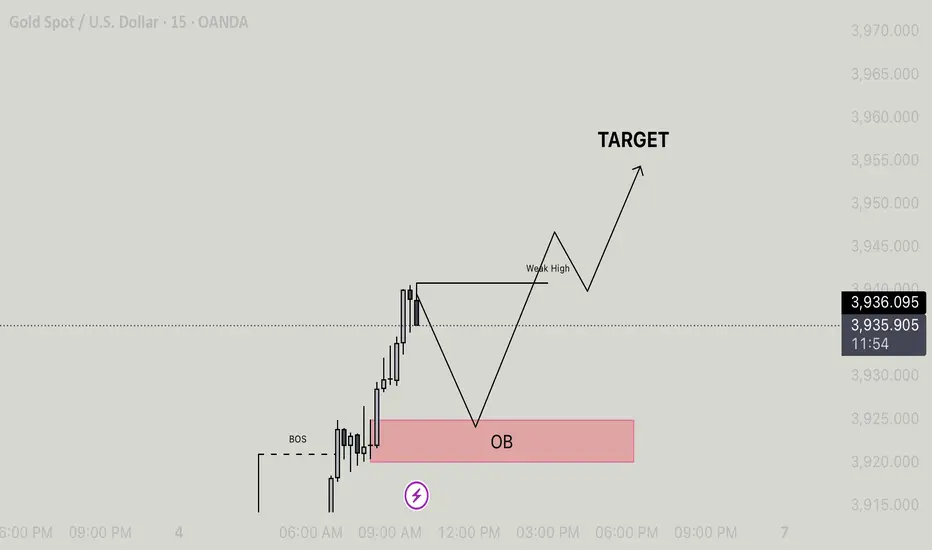
Xauusd - Order Block rejection for bullish continuationPrice on XAUUSD has shown a clear bullish structure after breaking previous short-term highs, confirming a BOS (Break of Structure) and establishing a temporary bullish sentiment. After this impulsive move, price is now expected to retrace back into the Order Block (OB) zone highlighted in red, which aligns perfectly with a demand area where previous institutional orders originated.
This corrective move will allow liquidity to be collected from the downside, possibly sweeping out minor lows before resuming upward momentum. Once the order block reacts and buyers step in, we could anticipate a strong bullish push breaking through the Weak High, confirming continuation structure.
The projected move targets higher liquidity levels where price is likely to mitigate inefficiencies left behind from the previous bullish leg. A clean rejection from the OB zone would provide confirmation of buy-side strength and continuation toward the Target zone.
Overall, the setup suggests a short-term pullback followed by a potential bullish continuation, maintaining the higher-timeframe directional bias.
Bearish Movement Coming UpPotential move to the downside, waiting for price to make it up to at least 50% of the operative range, aligning with an Bearish OB.

Order Blocks: Where Smart Money Leaves Its Footprints“The market doesn’t move randomly.
Every big push leaves a shadow — a clue of who was in control.”
That clue is what traders call an Order Block .
What is an Order Block?
An Order Block (OB) is the last bullish or bearish candle before a strong impulsive move in the opposite direction.
Think of it as the area where institutions placed their orders to fuel that move.
In an uptrend , look for the last down candle before a strong rally.
In a downtrend , look for the last up candle before a sharp drop.
These zones often act like magnets — price revisits them to “retest” before continuing.
Why Do Order Blocks Matter?
They reveal where the big money entered.
They create high-probability zones for entries.
They help traders avoid chasing moves at highs or lows.
How to Spot an Order Block
Identify a strong impulsive move (long-bodied candles, clear displacement).
Mark the last opposite candle before that move.
Wait for price to return to that zone.
Look for LTF confirmation — a ChoCH, BOS, or rejection wick.
Align with higher timeframe bias (H4/H1) for best results.
Example
Refer to the XAUUSD M15 chart above:
Gold formed a strong bullish rally, leaving behind a bullish order block zone at 3764.5 – 3757.5 .
When price retraced into this OB, it tapped liquidity from the stop area, then gave LTF confirmation (micro structure shift).
This long setup delivered an impressive 1:8 RR rally for disciplined traders who waited for the OB mitigation and entry confirmation.
Smart money doesn’t chase price — it waits for the market to come back home.
But here’s the secret most traders miss:
Order blocks alone are never the full story.
They work best when combined with liquidity sweeps, structure shifts, and precise timing .
That’s where the deeper edge lies — and it’s what separates surface-level knowledge from mastery.
📘 Shared by @ChartIsMirror

GBP/USD - SMART MONEY PLAY: OB REACTION TO RESISTANCE Price has recently tapped into the marked Order Block (OB) demand zone around 1.3420, where liquidity below the previous lows was swept. This liquidity grab often signals smart money positioning, suggesting that sellers may have been trapped while institutions accumulate long positions.
If buyers continue to hold this level, we can expect a shift in market structure on the lower timeframe, with bullish candles confirming the order block reaction. Once this bullish intent is established, price is likely to climb towards the next liquidity area, resting above intraday highs.
The target at 1.3447 aligns with a previously tested resistance zone, where supply is expected to be retested. This makes it a logical area for price to deliver after collecting liquidity from the downside. The path to target would likely include breaking minor intraday resistances and creating higher highs and higher lows on the 15m chart, confirming bullish structure.
Overall, the market is currently in a position to engineer a recovery move from demand to supply, completing a clean delivery from the OB zone to the resistance target.

1 Hour TF - GOLD Next Buying Level- Droid TradingGold in Consolidation Zone B/W Strong Resistance or OB-FVG
New Buying Level - 3680-85 ( Strong Buying)
Again Tapping 3610-3615 ( Buying Possible After Bullish candle 1 hour Closing Above)
1 hour candle Closing Above Strong Resistance - Buying Possible ( 3670-75 to Target ATH )
Wait for entry, don't in hurry, Keep SL, Book Profit as Your Daily Target
Entry only in Level

#GOLD WILL THE correction continue ATHResistance level:3760-3776-3791
Support levels:3752-3741-3731i expect a pullback 3737-3717 and if the bulls return the price to 3800.
my forecast on #gold is 3880.
By; Honey-trading!

BTC – Liquidity Grab at $116K Before Deep Correction?Description -
📊 Using the SMC Suite (Order Blocks, Liquidity Sweeps, FVG), BTC is approaching a critical supply zone ($116K–$118K).
• If price taps this orange zone, strong sellers are likely to step in.
• This move may trap late longs and grab liquidity before reversing.
• Downside targets sit around $100K initially, with extended demand near $85K–$80K.
🔑 Key Levels:
• Resistance/Supply: $116K–$118K
• Support/Demand: $100K, $85K–$80K
• Invalidation: Daily close above $122K
⚠️ This is not financial advice — just a liquidity-based interpretation of BTC’s structure .

Gold Analysis – 15-Minute Timeframe (September 5 , 2025)As observed, price approached our order block with a compressed structure, indicating controlled momentum. Along the way, several liquidity zones were formed, which may act as magnets for price movement.
For this position, we’re using a trailing stop to manage risk and maximize potential gains. As long as the price continues in our favor, we’ll stay aligned with the trend.
Good Luck

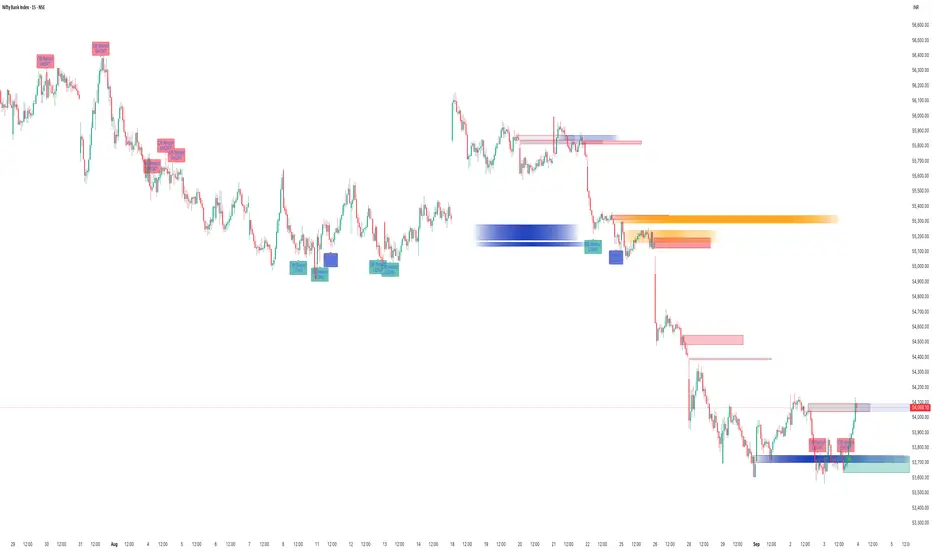
How To Capture Market Moves With SMC Suite Indicator?📊 SMC Suite Capturing Market Moves — Order Blocks • Breakers • Liquidity Sweeps • FVG
The chart above shows how the SMC Suite works in live market conditions on BankNifty. By combining Order Blocks, Breaker flips, Liquidity Sweeps, and Fair Value Gaps, the tool highlights where smart money is entering and where reversals are likely to occur.
🔹 Key Highlights from This Chart
1. Order Blocks — Bullish and bearish OBs correctly marked institutional footprints before price reversals.
2. Breaker Blocks — Invalidated OBs flipped into Breakers, giving continuation entries in trend direction.
3. Liquidity Sweeps — Several highs/lows were taken out, followed by reversals back into structure. These sweeps acted as confirmation for later setups.
4. Fair Value Gaps (FVGs) — The script marked imbalances that later served as retracement zones. Price respected these gaps, providing clean reversal opportunities.
5. Retest Alerts — Each zone was validated only on retests with optional wick rejection, reducing noise and improving signal quality.
⸻
🔹 Why It Matters
This chart shows that SMC Suite is not just drawing zones randomly — it creates a workflow:
• Sweep liquidity ➝ impulsive displacement ➝ zone creation (OB/Breaker/FVG) ➝ retest confirmation.
This makes it easier to follow institutional logic and align entries with high-probability setups.
📌 Conclusion
From strong downside moves to clean bounces, the SMC Suite captured both continuation setups (Breakers) and reversal setups (OB/FVG retests). The integration of liquidity logic makes it a practical trading tool across indices, forex, and crypto.
GBPUSD | PDL Sweep → Bullish Swing into PDH LiquidityThis setup is a textbook liquidity play: PDL sweep + CHoCH + refined demand POI. Targeting PDH liquidity next.
📍 Setup Context:
- Price swept the Previous Day Low (PDL), confirming a liquidity grab.
- A CHoCH has formed, signaling bullish intent.
- Refined POI (1H Demand Zone aligned with 15m FVG) gives a clean entry zone.
📊 Trade Plan:
- Entry: Buy limit inside refined POI
- Stop Loss: Below swept PDL (invalidation if daily close returns below)
- Take Profit 1: 1:2R (partial 50%)
- Take Profit 2: Previous Day High (PDH liquidity run)
- Take Profit 3 (extended): Daily imbalance above PDH
NOTE: You can still scale down to 5 minutes for a more refined entry..

GOLD 15 MIN OUTLOOK
Price is reacting from the OB zone above, showing signs of short-term rejection.
If the current support fails, I’m watching the 3,525 – 3,515 zone as the next reaction point.
Deeper liquidity sweep could target the 5min OB at 3,500 or even the Major POI around 3,485 before a strong bullish push.
As long as structure holds, I expect price to hunt liquidity below before moving higher toward 3,545+.
Plan:
Wait for confirmation in demand zones.
Look for bullish setups around 3,515 / 3,500 / 3,485 depending on how deep the pullback goes.
Target continuation toward new highs above 3,545.
