Gold Context: Structural Repair & The NFP CatalystRelated Tickers: COMEX_MINI:MGCG2026, COMEX:GC1!, CAPITALCOM:DXY
Analysis
1. Market Context (Correcting the Narrative)
You are correct to point out the terminology: the anomaly above us is a Poor High .
• The Structure: A Poor High (located near the 4500/4505 zone) indicates that the previous auction did not reach a natural conclusion. Buying simply dried up rather than being met by aggressive responsive selling.
• The Behavior: This creates "unfinished business." The market has a high statistical probability of eventually returning to this level to "repair" the high by creating a proper excess tail.
2. Inventory & Nuance (The Support Floor)
• The Base: While the Poor High acts as a magnet above, the market is currently leaning on the Put Support / 4430-4440 band .
• The Tension: We are caught in a classic "squeeze." The structure wants to go up to fix the high, but the short-term inventory is waiting for permission from the macro data.
• Gamma Influence: The Gamma Wall 0DTE sits right at that Poor High area, creating a "boss level" resistance that likely requires an external shock (like a weak NFP) to break through.
3. Fundamental Catalyst (Next 24 Hours)
• Today (Friday Jan 9):
• Non-Farm Payrolls (NFP): The decider for the "Structural Repair."
• Bullish Case: If NFP comes in weak (<50k), the dollar drops, and the auction initiates a move to repair that Poor High at 4505.
• Bearish Case: If NFP is hot (>80k), the repair is postponed. We likely flush lower to find deeper value before the Poor High magnet pulls us back next week.
Plan & Execution
• Bias: Neutral-to-Bullish (Targeting structural repair).
• Observation: The goal is the 4505 Poor High. I am looking for a "Floor hold" at 4430 during the NFP print to confirm the rotation toward the high.
• Risk: Be wary of the BCOM Rebalancing next week, which adds a layer of passive selling pressure.
Talk to you for the next update.
Orderflow

EURUSD: Institutional Narrative | Jan 08, 2026Macro Orderflow: Current flow remains Bearish. Price is delivering in correlation, so the primary objective is to stay in favor of the dominant orderflow.
The Framework: Watching the Premium Quadrant for a potential stage for a sell. Here are the key levels of interest:
1️⃣ The Premium Pivot: Watching 1.1693 (Premium Quadrant) and 1.1688 (approx. 62.5% Retracement)and an Hourly OB . This area aligns with Asia Buyside Liquidity—a logical spot for a liquidity grab.
2️⃣ The Institutional POI: Watching Asia's Buyside and how price reacts at this level is a key decider of today's activity.
3️⃣ Market Scenarios:
The Sweep: A run into any of the above zone followed by a Market Structure Shift (MSS) would confirm the bearish continuation.
The draw on Liquidity is at 1.1660 monday's low.
The Invalidation: Price sweeping Asia Sellside and delivering higher prices is an invalidation of the above context.

EURUSD analyticsAfter the downward movement on the chart, there was an upward wave. It began with the formation of an order block at the bottom. Then we saw a return to the order-block zone with a strong bullish candle.
In addition to this, I also see potential Wyckoff accumulation here, which can also reverse the price.
I expect a move toward the upper order block during this week.

EURUSD: Institutional Narrative & London Open FrameworkMacro Orderflow remains Bearish, but internal liquidity suggests a complex delivery today. Here is the framework:
1️⃣ The Liquidity Draw: Buyside Liquidity (BSL) sits at 1.1758 - 1.1760 (3-day high + Hourly Bearish OB). While this is the logical draw, current bearish flow makes a clean sweep questionable.
2️⃣ The Premium Pivot: Watching 1.1729. This aligns with the Premium level of the PD range and an Hourly Bearish OB. Expect a stall or rejection here if reached.
3️⃣ London Open Scenarios:
Bullish Drive: If London opens/holds near 1.1680, I anticipate a move toward the 1.1729 objective.
The Deviation: A print significantly below 1.1680 invalidates this intraday context.
The Sweep: A sweep of the 1.1759/70 highs could paradoxically fuel the move back toward 1.1729.
Market Note: We are in a week of non-correlated price delivery. Patience > Position.

USDJPY – Bullish Drive Toward Second Supply Zone (RTM Outlook)On the Daily structure, USDJPY remains bullish — and the current upward leg began from a key pivot, where price reacted to a QML level and broke its 1H descending trendline, giving strength to buyers and initiating this expansion.
Currently on the 4H, price is sitting inside the first supply zone: 156.900 – 157.200, which has already been tapped once. Buyer strength here is slightly weaker than the previous touch — but the bullish structure is still intact.
For that reason, my primary expectation remains continuation upward toward the second supply zone: 157.333 – 157.577.
That zone is where I will reassess – since that's where a true confrontation between buyers and sellers is more likely to determine whether a larger correction becomes meaningful.
On the 1H timeframe, price is already inside supply. Aggressive (reactive) traders might look for a CHOCH (Change of Character) inside the zone as a trigger to anticipate early correction — but for me, at this moment, I remain on the side of continuation until price reaches the second zone.
Right now, the most valuable action is simply watching how price behaves at the next zone, rather than predicting too early.
Updates will follow once price reaches that area — and that’s the moment where the real market decision will unfold.
`Pouryabdi

Forget the Textbook: A 30-Year Reality CheckA Big Policy Moment
A central bank (BOJ) just pushed interest rates to levels not seen in 30 years.
That’s not a routine tweak — that’s a regime shift.
Textbooks might suggest a clean, logical market response.
Reality? Markets got emotional. Fast.
Selling Got Loud
Instead of an orderly adjustment, selling pressure exploded.
Not just “price going down,” but effort going through the roof.
That’s where Volume Delta comes in — the net difference between buying and selling volume. It tells us who is pressing the gas pedal.
And in this case, sellers floored it.
When an Indicator Starts Yelling
Now here’s the interesting part.
Bollinger Bands weren’t applied to price…
They were applied to Volume Delta itself.
Result?
Volume Delta plunged far below its lower Bollinger Band.
That’s not normal selling.
That’s everyone trying to get out at the same time.
Does that mean price must reverse?
Nope. But it does suggest selling is becoming inefficient.
No Safety Net Below
Here’s the catch.
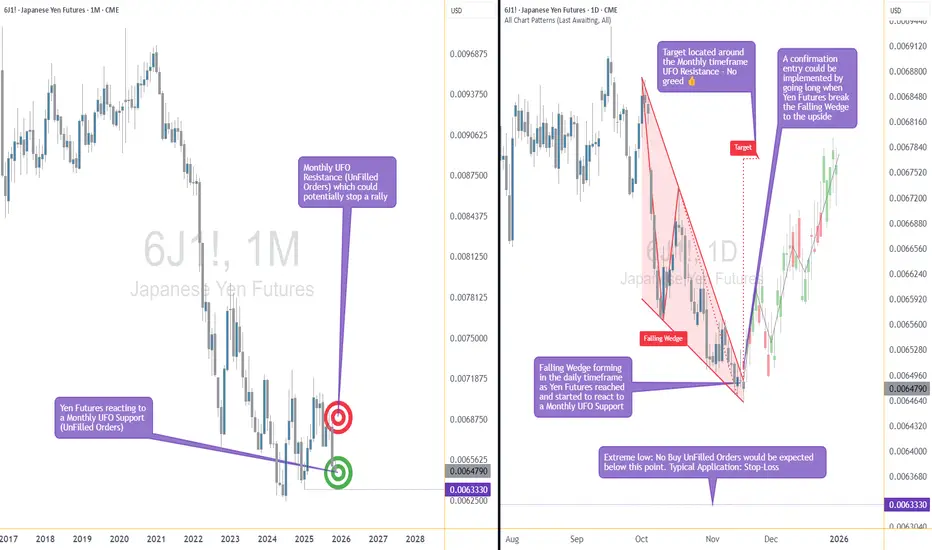
There are no meaningful UFO supports (UnFilled Orders) below current price.
No obvious institutional “safety net.”
Instead, only two old technical floors remain:
0.0063330
0.0062415
Think of them as floors, not trampolines. Price may react… or punch straight through.
Reaction Beats Guessing
This is where patience matters.
Extreme selling doesn’t mean “buy now.”
It means watch closely.
At those levels, traders are looking for:
Selling pressure slowing down
Price stabilizing
Daily closes showing acceptance or rejection
No assumptions. Only reactions.
Don’t Forget the Ceiling
Even if price bounces, there’s a ceiling waiting above.
A clear sell-side UFO resistance sits near 0.0065640.
That’s leftover supply — the kind that often stops rallies in their tracks.
So any upside move?
Treat it as corrective until structure says otherwise.
Contract Specs
This analysis uses both standard and micro futures to illustrate scalable risk. Japanese Yen Futures (6J) have a tick size of 0.0000005 with a $6.25 tick value and currently require roughly ~$2,800 in margin per contract, while Micro JPY/USD Futures (MJY) use a 0.000001 tick size with a $1.25 tick value and margin closer to ~$280. Margin requirements vary by market conditions and broker policies, and micro contracts can be especially useful when volatility expands following major macro events.
The Big Takeaway
Historic policy decisions don’t end stories — they start messy chapters.
Extreme Volume Delta shows stress, not certainty.
Structure decides what comes next.
When markets digest big shocks, the edge doesn’t come from predicting —
It comes from staying disciplined while everyone else reacts.
Want More Depth?
If you’d like to go deeper into the building blocks of trading, check out our From Mystery to Mastery trilogy, three cornerstone articles that complement this one:
🔗 From Mystery to Mastery: Trading Essentials
🔗 From Mystery to Mastery: Futures Explained
🔗 From Mystery to Mastery: Options Explained
When charting futures, the data provided could be delayed. Traders working with the ticker symbols discussed in this idea may prefer to use CME Group real-time data plan on TradingView: www.tradingview.com - This consideration is particularly important for shorter-term traders, whereas it may be less critical for those focused on longer-term trading strategies.
General Disclaimer:
The trade ideas presented herein are solely for illustrative purposes forming a part of a case study intended to demonstrate key principles in risk management within the context of the specific market scenarios discussed. These ideas are not to be interpreted as investment recommendations or financial advice. They do not endorse or promote any specific trading strategies, financial products, or services. The information provided is based on data believed to be reliable; however, its accuracy or completeness cannot be guaranteed. Trading in financial markets involves risks, including the potential loss of principal. Each individual should conduct their own research and consult with professional financial advisors before making any investment decisions. The author or publisher of this content bears no responsibility for any actions taken based on the information provided or for any resultant financial or other losses.

Whale Watching: What Institutional Flow Actually Tells Us
In the Ocean of Markets, the Biggest Players Leave the Deepest Wakes
Most retail traders stare at price.
Serious traders watch who is behind the move.
In the era of AI and real‑time data, you don't have to guess what the "smart money" might be doing. You can read their footprints in volume, order flow, and on‑chain behavior — then decide whether to swim with them or stay out of the way.
Who Are the Whales, Really?
"Whales" aren't mythical creatures. They're large players whose orders are big enough to move the market:
Hedge funds and prop firms
Pension and mutual funds
Investment banks and market‑making desks
In crypto: early adopters, exchange wallets, protocol treasuries and large funds
They don't trade like retail because they can't . Size forces them to:
Enter and exit over time
Hide intent with execution algorithms
Use levels where liquidity is deep enough to absorb flow
That's why their activity leaves patterns you can study.
Why Following Flow Matters More in the AI Era
AI and automation haven't made whales less important — they've made them more efficient:
Execution algos slice large orders into small pieces
Smart routing hunts for the best liquidity across venues
Portfolio models rebalance at increasingly precise trigger points
That means big decisions (accumulation, distribution, hedging, de‑risking) still show up in:
Unusual volume where price barely moves
Levels that absorb wave after wave of orders
On‑chain flows into and out of exchanges (for crypto)
You don't need to know who the whale is. You just need to recognize when "someone big" is quietly changing their exposure.
Three Practical Ways to Spot Whale Footprints
Volume That Doesn't Match the Candle
High volume but small candle body can signal accumulation or distribution.
Repeated volume spikes at the same level hint at a large resting order being filled.
Order Flow and Liquidity Behavior
Blocks and icebergs: large orders sliced into many smaller prints at the same price.
Support that "refuses" to break despite aggressive selling.
Resistance that repeatedly rejects pushes higher.
On‑Chain Flows (Crypto)
Big transfers to exchanges often precede potential selling pressure.
Big transfers from exchanges into cold wallets often align with accumulation.
Concentration in a few wallets can increase systemic risk.
AI tools can monitor all this in the background, pinging you only when something unusual happens.
Thinking in Terms of the Accumulation/Distribution Cycle
Zoom out and you see the same story play out over and over:
Accumulation – Big players quietly build positions while sentiment is bearish.
Markup – Price trends higher as demand overwhelms supply.
Distribution – Whales offload to latecomers near highs.
Markdown – Price grinds or flushes lower as supply dominates.
You can't know every motive behind every print. But you can ask:
"Does the current behavior look more like quiet accumulation or organised distribution?"
"Is volume confirming or contradicting the move?"
"Am I buying from strong hands or selling to them?"
How AI Can Help You Track Whales Smarter
Instead of manually staring at raw volume all day, AI‑driven tools can:
Tag and classify large prints and block trades
Detect recurring absorption at key levels
Aggregate on‑chain flows into simple dashboards (net inflows/outflows)
Alert you when "unusual" activity appears relative to normal behavior
Your edge isn't memorizing every tick — it's designing the rules for what counts as meaningful whale activity, and letting systems watch for you.
Staying Grounded: What Whale Watching Can't Do
It can't guarantee direction — whales hedge, scale, and reposition.
It can't replace risk management — big players can be early or wrong.
It can't turn a bad strategy into a good one — it can only improve timing and context.
Treat whale analysis as an extra lens, not a green‑light signal by itself.
Your Turn
How much weight do you give to institutional flow in your trading decisions?
Do you focus more on volume, order flow tools, or on‑chain metrics if you trade crypto?
Share what has (and hasn't) worked for you — your process might help someone else stop swimming blind.

The Anatomy of an Overextended Market MoveMarket Context: When Momentum Accelerates
Markets periodically enter phases where price accelerates rapidly, often driven by a combination of macro catalysts, positioning imbalances, and behavioral feedback loops. In such environments, momentum can appear self-reinforcing: higher prices attract more participation, which in turn pushes prices even higher. While these phases can feel decisive and convincing, they also introduce an important analytical question — is the move being accepted by the market, or is it simply expanding faster than structure can support?
This distinction matters because strong momentum does not automatically imply durability. In fact, the most aggressive moves often carry the seeds of their own instability, particularly when price begins to disconnect from commonly observed reference points such as volatility envelopes, prior value zones, and resting order clusters.
The recent advance examined in this case study provides a clear example of this dynamic: a structurally bullish resolution followed by a sharp acceleration that raises legitimate questions about sustainability.
Pattern Resolution Versus Move Sustainability
Classical chart patterns are useful because they describe how markets transition from balance to imbalance. A double bottom, for example, reflects a failed attempt by sellers to extend lower prices, followed by renewed demand. Once the neckline is cleared, the pattern is considered resolved.
However, pattern resolution only explains directional bias — it does not guarantee how price will behave after the breakout.
In practice, many pattern completions coincide with:
Early participants reducing exposure
Profit-taking activity near projected objectives
New positioning that is more sensitive to short-term adverse movement
As a result, the completion of a pattern can sometimes mark the end of a clean directional phase rather than the beginning of an extended one. This is especially relevant when the breakout is followed by aggressive price expansion rather than gradual acceptance.
Volatility Expansion and the Bollinger Band Framework
Bollinger Bands® are commonly misunderstood as directional indicators. In reality, they function as volatility envelopes, providing context for how far price has deviated from its recent mean.
When price trades:
Outside the upper band
After a gap higher
And remains extended for multiple sessions
it signals volatility expansion, not necessarily trend continuation.
From a statistical perspective, such conditions indicate that price has moved beyond its recent distribution range. From a behavioral perspective, they often reflect:
Late participation
Emotional decision-making
Reduced liquidity on one side of the market
None of these imply that price must reverse immediately. What they do imply is that the informational risk of continuation increases, while the probability of mean reversion back toward equilibrium also rises.
Mean Reversion as a Structural Tendency
Mean reversion is not a prediction tool. It is a structural tendency observed across liquid markets, driven by the constant interaction between:
Value discovery
Liquidity provision
Inventory management by participants
When price moves “too far, too fast,” it stretches these mechanisms. Liquidity providers become more selective, directional participants begin to manage exposure, and resting orders closer to the mean regain relevance.
Importantly, mean reversion does not require a bearish narrative. It simply reflects the market’s natural inclination to revisit areas where participation was previously deeper and more balanced.
In this context, mean reversion should be viewed as a risk consideration, not a directional conviction.
Order-Flow Structure
A key element of this case study is the alignment between classical technical projections and observable order-flow structure, described here through the lens of UnFilled Orders (UFOs).
UFOs represent areas where prior activity suggests the presence of resting interest that has not yet been fully executed. These zones often coincide with:
Prior consolidations
Structural inflection points
Pattern-derived objectives
In the current structure:
o An upper zone near 1.18350 aligns with:
The projected objective of the resolved pattern
UFO resistance
Likely areas of trade closure and sell on-field activity
o A lower zone near 1.16875 aligns with:
UFO support
Areas where price previously attracted participation
A logical mean reversion destination
The importance of these zones lies not in their precision, but in their confluence. When multiple frameworks point to the same areas, they tend to attract attention from a broader range of participants.
Why Overextended Moves Become Fragile
Overextended markets often appear strongest right before they become most sensitive. This is because:
Positioning becomes one-sided
Liquidity thins as fewer participants are willing to transact at extremes
Small shifts in order flow can have outsized impact
In such conditions, price does not need a major catalyst to retrace. It often only needs:
A pause in aggressive buying
Routine profit-taking
A minor shift in expectations
This fragility is what makes mean reversion a relevant consideration after sharp extensions, even within broader bullish structures.
Illustrative Trade Framework (Case Study Only)
To translate these concepts into a practical framework, consider the following illustrative structure, presented strictly as a case study.
o Context
Price has resolved a bullish pattern
Volatility has expanded sharply
Price is trading outside the upper Bollinger Band
o Area of Interest - Upper reference zone near 1.18350, where:
Pattern objectives converge
UFO resistance is present
Trade closure activity is likely
o Mean Reversion Reference - Lower zone near 1.16875, aligned with:
Buy UFO support
Prior participation
The statistical mean
o Risk Definition
Invalidation occurs if price demonstrates acceptance above the resistance zone rather than rejection
This framework highlights an important principle: mean reversion trades are defined by risk first, not by direction. They require patience, flexibility, and a clear understanding of when the underlying premise no longer applies.
Standard and Micro Contracts
This case study can be examined using both standard and micro futures contracts, which offer different exposure profiles while referencing the same underlying market. Understanding their basic specifications is essential, particularly when volatility expands and mean reversion risk increases.
o Standard Futures Contract (6E)
Minimum price fluctuation (tick): 0.000050 per Euro increment = $6.25
Typical margin characteristics: ~$2,700 per contract
o Micro Futures Contract (M6E)
Minimum price fluctuation (tick): 0.0001 per euro = $1.25
Typical margin characteristics: ~$270 per contract
Margin requirements are dynamic, not fixed. They are influenced by market volatility, exchange risk controls, and clearing firm policies.
From a risk-management perspective, the availability of both standard and micro contracts enables traders to align position size with conviction and uncertainty, rather than forcing binary exposure decisions.
Risk Management Considerations
Mean reversion setups carry unique risks. Unlike momentum trades, they often involve entering against recent price direction, which requires:
Smaller position sizing
Wider tolerance for initial adverse movement
Strict invalidation criteria
It is also important to distinguish between being early and being wrong. Overextended markets can remain extended longer than expected. Risk management exists to ensure that such scenarios do not result in disproportionate losses.
Ultimately, the objective is not to capture every retracement, but to participate selectively when structure, volatility, and order-flow context align.
Data Consideration
When charting futures, the data provided could be delayed. Traders working with the ticker symbols discussed in this idea may prefer to use CME Group real-time data plan on TradingView: www.tradingview.com - This consideration is particularly important for shorter-term traders, whereas it may be less critical for those focused on longer-term trading strategies.
General Disclaimer
The trade ideas presented herein are solely for illustrative purposes forming a part of a case study intended to demonstrate key principles in risk management within the context of the specific market scenarios discussed. These ideas are not to be interpreted as investment recommendations or financial advice. They do not endorse or promote any specific trading strategies, financial products, or services. The information provided is based on data believed to be reliable; however, its accuracy or completeness cannot be guaranteed. Trading in financial markets involves risks, including the potential loss of principal. Each individual should conduct their own research and consult with professional financial advisors before making any investment decisions. The author or publisher of this content bears no responsibility for any actions taken based on the information provided or for any resultant financial or other losses.

EURGBP – HTF Context Before EntriesBefore thinking about entries, I focus on what phase the market is in .
Step 1 – Finish the bearish campaign
Price completed a bearish HTF ABC sequence at C .
Until that C was reached, I had no reason to look for longs. Campaigns don’t flip mid-delivery.
Step 2 – Bias is allowed to change (not forced)
Only after the bearish sequence completed did price:
Sweep sell-side
Displace bullish
Shift structure
This is where a bullish breaker block was formed.
Step 3 – Define the only valid trade location
Inside that breaker sits a HTF (18H) FVG .
That PD array defines where long trades are allowed.
Not above it.
Not below it.
Only inside the breaker .
Step 4 – Expansion is not an entry
Price expanded impulsively from the breaker, printing a new bullish sequence and reaching short-term objectives.
This move confirms direction , but it does not complete delivery .
The HTF FVG remains unrebalanced.
Step 5 – Do nothing until delivery is complete
As long as price stays above the breaker without rebalancing the HTF PD array, there is no trade .
When (and only when) price returns into the breaker and rebalances the HTF FVG, I will drop to lower timeframes to look for:
Inducement
Structure shift
Clean delivery for execution
This post is about market phases and location , not prediction or signals.
Patience > precision.
Not financial advice. Educational purposes only.

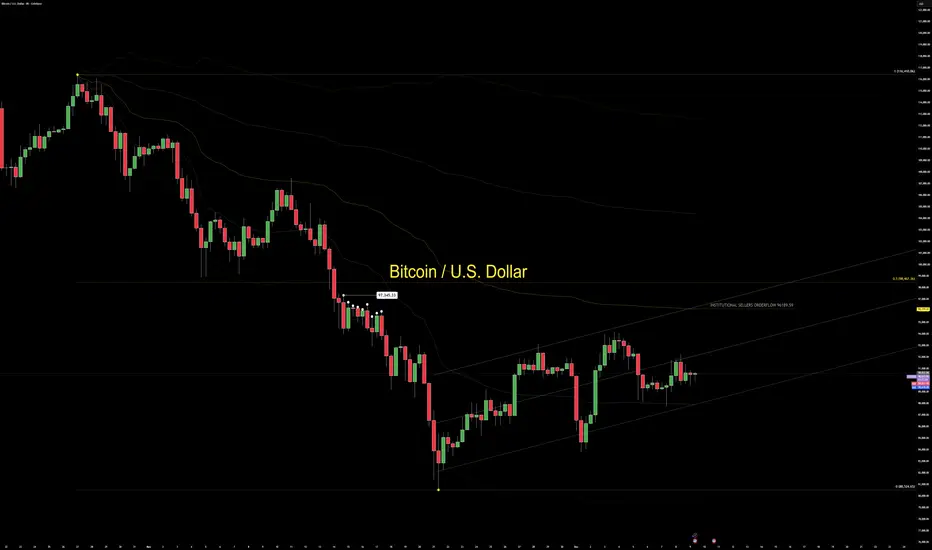
BTCUSD — Tuesday Behavior Map | Waiting for DollarMarket Context
BTCUSD is holding tight ahead of key U.S. dollar data.
The dollar sits in oversold conditions, and BTC has spent several days absorbing buy orders at the same prices.
Price is not breaking down. It is holding and inviting participation.
This behavior often appears when the market wants traders committed before the real move develops.
Wrong Assumption
The common interpretation is that repeated long setups inside absorption must signal a safe buying zone.
In an event week, this assumption breaks down.
When the market offers the same type of entry before major USD data, the setups are usually valid only for short-term trades, not for comfortable swing exposure.
Absorption before a catalyst is positioning, not direction.
CORE5 Lens
MSM (Structure):
Short-term structure on the daily remains bullish inside the range.
On the monthly, BTC trades inside a larger bearish leg, extended toward sell-side conditions. A natural rotation toward fairer prices would not be unusual.
DGM (Geometry):
BTC sits deep in that monthly leg.
An eventual move toward the 98.467 region aligns with normal geometry, not a trend change by itself.
VFA (Volume):
Range-volume behavior supports a potential rotation higher.
Order flow around 96k–97k shows active participation from larger players without confirmation of intention.
OFD (Order Flow):
Price sprinted away from the 98.467–97.345 zone without a retest.
This left a clean liquidity pool above.
In FOMC week, the market can spike through that zone before deciding the true direction.
PEM (Execution Behavior):
Data releases can move price far intraday, but they cannot force a daily close against the underlying algorithm without real participation behind it.
Professional focus stays on the daily close, not the intraday reaction.
Execution Context
Event-week structure behaves differently.
Daily and 8H levels carry the real information.
Intraday rotations are thinner and more reactive because larger players wait for the catalyst.
Spikes inside the range are normal and do not reveal intent.
The meaningful signal appears only after participation returns post-data.
This is a week where structure is valid, signals are fragile, and confirmation comes from the higher-timeframe close.
Takeaway
BTC is not signaling direction.
It is preparing for new information.
— CORE5DAN
Institutional Logic. Modern Technology. Real Freedom.
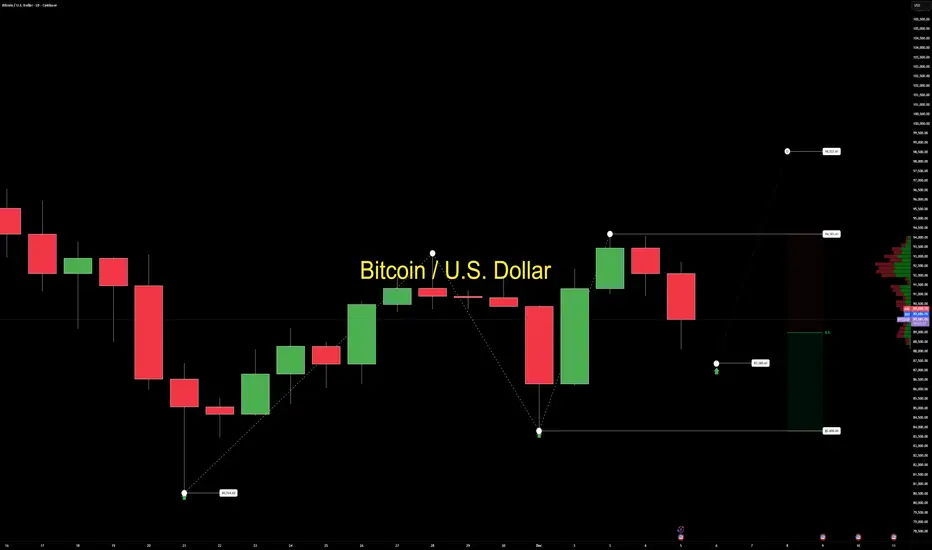
BTCUSD: Trading at Deep DiscountBTCUSD is trading inside a clear monthly discount zone, but the question is whether buyers can generate enough volume commitment to sustain a move higher. On the chart, price remains positioned in discount while the Dollar sits at its own discount levels, a combination that typically creates two-sided volatility rather than clean continuation.
Next week’s news flow increases the probability of liquidation-based rotation before the true directional leg. This is where traders often misread traps as signals, and where discipline matters more than conviction.
From a CORE5 lens, today’s read is driven by three pillars:
MSM — Market Structure Mapping: Monthly structure shows 90% discount with unresolved imbalance under the lows.
VFA — Volume Flow Analytics: No clear participation shift yet; buyers need real flow behind the move.
PEM — Precision Execution Modeling: Every trade here requires ultra-precise entries and fast stop protection.
Despite the attractive location, the imbalance under the monthly lows forces every setup to be analyzed twice. Stops must move to breakeven quickly. This is not a place for relaxed risk.
As of Friday evening, BTCUSD sits in a structurally strong buy zone, but confirmation depends entirely on volume entering the tape. Without that, the rotation remains potential rather than validated.
The daily range is defined by:
Low: 83,800
High: 94,181 (first target if volume confirms rotation)
Weekend probability is limited unless Sunday produces a clear volume spike.
The Core Message
BTCUSD is positioned in a high-value discount zone, but only volume can confirm the next rotation.
83,800 defines the structural low; 94,181 is the first clean upside objective if participation enters.
Trade the behavior, not the story.
— CORE5DAN
Institutional Logic. Modern Technology. Real Freedom.
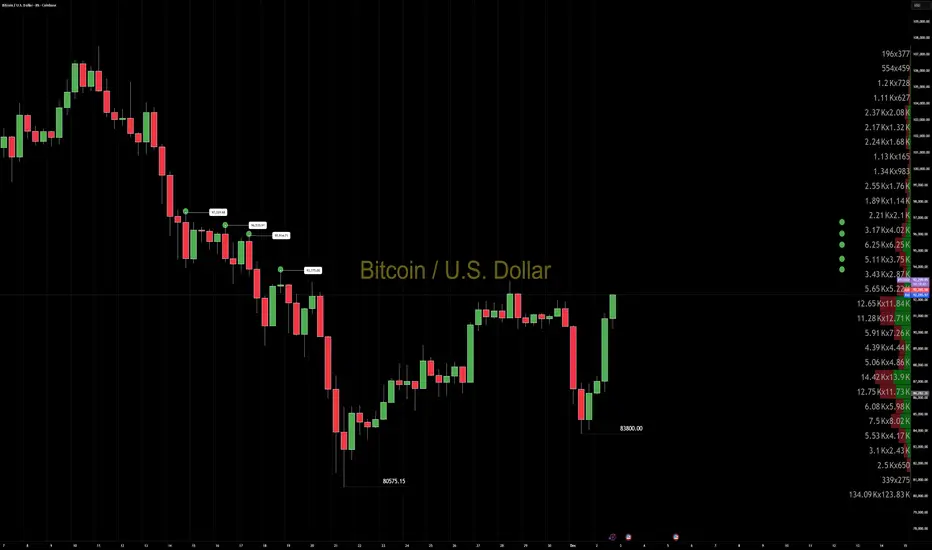
BTCUSD: Clean Higher Low and Orderflow Drive Toward MidrangeBTCUSD confirmed a new higher low at 83,800.
Today’s session delivered a strong orderflow boost that cleared the daily highs and pushed price back toward midrange.
From a CORE5 lens — using Order Flow Dynamics and Volume Flow Analytics — the tape shows sustained buyer aggression after the higher low formed.
Key upside levels ahead:
93,775
95,914
96,535
97,329
As long as the 83,800 higher low holds, BTCUSD maintains a clean intraday bullish behavior profile into midrange rotation.
Trade the behavior, not the story.
— CORE5DAN
Institutional Logic. Modern Technology. Real Freedom.
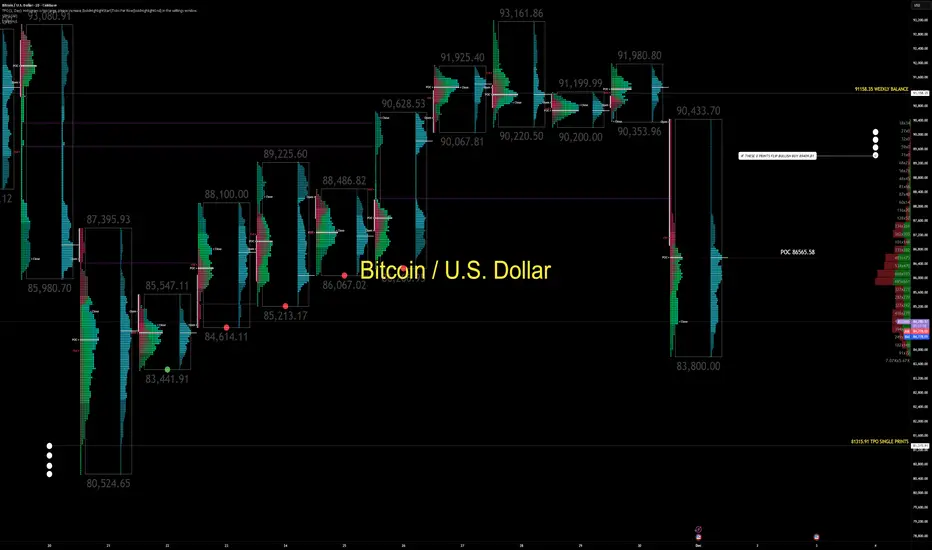
BTCUSD: Midrange Trap With One Behavior Line That Decides DirectBTCUSD respected weekly balance, rallied sharply, and left a clear volume imbalance behind.
Today’s session opened with a bearish TPO profile, attacking the lows immediately after midnight.
The chart presents a classic midrange manipulation environment.
From a CORE5 lens, today’s read is driven by two pillars:
Volume Flow Analytics (VFA) and Order Flow Dynamics (OFD).
1. The Key Behavior Level: 89,409
Today’s TPO left four critical prints around 89,409.
That zone is the behavior divider:
Below it: sellers remain in control, downside work unfinished.
Above it: structure flips decisively bullish.
BTCUSD remains “hidden behind” the weekly candle as long as it trades under 89,409.
2. Range Low Liquidity Still Unfinished
BTC has already attacked most local range lows except the deeper pocket at 83,441.91.
Below that sits a clean liquidity pool:
Buying tails and single prints around 81,315.91
Classic range-low liquidation structure
A pattern BTC often completes before resetting upward
This keeps downside behavior technically open despite weekly balance strength.
3. Midrange = Manipulation Zone
BTC is mid-structure.
This is where institutional players defend higher timeframe bias while algos rotate price intraday to trap both sides.
Execution guidelines:
Prioritize 15m structure shifts
Track behavior flips around 89,409
Expect two-sided noise
Treat midrange as deception territory, not confirmation territory
On higher timeframes, BTC remains inside a monthly structure mapping zone near 95 percent discount—explaining recurring dip demand without removing intraday trap risk.
The Core Message
89,409 is the line that defines directional clarity.
Below it: behavior stays two-sided and manipulative.
Above it: bullish structure re-establishes with real conviction.
Liquidity remains open at 83,441.91 and 81,315.91.
Trade the behavior, not the story.
— CORE5DAN
Institutional Logic. Modern Technology. Real Freedom.
Bitcoin at the Edge – What Comes Next?Over the past couple of months, Bitcoin has been navigating a complex mix of macro shifts, liquidity changes, and sector-specific catalysts that, in our opinion, have pushed the market into a critical decision zone. Sentiment has become increasingly divided: long-term structural bulls remain confident, while short- and medium-term flows have turned more cautious.
1. Recent Developments & Market Sentiment
In the past half a year, crypto markets have been influenced by several overlapping narratives. Regulatory tone has eased globally, with more pro-innovation stances emerging in key regions. Political developments—particularly renewed efforts in the U.S. toward clearer crypto frameworks—have added a layer of optimism. Institutional participation has also continued to expand, with ETF flows stabilizing after earlier periods of volatility.
Yet despite these supportive headlines, market behavior has shown hesitation and sold off in the past month. In our opinion, this was driven primarily by the resurfacing of Trump’s aggressive tariff threats, reigniting trade-war fears, a sharp drop in expected Fed rate cuts, and massive institutional ETF outflows plus leveraged liquidations. Sentiment has flipped from extreme greed to extreme fear.
In our view, the inability to sustain acceptance at recent highs points to exhaustion in the prior uptrend. Overall sentiment is less euphoric and more cautious—this current zone would likely be a battleground between long-term accumulation and shorter-term mean reversion.
2. The Underlying Driving Forces
Bitcoin’s medium- and long-term structural drivers remain intact: institutional adoption, the growing integration of digital assets into traditional finance, the post-halving supply dynamics, and Bitcoin’s increasing correlation with broader macro conditions.
Macro factors such as real yields, liquidity conditions, and risk appetite continue to play a major role. As markets position for next year’s rate lowering expectations and potential fiscal shifts, Bitcoin, in our opinion, is behaving more like a liquidity-sensitive asset than a speculative outlier. This is especially apparent in how it has reacted to major economic releases and policy signals. The bottomline is that Bitcoin’s major swings are increasingly tied to macro liquidity flows—the same forces that drive equities, especially high-beta tech.
Market structure is equally important. Bitcoin’s auction process—how price accepts or rejects value—often drives multi-month cycles. When value areas break or hold, the market tends to transition into new regimes. That is exactly where the market appears to be now.
3. Chart Analysis – A True Decision Area
Bitcoin is currently sitting at what we believe is a major inflection point: the 2024 Low-Value Area (LVA), where Bid Block 1 formed in March 2025. This zone acted as the structural base where buyers initiated up to new all-time highs earlier this year.
From July to October 2025, the market attempted to accept near the top of the range, with buyers defending Bid Block 2. By mid-October, however, bid support weakened. Longs unwound, driving price back into Bid Block 1 near 84,600, which is confluent with yearly support and the prior trendline break from November 2024.
Going into the next quarter, Bitcoin sits atop a critical area of demand. In our opinion, how price responds here could determine whether this pullback stabilizes or it becomes a deeper liquidation phase.
Key Levels:
82,000 – 2025 developing low / Bid Block 1 low / 2024 TL breakout
77,000 – 2024 VPOC
Bearish Scenario:
If buyers cannot recover quickly back above 87,700 (2024 VAH), and bids fail to hold the 81,000–77,000 region, the market may open the door to further long liquidation. That could lead to a move through the 2024 Value Area, potentially targeting the 60,000 region (2024 VAL).
Bullish Scenario:
If buyers reject strongly up from the 82,000 area, a move through 94,200 (Bid Block 1 high) could shift control back toward buyers. This may open a path toward 100,000/102,550 (2025 developing VAL / Bid Block 2 low), where sellers could be expected. Acceptance above that could set up a move toward 123,050 (2025 developing VAH) and possibly a revisit of the all-time highs.
Neutral Scenario:
Without any new catalyst, the market may consolidate and form a two-way auction between 99,700 and 82,000 as it digests recent volatility. This could serve as a base for the next directional expansion.
In our view, how Bitcoin behaves around this zone will set the tone heading into 2026. I’d love to hear your views—drop your thoughts in the comments and give this post a boost so others can join the discussion.
This post reflects our personal market views and is for educational discussion only. It should not be interpreted as financial or trading advice. Market conditions can change rapidly, and the levels discussed here may shift as new information emerges. Always conduct your own research and consult a licensed financial professional before making trading decisions.

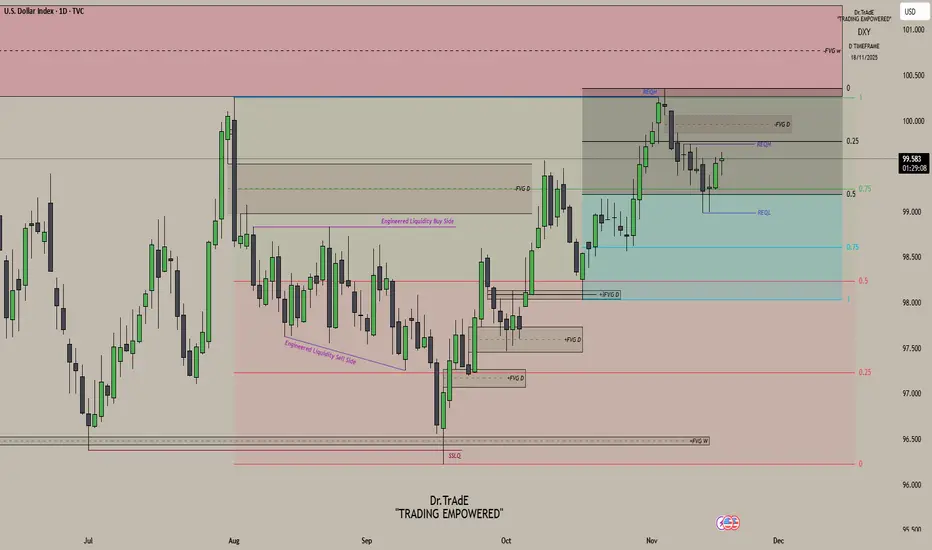
Understanding Dollar Structure and DeliveryCurrent price action is unfolding inside the Intermediate Dealing Range, defined by the November 5 high and the October 17 low. DXY is trading in the premium of its 20 day IPDA range, with equal highs sitting just under the 0.25 level as my first draw on liquidity and a Daily SIBI resting right above it. If price reacts at those equal highs, fine, that is expected. But if it keeps pressing higher, the Daily SIBI is the next draw, no question. And if price shifts with displacement from either of those levels, I am looking straight to the relative equal lows first, then 98.563 below the 0.75 level. With NFP coming up, the fundamentals can blow through structure, but if the dollar shows weakness, price is reaching into discount. That is the only direction it can go.
If you want to understand the delivery here, study this chart from August 1. Watch how price cleans up inefficiencies, hunts liquidity, and moves between premium and discount with every shift in order flow. Every displacement points to the next target. The PD arrays along the path are not decoration, they are the roadmap. I have marked the August 1 high and the September 18 low as the larger dealing range, and the November 5 high with the October 17 low as the Intermediate Dealing Range. That is the framework. That is where price is operating right now. If you want to understand the current delivery, this is the range you need to focus on.
Study the chart and you will see exactly why price moved the way it did. Yes, it is hindsight, and that is the whole point. Understanding past delivery helps you see future price action with real precision. The levels that got targeted here were not random. They were the logical draws. Learn that, and you stop guessing. The same delivery repeats again and again.
A High-Impact Support Zone Meets a Breakout StructureIntroduction
Markets occasionally compress into areas where structure, momentum, and historical buying pressure align with surprising precision. When that compression occurs at a major higher-timeframe floor, traders often pay closer attention—not because the future is predictable, but because the chart reveals a location where price behavior typically becomes informative.
The current case study centers on a market pressing into a high-impact support zone visible on the monthly chart, while the daily chart displays a falling wedge pattern that has gradually narrowed the range of movement. This combination often highlights moments where the auction process is nearing a decision point. The purpose here is to dissect that confluence using multi-timeframe structure, pattern logic, and broad order-flow principles—strictly for educational exploration.
Higher-Timeframe Structure (Monthly)
The monthly chart shows price approaching a well-defined support area between 0.0065425 and 0.0063330, a region that has acted in the past as a base for significant reactions. These areas often develop because markets rarely absorb all buy interest in a single pass; pockets of unfilled orders may remain, leading to renewed reactions when price returns.
This type of zone does not guarantee a reversal. However, historically, when price reaches such levels, traders tend to monitor whether selling pressure slows or becomes less efficient. In this case, the structure suggests a recurring willingness from buyers to engage at these prices, forming a foundation that has held multiple swings.
The presence of a clear, higher-frame resistance at 0.0067530 anchors the broader range. When price rotates between such boundaries, the monthly context often acts as a roadmap: major support below, major resistance above, and room in between for tactical case-study exploration.
Lower-Timeframe Structure (Daily)
Shifting to the daily chart, price action has carved a falling wedge, a pattern often associated with decelerating downside movement. In wedges, sellers continue to push price lower, but with diminishing strength, as each successive low becomes less effective.
This type of compression structure can provide early evidence that the auction is maturing. Traders studying such patterns often watch for:
tightening of the range,
shorter waves into new lows,
initial signs that buyers are defending intraday attempts to drive price lower.
The daily wedge in this case sits directly on top of the monthly support zone—an alignment that strengthens its analytical relevance. The upper boundary of the wedge sits near 0.0065030, and a break above that line is often interpreted as price escaping the compression phase.
Multi-Timeframe Confluence
Multi-timeframe confluence arises when higher-frame structure provides the background bias and lower-frame patterns offer the tactical trigger. In this case:
The monthly chart signals a historically responsive support zone.
The daily chart shows structural compression and slowing downside momentum.
The interaction between them creates a scenario where educational case studies tend to focus on breakout behavior, as the daily timeframe may provide the first evidence that higher-frame buyers are engaging.
This confluence does not imply certainty. It simply highlights a location where structure tends to become more informative, and where traders often study the transition from absorption to response.
Order-Flow Logic (Non-Tool-Specific)
From an order-flow perspective, strong support zones typically develop where prior buying activity left behind unfilled interest. When price returns to that region, two things often happen:
Sellers begin to encounter difficulty driving price lower, as remaining buy orders absorb their activity.
Compression patterns form, as the market oscillates in a tightening range while participants test whether enough liquidity remains to cause a directional shift.
A breakout of the daily wedge represents a potential change in the auction dynamic. While sellers are still active inside the wedge, a breakout suggests their pressure may have become insufficient to continue the sequence of lower highs and lower lows. Traders studying market transitions often use such moments as part of hypothetical scenarios to understand how imbalances evolve.
Forward-Looking Trade Idea (Illustrative Only)
For educational purposes, here is how a structured case study could frame a potential opportunity using the discussed charts:
Entry: A hypothetical entry could be placed above the falling wedge, around 0.0065030, once buyers demonstrate the ability to break outside the compression structure.
Stop-Loss: A logical invalidation area in this case study would be at or below the monthly support, around 0.0063330, where failure would indicate the higher-timeframe zone did not hold.
Target: A purely structural wedge projection would suggest a target near 0.0067695, aligning closely with the broader resistance region on the monthly chart.
These price points yield a reward-to-risk profile that is measurable and logically linked to structure, though not guaranteed. This case study exists solely to illustrate how support-resistance relationships and pattern logic can be combined into a coherent, rules-based plan, not as an actionable idea for trading.
Yen Futures Contract Context
The larger (6J) and micro-sized (MJY) versions of this futures market follow the same underlying price but differ in exposure and margin scale. The standard contract generally carries a greater notional value and therefore translates each price movement into a larger monetary change. The micro contract mirrors the same structure at a reduced size, allowing traders to adjust position scaling more precisely when navigating major zones or breakout structures such as the one discussed in this case study:
6J equals 12,500,000 Japanese Yen per contract, making it suitable for larger, institutional players. (1 Tick = 0.0000005 per JPY increment = $6.25. Required Margin = $2,800)
MJY equals 1,250,000 Japanese Yen per contract, making it suitable for larger, institutional players. (1 Tick = 0.000001 per JPY increment = $1.25. Required Margin = $280)
Understanding margin requirements is essential—these products are leveraged instruments, and small price changes can result in large percentage gains or losses.
Risk Management Considerations
Strong support zones can attract interest, but risk management remains the foundation of any structured approach. Traders studying these transitions typically:
size positions relative to the distance between entry and invalidation,
maintain clear exit criteria when structure fails,
avoid adjusting stops unless the market has invalidated the original reasons for the plan,
adapt to new information without anchoring to prior expectations.
These principles emphasize the importance of accepting uncertainty. Even at major support zones, markets can remain volatile, and scenarios may unfold differently than anticipated.
When charting futures, the data provided could be delayed. Traders working with the ticker symbols discussed in this idea may prefer to use CME Group real-time data plan on TradingView: www.tradingview.com - This consideration is particularly important for shorter-term traders, whereas it may be less critical for those focused on longer-term trading strategies.
General Disclaimer:
The trade ideas presented herein are solely for illustrative purposes forming a part of a case study intended to demonstrate key principles in risk management within the context of the specific market scenarios discussed. These ideas are not to be interpreted as investment recommendations or financial advice. They do not endorse or promote any specific trading strategies, financial products, or services. The information provided is based on data believed to be reliable; however, its accuracy or completeness cannot be guaranteed. Trading in financial markets involves risks, including the potential loss of principal. Each individual should conduct their own research and consult with professional financial advisors before making any investment decisions. The author or publisher of this content bears no responsibility for any actions taken based on the information provided or for any resultant financial or other losses.
The Pattern That Looked Bullish… Until It Didn’t1. The “Too Good to Be True” Setup
You’ve seen it a hundred times — that shiny W-shaped pattern that screams reversal.
Traders spot it, celebrate it, and rush in before it even completes.
But not every double bottom deserves a standing ovation. Sometimes, what looks like a powerful comeback is actually the calm before another dip.
2. Meet the Real Players: FO vs. UFO
Behind every pattern hides a tug-of-war between two invisible forces:
FO (Filled Orders): Where buyers already did their job. The gas tank’s empty.
UFO (UnFilled Orders): Where fresh buyers are still waiting. That’s where the real fuel sits.
In our current setup, price bounced from an FO zone that already spent its energy.
The next UFO zone — the untouched demand — sits lower.
Translation? The market might need one more leg down to refuel before any real rally begins.
3. The Bear Hiding Inside the Bull
Chart shapes can lie.
Order flow doesn’t tend to.
When price sits on an FO support and the next UFO level is far below, odds tilt toward a break, not a bounce.
It’s like jumping on a trampoline that’s already been stretched too far — it might not spring you up again this time.
4. Rethink “Confirmation”
Pattern traders often buy the moment they spot symmetry. Smart traders wait for liquidity confirmation — the moment unfilled demand actually engages.
If that doesn’t happen, all you’ve got is a good-looking shape on a tired level.
5. The Real Lesson
Patterns attract attention.
Order flow reveals intent.
Patience separates analysis from impulse.
The next time a chart whispers “reversal,” ask yourself: Is it running on new energy or recycled hope?
Want More Depth?
If you’d like to go deeper into the building blocks of trading, check out our From Mystery to Mastery trilogy, three cornerstone articles that complement this one:
🔗 From Mystery to Mastery: Trading Essentials
🔗 From Mystery to Mastery: Futures Explained
🔗 From Mystery to Mastery: Options Explained
When charting futures, the data provided could be delayed. Traders working with the ticker symbols discussed in this idea may prefer to use CME Group real-time data plan on TradingView: www.tradingview.com - This consideration is particularly important for shorter-term traders, whereas it may be less critical for those focused on longer-term trading strategies.
General Disclaimer:
The trade ideas presented herein are solely for illustrative purposes forming a part of a case study intended to demonstrate key principles in risk management within the context of the specific market scenarios discussed. These ideas are not to be interpreted as investment recommendations or financial advice. They do not endorse or promote any specific trading strategies, financial products, or services. The information provided is based on data believed to be reliable; however, its accuracy or completeness cannot be guaranteed. Trading in financial markets involves risks, including the potential loss of principal. Each individual should conduct their own research and consult with professional financial advisors before making any investment decisions. The author or publisher of this content bears no responsibility for any actions taken based on the information provided or for any resultant financial or other losses.
BTC/USD WEEKENDERBTC remains in a controlled downtrend, trading within a bearish range between 116.432 and 98.952, holding near the key 100.996 level. Thursday’s daily low was liquidated and sharply reclaimed — confirming absorption on both sides of the market. Price structure has now printed a fourth consecutive inside day, showing compression while red daily highs remain exposed. Yesterday’s New York session stretched higher into the close, keeping short-term bias constructive within the broader range.
The current plan into the weekend is to monitor for a measured retracement toward the 105.000 area — a zone aligning with short-term equilibrium inside the larger bearish range. This level provides a clean reference for liquidity behavior and potential continuation signals into next week.
The IMF warned this week of rising global risk complacency, with high debt and inflated assets raising the chance of a sharper correction. Meanwhile, crypto shows quiet structural strength beneath the surface. Whales absorbed around 30,000 BTC and 400,000 ETH this week near the 100.996 volatility low, aligning with steady ETF inflows and falling exchange balances.
Smart money moves first — absorption always precedes expansion.
Discipline defines conviction, not direction.
— Institutional Logic. Modern Technology. Real Freedom.

The Double Bottom Trap That Traders Might Miss1. The Comfort Zone of Classic Patterns
Few formations attract traders’ attention like a double bottom. It’s one of those timeless chart patterns that promise hope after a long decline—a visual story of selling exhaustion followed by a bullish reversal.
But markets rarely reward what’s obvious. In futures trading, especially when examining instruments like Bitcoin Futures (BTC) and Micro Bitcoin Futures (MBT), patterns are only half the story. What truly moves price isn’t just the shape on the chart—it’s the order flow behind it.
That’s where understanding FO (Filled Orders) and UFO (UnFilled Orders) becomes essential. Both represent past and potential liquidity imbalances, and reading their relationship can transform how traders interpret “classic” setups.
2. The Bitcoin Setup: A Tale of Two Bottoms
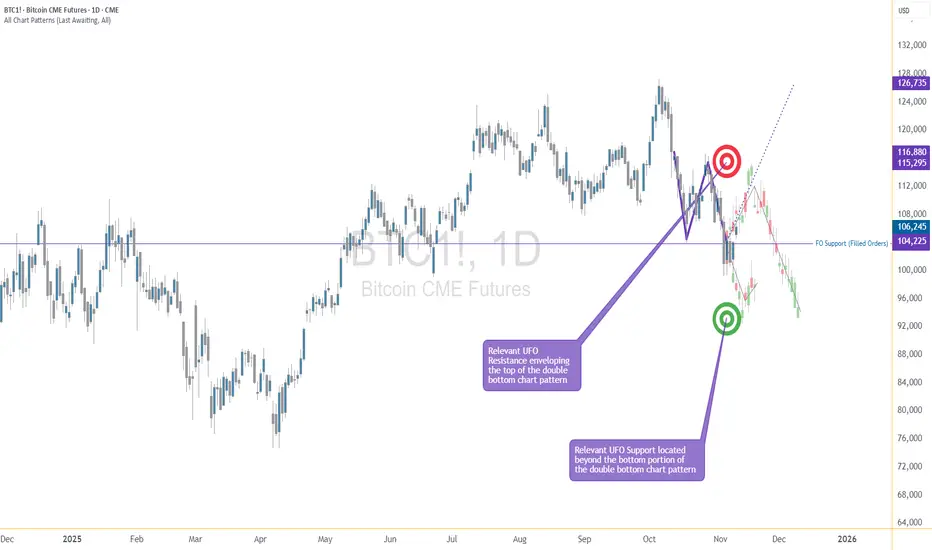
The current BTC daily chart paints what seems like a textbook double bottom. Two price troughs form near the same horizontal area around $104,000, setting up the typical “W” shape many traders see as a bullish reversal pattern.
However, when we dig deeper into the order flow structure, the illusion begins to fade.
A FO Support level exists near $103,860, meaning that this area previously attracted enough buyers to halt a decline—but those orders have already been filled and we know this given the fact that price turned at that price level before.
The next UFO Support zone sits much lower, around $95,640. That’s where unfilled buy orders are expected to remain waiting, untouched.
This distinction matters. While FO zones mark previous turning points, UFO zones highlight potential turning points that still contain resting liquidity. In simple terms, FO areas represent “used energy,” while UFO areas represent “stored energy.”
3. FO vs. UFO – The Order Flow Reality Check
Let’s define these two concepts with precision:
FO (Filled Orders): Price zones where significant buying or selling already occurred. These levels once reversed price, but because those orders were executed, fewer remain to defend the level again.
UFO (UnFilled Orders): Price zones containing pending buy or sell orders not yet triggered. They represent areas of fresh imbalance and therefore carry a higher probability of influencing future price moves.
In our Bitcoin case, the FO Support around $103,860 has done its job already—it stopped price before. But now, the unfilled buying interest lies lower, implying that the market may need to travel down to reach fresh demand at $95,640.
On the other side, UFO Resistance hovers near $112,410, enveloping the top of the double bottom structure. Should the price rebound toward that level, sellers waiting there could re-enter the scene, potentially capping any bullish recovery.
The conclusion? This pattern isn’t as bullish as it looks.
4. When Bullish Shapes Hide Bearish Probabilities
Most traders spot the double bottom and immediately think “trend reversal.” Yet, the distance between FO and UFO levels tells a more subtle story.
Since FO Support levels carry reduced strength after being tested, they’re more likely to break than hold. In this context, the probability favors a downside continuation rather than an immediate bounce.
If price breaches $103,860, the next probable destination becomes the UFO Support at $95,640. Only then, after reaching that pocket of unfilled demand, might a significant rebound have higher odds.
It’s a reminder that technical patterns, while valuable, must always be filtered through liquidity context. A pattern without order flow validation is like reading the market’s outline without its story.
5. Quantitative Insight: A Probabilistic Lens
Think of this in probabilistic terms:
When FO zones sit above UFO zones, the market often continues toward the unfilled liquidity.
When UFO zones lie closer to current price, reversals occur faster because demand (or supply) is still waiting to be executed.
In our example, BTC shows a larger gap between FO and UFO support levels, signaling lower immediate reversal odds. The chart may appear bullish, but the underlying order flow distribution points to weakness first, strength later.
This is not a prediction—it’s an observation of potential. It allows traders to structure their expectations based on where fresh participation is more likely to emerge.
6. Risk Management: Navigating the Trap
For traders considering setups around this structure, risk management is crucial.
Entry awareness: Avoid entering long positions purely because a double bottom “looks bullish.” Consider waiting for evidence of unfilled demand being triggered (confirmation at or near UFO Support).
Stop-loss placement: Stops below FO Support can easily be hunted in liquidity sweeps; better to align risk control with genuine unfilled demand areas.
Reward-to-risk thinking: A test of the UFO Support near $95,640 could later offer a more favorable upside-to-downside ratio than buying prematurely at $104,000.
Remember, pattern-based entries without liquidity confirmation often carry poor asymmetry—small upside with large downside risk.
7. Futures Structure and Margin Awareness
Both BTC and MBT represent Bitcoin exposure via futures contracts, but their sizing differs dramatically.
BTC equals 5 Bitcoin per contract, making it suitable for larger, institutional players. (1 Tick = 5 = $25. Required Margin = $132,500)
MBT, the Micro Bitcoin Futures, equals 0.1 Bitcoin per contract, offering flexibility for smaller accounts and finer position scaling. (1 Tick = 5 = $0.50. Required Margin = $2,600)
Understanding margin requirements is essential—these products are leveraged instruments, and small price changes can result in large percentage gains or losses.
8. Key Takeaway: The Hidden Lesson
This entire setup illustrates a powerful educational point:
Chart patterns may draw the eye, but order flow tells the truth.
The double bottom may invite buyers, but the imbalance between FO and UFO zones exposes an underlying weakness. Traders who rely solely on visual patterns may walk straight into a trap. Those who align patterns with liquidity insights, however, read the market at a deeper level.
In the current context, BTC and MBT might need to visit lower support levels before finding true stability. Watching how price behaves around these unfilled order zones will reveal whether this double bottom turns into a lasting floor—or just another false start.
When charting futures, the data provided could be delayed. Traders working with the ticker symbols discussed in this idea may prefer to use CME Group real-time data plan on TradingView: www.tradingview.com - This consideration is particularly important for shorter-term traders, whereas it may be less critical for those focused on longer-term trading strategies.
General Disclaimer:
The trade ideas presented herein are solely for illustrative purposes forming a part of a case study intended to demonstrate key principles in risk management within the context of the specific market scenarios discussed. These ideas are not to be interpreted as investment recommendations or financial advice. They do not endorse or promote any specific trading strategies, financial products, or services. The information provided is based on data believed to be reliable; however, its accuracy or completeness cannot be guaranteed. Trading in financial markets involves risks, including the potential loss of principal. Each individual should conduct their own research and consult with professional financial advisors before making any investment decisions. The author or publisher of this content bears no responsibility for any actions taken based on the information provided or for any resultant financial or other losses.

USD/CHF | Bearish Continuation SetupBias: Bearish
HTF Overview (4H):
Higher timeframe signals bearish continuation potential. Price is poised for a drop once lower timeframe structure confirms.
MTF Overview (30M):
Mid-term setup shows readiness for a downward move. Waiting for momentum to push price toward OB for lower timeframe execution.
LTF Confirmation (5M):
Price entered last week on a 5M sweep of minor lows. Currently holding, awaiting further bearish continuation to extend toward 5M, 30M, and 4H lows.
Execution Plan:
Stops remain above last 5M structure. Targets: 5M lows → 30M lows → 4H lows depending on momentum and market delivery.
Trade Management:
Hold partial positions; trail stops above recent structure. Extend swing if downward momentum persists.
Mindset Note:
Let structure confirm — patience secures better risk/reward. Avoid forcing continuation.
Progress Hook:
Holding through initial momentum reinforces discipline in tracking multi-timeframe alignment and execution patience.
Tags:
#SMC #SmartMoneyConcepts #Liquidity #Inducement #OrderBlock #USDCHF #Forex #InducementKing

EUR/JPY | Bullish Continuation SetupBias: Bullish
HTF Overview (4H):
Higher timeframe remains bullish, price poised to continue upward once mid-term confirmation aligns.
MTF Overview (30M):
Waiting for midterm SSL to be reached and price to fall into the OB underneath, setting up clean lower timeframe execution.
LTF Confirmation (5M):
Entry will occur once lower timeframe CHoCH and pullback confirm the midterm OB as valid. Execution targets 5M highs → 30M highs → 4H highs.
Execution Plan:
Stops placed below nearest 5M structure. Entry awaits confirmation; no positions taken yet.
Trade Management:
Scale entries and trail stops as momentum develops after confirmation. Maintain discipline to avoid premature entry.
Mindset Note:
Wait for the structure to confirm — chasing setups leads to mistakes.
Progress Hook:
Patience with LTF confirmation ensures alignment with HTF and MTF structure, improving long-term precision.
Tags:
#SMC #SmartMoneyConcepts #Liquidity #Inducement #OrderBlock #EURJPY #Forex #InducementKing

GBP/JPY | Bullish Continuation SetupBias: Bullish
HTF Overview (4H):
Price remains inside the 50% equilibrium on the higher timeframe, showing consolidation within bullish control. Buyers are maintaining structure while awaiting continuation.
MTF Overview (30M):
Mid-term perspective aligns with higher timeframe bullish bias. Price has settled within equilibrium, preparing for the next leg higher.
LTF Confirmation (5M):
Lower timeframe entry already executed; holding positions as price develops within higher timeframe balance. Awaiting price to extend toward 5M, 30M, and 4H highs.
Execution Plan:
Positions already open — stops remain below last 5M structural low. Targets: 5M highs → 30M highs → 4H highs as momentum allows.
Trade Management:
Hold partially scaled positions; trail stops below recent structure. Extend if price breaks higher timeframe resistance.
Mindset Note:
Patience is profit — let equilibrium resolve before forcing additional entries.
Progress Hook:
Holding through equilibrium tests reinforces confidence and precision in position management.
Tags:
#SMC #SmartMoneyConcepts #Liquidity #Inducement #OrderBlock #GBPJPY #Forex #InducementKing

EUR/GBP | Bullish Continuation SetupBias: Bullish
HTF Overview (4H):
Price broke significant highs, showing strong bullish intent. The 4H structure highlights major highs (colored blue) and confirms buyers are in control. Continuation is expected as long as smart money activity supports upward momentum.
MTF Overview (30M):
Mid-term setup shows price dropping into the 30M order block for mitigation. After mitigation, buyers regain control, preparing for the next leg higher. This creates a clean inducement sweep and sets the stage for lower timeframe confirmation.
LTF Confirmation (5M):
Lower timeframe CHoCH expected — break of micro lower highs signals continuation. Price will interact with 5M internal OBs to confirm entry opportunities and capture momentum. Execution occurs once this structure confirms.
Execution Plan:
Stops placed below recent 5M or 30M lows depending on structure. Targets: 5M highs → 30M highs → 4H highs, aligned with momentum and delivery. Entry only after lower timeframe confirmation ensures high-probability execution.
Trade Management:
Partial exit at first 5M high, second scale at 30M high. Trail stops below last confirmed structural low. Full swing extension considered if momentum continues toward 4H highs.
Mindset Note:
Patience before action — let structure reveal intent and smart money dictate timing. Discipline beats impulsive entries.
Progress Hook:
Each CHoCH and mitigation strengthens mapping skill — patience and precision compound over every setup.
Tags:
#SMC #SmartMoneyConcepts #Liquidity #Inducement #OrderBlock #EURGBP #Forex #InducementKing
