BTC/USD WEEKENDERBTC remains in a controlled downtrend, trading within a bearish range between 116.432 and 98.952, holding near the key 100.996 level. Thursday’s daily low was liquidated and sharply reclaimed — confirming absorption on both sides of the market. Price structure has now printed a fourth consecutive inside day, showing compression while red daily highs remain exposed. Yesterday’s New York session stretched higher into the close, keeping short-term bias constructive within the broader range.
The current plan into the weekend is to monitor for a measured retracement toward the 105.000 area — a zone aligning with short-term equilibrium inside the larger bearish range. This level provides a clean reference for liquidity behavior and potential continuation signals into next week.
The IMF warned this week of rising global risk complacency, with high debt and inflated assets raising the chance of a sharper correction. Meanwhile, crypto shows quiet structural strength beneath the surface. Whales absorbed around 30,000 BTC and 400,000 ETH this week near the 100.996 volatility low, aligning with steady ETF inflows and falling exchange balances.
Smart money moves first — absorption always precedes expansion.
Discipline defines conviction, not direction.
— Institutional Logic. Modern Technology. Real Freedom.
Orderflow

The Double Bottom Trap That Traders Might Miss1. The Comfort Zone of Classic Patterns
Few formations attract traders’ attention like a double bottom. It’s one of those timeless chart patterns that promise hope after a long decline—a visual story of selling exhaustion followed by a bullish reversal.
But markets rarely reward what’s obvious. In futures trading, especially when examining instruments like Bitcoin Futures (BTC) and Micro Bitcoin Futures (MBT), patterns are only half the story. What truly moves price isn’t just the shape on the chart—it’s the order flow behind it.
That’s where understanding FO (Filled Orders) and UFO (UnFilled Orders) becomes essential. Both represent past and potential liquidity imbalances, and reading their relationship can transform how traders interpret “classic” setups.
2. The Bitcoin Setup: A Tale of Two Bottoms
The current BTC daily chart paints what seems like a textbook double bottom. Two price troughs form near the same horizontal area around $104,000, setting up the typical “W” shape many traders see as a bullish reversal pattern.
However, when we dig deeper into the order flow structure, the illusion begins to fade.
A FO Support level exists near $103,860, meaning that this area previously attracted enough buyers to halt a decline—but those orders have already been filled and we know this given the fact that price turned at that price level before.
The next UFO Support zone sits much lower, around $95,640. That’s where unfilled buy orders are expected to remain waiting, untouched.
This distinction matters. While FO zones mark previous turning points, UFO zones highlight potential turning points that still contain resting liquidity. In simple terms, FO areas represent “used energy,” while UFO areas represent “stored energy.”
3. FO vs. UFO – The Order Flow Reality Check
Let’s define these two concepts with precision:
FO (Filled Orders): Price zones where significant buying or selling already occurred. These levels once reversed price, but because those orders were executed, fewer remain to defend the level again.
UFO (UnFilled Orders): Price zones containing pending buy or sell orders not yet triggered. They represent areas of fresh imbalance and therefore carry a higher probability of influencing future price moves.
In our Bitcoin case, the FO Support around $103,860 has done its job already—it stopped price before. But now, the unfilled buying interest lies lower, implying that the market may need to travel down to reach fresh demand at $95,640.
On the other side, UFO Resistance hovers near $112,410, enveloping the top of the double bottom structure. Should the price rebound toward that level, sellers waiting there could re-enter the scene, potentially capping any bullish recovery.
The conclusion? This pattern isn’t as bullish as it looks.
4. When Bullish Shapes Hide Bearish Probabilities
Most traders spot the double bottom and immediately think “trend reversal.” Yet, the distance between FO and UFO levels tells a more subtle story.
Since FO Support levels carry reduced strength after being tested, they’re more likely to break than hold. In this context, the probability favors a downside continuation rather than an immediate bounce.
If price breaches $103,860, the next probable destination becomes the UFO Support at $95,640. Only then, after reaching that pocket of unfilled demand, might a significant rebound have higher odds.
It’s a reminder that technical patterns, while valuable, must always be filtered through liquidity context. A pattern without order flow validation is like reading the market’s outline without its story.
5. Quantitative Insight: A Probabilistic Lens
Think of this in probabilistic terms:
When FO zones sit above UFO zones, the market often continues toward the unfilled liquidity.
When UFO zones lie closer to current price, reversals occur faster because demand (or supply) is still waiting to be executed.
In our example, BTC shows a larger gap between FO and UFO support levels, signaling lower immediate reversal odds. The chart may appear bullish, but the underlying order flow distribution points to weakness first, strength later.
This is not a prediction—it’s an observation of potential. It allows traders to structure their expectations based on where fresh participation is more likely to emerge.
6. Risk Management: Navigating the Trap
For traders considering setups around this structure, risk management is crucial.
Entry awareness: Avoid entering long positions purely because a double bottom “looks bullish.” Consider waiting for evidence of unfilled demand being triggered (confirmation at or near UFO Support).
Stop-loss placement: Stops below FO Support can easily be hunted in liquidity sweeps; better to align risk control with genuine unfilled demand areas.
Reward-to-risk thinking: A test of the UFO Support near $95,640 could later offer a more favorable upside-to-downside ratio than buying prematurely at $104,000.
Remember, pattern-based entries without liquidity confirmation often carry poor asymmetry—small upside with large downside risk.
7. Futures Structure and Margin Awareness
Both BTC and MBT represent Bitcoin exposure via futures contracts, but their sizing differs dramatically.
BTC equals 5 Bitcoin per contract, making it suitable for larger, institutional players. (1 Tick = 5 = $25. Required Margin = $132,500)
MBT, the Micro Bitcoin Futures, equals 0.1 Bitcoin per contract, offering flexibility for smaller accounts and finer position scaling. (1 Tick = 5 = $0.50. Required Margin = $2,600)
Understanding margin requirements is essential—these products are leveraged instruments, and small price changes can result in large percentage gains or losses.
8. Key Takeaway: The Hidden Lesson
This entire setup illustrates a powerful educational point:
Chart patterns may draw the eye, but order flow tells the truth.
The double bottom may invite buyers, but the imbalance between FO and UFO zones exposes an underlying weakness. Traders who rely solely on visual patterns may walk straight into a trap. Those who align patterns with liquidity insights, however, read the market at a deeper level.
In the current context, BTC and MBT might need to visit lower support levels before finding true stability. Watching how price behaves around these unfilled order zones will reveal whether this double bottom turns into a lasting floor—or just another false start.
When charting futures, the data provided could be delayed. Traders working with the ticker symbols discussed in this idea may prefer to use CME Group real-time data plan on TradingView: www.tradingview.com - This consideration is particularly important for shorter-term traders, whereas it may be less critical for those focused on longer-term trading strategies.
General Disclaimer:
The trade ideas presented herein are solely for illustrative purposes forming a part of a case study intended to demonstrate key principles in risk management within the context of the specific market scenarios discussed. These ideas are not to be interpreted as investment recommendations or financial advice. They do not endorse or promote any specific trading strategies, financial products, or services. The information provided is based on data believed to be reliable; however, its accuracy or completeness cannot be guaranteed. Trading in financial markets involves risks, including the potential loss of principal. Each individual should conduct their own research and consult with professional financial advisors before making any investment decisions. The author or publisher of this content bears no responsibility for any actions taken based on the information provided or for any resultant financial or other losses.

USD/CHF | Bearish Continuation SetupBias: Bearish
HTF Overview (4H):
Higher timeframe signals bearish continuation potential. Price is poised for a drop once lower timeframe structure confirms.
MTF Overview (30M):
Mid-term setup shows readiness for a downward move. Waiting for momentum to push price toward OB for lower timeframe execution.
LTF Confirmation (5M):
Price entered last week on a 5M sweep of minor lows. Currently holding, awaiting further bearish continuation to extend toward 5M, 30M, and 4H lows.
Execution Plan:
Stops remain above last 5M structure. Targets: 5M lows → 30M lows → 4H lows depending on momentum and market delivery.
Trade Management:
Hold partial positions; trail stops above recent structure. Extend swing if downward momentum persists.
Mindset Note:
Let structure confirm — patience secures better risk/reward. Avoid forcing continuation.
Progress Hook:
Holding through initial momentum reinforces discipline in tracking multi-timeframe alignment and execution patience.
Tags:
#SMC #SmartMoneyConcepts #Liquidity #Inducement #OrderBlock #USDCHF #Forex #InducementKing

EUR/JPY | Bullish Continuation SetupBias: Bullish
HTF Overview (4H):
Higher timeframe remains bullish, price poised to continue upward once mid-term confirmation aligns.
MTF Overview (30M):
Waiting for midterm SSL to be reached and price to fall into the OB underneath, setting up clean lower timeframe execution.
LTF Confirmation (5M):
Entry will occur once lower timeframe CHoCH and pullback confirm the midterm OB as valid. Execution targets 5M highs → 30M highs → 4H highs.
Execution Plan:
Stops placed below nearest 5M structure. Entry awaits confirmation; no positions taken yet.
Trade Management:
Scale entries and trail stops as momentum develops after confirmation. Maintain discipline to avoid premature entry.
Mindset Note:
Wait for the structure to confirm — chasing setups leads to mistakes.
Progress Hook:
Patience with LTF confirmation ensures alignment with HTF and MTF structure, improving long-term precision.
Tags:
#SMC #SmartMoneyConcepts #Liquidity #Inducement #OrderBlock #EURJPY #Forex #InducementKing

GBP/JPY | Bullish Continuation SetupBias: Bullish
HTF Overview (4H):
Price remains inside the 50% equilibrium on the higher timeframe, showing consolidation within bullish control. Buyers are maintaining structure while awaiting continuation.
MTF Overview (30M):
Mid-term perspective aligns with higher timeframe bullish bias. Price has settled within equilibrium, preparing for the next leg higher.
LTF Confirmation (5M):
Lower timeframe entry already executed; holding positions as price develops within higher timeframe balance. Awaiting price to extend toward 5M, 30M, and 4H highs.
Execution Plan:
Positions already open — stops remain below last 5M structural low. Targets: 5M highs → 30M highs → 4H highs as momentum allows.
Trade Management:
Hold partially scaled positions; trail stops below recent structure. Extend if price breaks higher timeframe resistance.
Mindset Note:
Patience is profit — let equilibrium resolve before forcing additional entries.
Progress Hook:
Holding through equilibrium tests reinforces confidence and precision in position management.
Tags:
#SMC #SmartMoneyConcepts #Liquidity #Inducement #OrderBlock #GBPJPY #Forex #InducementKing

EUR/GBP | Bullish Continuation SetupBias: Bullish
HTF Overview (4H):
Price broke significant highs, showing strong bullish intent. The 4H structure highlights major highs (colored blue) and confirms buyers are in control. Continuation is expected as long as smart money activity supports upward momentum.
MTF Overview (30M):
Mid-term setup shows price dropping into the 30M order block for mitigation. After mitigation, buyers regain control, preparing for the next leg higher. This creates a clean inducement sweep and sets the stage for lower timeframe confirmation.
LTF Confirmation (5M):
Lower timeframe CHoCH expected — break of micro lower highs signals continuation. Price will interact with 5M internal OBs to confirm entry opportunities and capture momentum. Execution occurs once this structure confirms.
Execution Plan:
Stops placed below recent 5M or 30M lows depending on structure. Targets: 5M highs → 30M highs → 4H highs, aligned with momentum and delivery. Entry only after lower timeframe confirmation ensures high-probability execution.
Trade Management:
Partial exit at first 5M high, second scale at 30M high. Trail stops below last confirmed structural low. Full swing extension considered if momentum continues toward 4H highs.
Mindset Note:
Patience before action — let structure reveal intent and smart money dictate timing. Discipline beats impulsive entries.
Progress Hook:
Each CHoCH and mitigation strengthens mapping skill — patience and precision compound over every setup.
Tags:
#SMC #SmartMoneyConcepts #Liquidity #Inducement #OrderBlock #EURGBP #Forex #InducementKing

NZD/USD | Bearish Continuation SetupBias: Bearish
HTF Overview (4H):
Price shows clear bearish intent, dropping with momentum and volume confirming seller control. The 4H structure signals continuation toward lower levels, aligning with smart money positioning.
MTF Overview (30M):
Mid-term setup reflects buy-side liquidity being taken. Price rose above and mitigated higher order blocks before rolling back into discounted zones. This inducement sweep creates the conditions for sellers to regain control.
LTF Confirmation (5M):
Lower timeframe CHoCH occurred — prior higher lows were broken, signaling short-term weakness. Price interaction with minor lower timeframe OBs (green zones) confirms areas of resistance and provides clean entry for continuation downward.
Execution Plan:
Stops placed above the nearest 5M structure. Targets: 5M lows → 30M lows → potential 4H lows, depending on momentum and market delivery. Execution occurs once lower timeframe structure confirms continuation.
Trade Management:
Partial exit at first 5M low, second scale at 30M low. Trail stops above last 5M structural high. Full swing extension considered if momentum sustains toward 4H levels.
Mindset Note:
Let structure dictate action — patience over impulse. Smart money sets the stage; I follow only when confirmation appears.
Progress Hook:
Tracking HTF → MTF → LTF allows precision in bearish setups — every sweep and mitigation reinforces discipline and timing.
Tags:
#SMC #SmartMoneyConcepts #Liquidity #Inducement #OrderBlock #NZDUSD #Forex #InducementKing

USD/CAD | Bullish Continuation SetupBias: Bullish
HTF Overview (4H):
Price remains bullish on the higher timeframe, showing strong momentum and clear volume support. Buyers are controlling the structure, keeping the 4H trend intact.
MTF Overview (30M):
Mid-term setup shows inducement and sell-side liquidity being cleared. Price fell into the mid-term order block, confirming accumulation zones. Structure has been refined, mapping liquidity and identifying the areas where price is likely to react.
LTF Confirmation (5M):
Lower timeframe CHoCH occurred — break of lower highs confirming mid-term area control. Next, minor sell-side liquidity will be swept and nearest 5M order blocks mitigated to provide clean entry for continuation.
Execution Plan:
Stops placed below 5M structure. Targets: 5M highs → 30M highs → 4H highs depending on momentum and market delivery. If price fails the near order block, we’ll replot PD grid on higher timeframe to find the next valid entry zone before executing.
Trade Management:
Partial exit at first 5M high, second scale at 30M high. Trail stops below last 5M structural low. Full swing considered if momentum persists toward 4H highs.
Mindset Note:
Patience over speed — wait for structure to confirm. Losses are part of the process; smart money shows the path, we follow with discipline.
Progress Hook:
Each setup reinforces mapping and patience — tracking HTF → MTF → LTF ensures higher-probability trades and precision execution.
Tags:
#SMC #SmartMoneyConcepts #Liquidity #Inducement #OrderBlock #USDCAD #Forex #InducementKing

AUD/USD| Bullish Continuation SetupBias: Bullish
HTF Overview (4H):
Price remains bullish on the higher timeframe, respecting the overarching structure. Momentum is aligned with smart money intent, and buyers are maintaining control within the 4H range.
MTF Overview (30M):
On the mid-term chart, inducement play has been executed, with sell-side liquidity cleared. Price initially fell into lighter orange order blocks, then swept deeper into the darker discounted level, where it respected the zone. This indicates potential for continuation of bullish activity.
LTF Confirmation (5M):
Lower timeframe break of structure occurred, taking out prior minor lower highs. Price interacted with minor sell-side liquidity and tested recent order blocks, confirming interest. Entry executed once lower timeframe confirmation aligned with the deeper PD zone.
Execution Plan:
Stops below the minor 5M structure. Targets: 5M highs → 30M highs → aligning with 4H highs, depending on market delivery and momentum. Entry only taken once structure confirms and price shows follow-through.
Trade Management:
Partial exit at first 5M high, second scale at 30M high. Trail stops below last 5M structural low. If momentum persists, hold for potential 4H swing continuation. Reassess if price hits stop-loss and plot PD grid for next valid entry.
Mindset Note:
Accept losses gracefully — structure guides the plan. Smart money dictates direction; patience ensures precision.
Progress Hook:
Each mitigation and sweep reinforces discipline — staying calm under pressure allows me to spot higher-probability setups.
Tags:
#SMC #SmartMoneyConcepts #Liquidity #Inducement #OrderBlock #AUDUSD #Forex #InducementKing

USD/JPY| Bullish Continuation SetupBias: Bullish
HTF Overview (4H):
Strong bullish momentum is climbing steadily, leaving clear volume and momentum signals at the upside. Price currently sits at highs, showing sustained buyer control and high timeframe bullish intent.
MTF Overview (30M):
We’ve mapped and refined structure, identifying inducement and waiting for sell-side liquidity to be taken. Price is expected to drop into the 30M order block below (orange zone) before presenting a proper setup. Smart money activity is guiding this movement — patience is key.
LTF Confirmation (5M):
Waiting for a lower timeframe CHoCH to form: break of lower highs followed by micro-high creation. This will allow a clean entry off the fresh OB and capture the inducement sweep.
Execution Plan:
Stops placed below the 5M structure. Targets scaled from 5M highs → 30M highs → 4H highs, depending on momentum and market delivery. Entry executed only once lower timeframe structure confirms.
Trade Management:
Partial exit at 5M high, second scale at 30M high, trail stop below last 5M low. Full swing extension considered if momentum sustains toward 4H highs.
Mindset Note:
Patience before execution — smart money sets the stage, I follow only when structure confirms.
Progress Hook:
Mapping HTF to LTF with patience ensures precision entries — each setup reinforces disciplined observation.
Tags:
#SMC #SmartMoneyConcepts #Liquidity #Inducement #OrderBlock #USDJPY #Forex #InducementKing

GBP/USD| Bullish Continuation SetupBias: Bullish
4H Overview (Higher Timeframe):
Structure has broken significant highs, showing clear bullish intent. After taking out inducement and sweeping sell-side liquidity, price fell into our 4H order block and reacted strongly — printing a clean bullish wick and confirming high timeframe interest.
30M (Mid-Term Context):
Price has efficiently cleared sell-side liquidity and tapped into the refined mid-term zone. We’ve seen a healthy drop into the orange zone, which aligns with our discounted range. From here, I’m watching for price to hold this territory and present a lower timeframe break of structure — ideally a 5M LH break and pullback to confirm the bullish continuation leg toward higher targets.
Execution Plan (5M Entry Framework):
Stops remain below structure. I’ll be looking to execute once a valid 5M CHoCH + pullback forms within this zone, targeting 5M, 30M, and 4H highs depending on delivery and momentum. If price re-enters the zone once the market opens, I’ll be closely monitoring for that shift confirmation.
Mindset Note:
Patience pays — we let smart money reveal its hand before reacting. The setup is already built; we just wait for structure and timing to align.

EUR/USD- Bullish- Maintaining 4H Control🧩 Pair & Bias
EUR/USD – Bullish
Momentum continues to favor buyers as price remains within a strong 4H bullish range.
⸻
⏳ HTF Overview (4H Context)
Higher timeframe structure maintains strong upside momentum showing clear bullish intent for the week.
Price continues to respect the existing 4H range, holding the same structural formation that’s guided price since previous sessions.
Smart money still appears active within the bullish leg — control remains with buyers.
⸻
🧠 Mid-Term (30M Perspective / Inducement Play)
30-minute structure shows sell-side liquidity being taken.
The weak inducement pulled price into a cluster of mid-term OBs below, all of which have been mitigated.
From there, price shifted upward, breaking major LTF lower highs and revealing fresh bullish interest.
Last week’s early long entries were closed during minor retracements; current focus is waiting for new accumulation and confirmation inside this same 4H territory.
⸻
🎯 LTF Execution (5M Details)
• Looking for price to create a new 5M order block within current pullback structure.
• Will re-enter once that fresh 5M OB forms and confirms via CHoCH.
• Stops: always below the most recent 5M structural low.
• Targets: 5M highs → 30M highs → potential 4H continuation if momentum and volume sustain.
⸻
💰 Trade Management
Will allow price to develop naturally. Execution only after confirmation.
Holding time depends on momentum + volume readings and overall delivery behavior.
⸻
💭 Mindset Note
“Patience defines precision. Smart money already knows its path — my job is to wait for the new CHoCH to confirm I’m aligned with it.”
⸻
📈 Progress Hook
“Starting the week refining my 4H-30M-5M mapping and trusting the process. Letting structure, not emotion, guide execution.”
⸻
🔖 Tags
#SmartMoneyConcepts #SMC #InducementKing #MarketStructure #OrderBlocks #LiquiditySweep #Forex #PriceAction #EURUSD

BTCUSD — TP1 Hit | Structure Validation Bitcoin tagged its first target at 111,066, wrapping up another disciplined weekend for structured traders.The move is still unfolding, completing the measured leg mapped last week.
Price action remains just behind Thursday’s range as the market quietly fills the week’s single-prints near 111,629.
Technical View
BTC continues to trade inside its mid-range structure.
The current rotation follows a clean, measured rhythm — confirming that prior resistance has been absorbed.
Next focal zone: 111,900, where untested liquidity remains.
A sustained break above that region would signal continuation; a rejection keeps us boxed in for another session.
Macro Overview
Dollar Index (DXY): Holding near 106, giving mild support to risk assets.
Rates: U.S. 10-year yields steady around 4.25 %, showing markets in “wait mode.”
Seasonality: Early November typically brings moderate inflows after October volatility. Expect slower rotations until U.S. sessions return to full volume.
Volume / Flow
Weekend turnover reached roughly $23 billion across BTC pairs — moderate and balanced.
Order flow stayed clean, with no signs of forced liquidation or excess speculation.
Plan
Keep it simple:
111.9 k = magnet zone.
We’re still in range logic — control, not chase.
Note
The system did what it’s designed to do: read rhythm, not emotion.
Institutional Logic. Modern Technology. Real Freedom.

BTCUSD — New York Cleans London Highs
🧭 Context
New York came in aggressive and swept the London highs — a clean stop-hunt above the morning range.
After the sweep, price slipped back inside structure, confirming it was liquidity collection, not breakout continuation.
Same playbook we’ve seen all week: clean liquidity, reset the board, and wait for direction.
📐 Technical Map
Structure: Still inside a bearish daily range, rotating between 116,077.51 – 103,516.75.
Geometry: We remain in an internal bullish bias as long as price holds above 114,128.30.
If we close below 114,128.30, that’s the first sign of weakness in price action — an early signal the range may start to roll over.
Confirmation: A decisive close below 112,885.20 confirms breakdown; holding above keeps the range intact.
Bias: Neutral-to-bearish unless we see strong volume confirmation to either side.
🌐 Fundamental Pulse
Dollar strength persists after Monday’s yield rebound — the 10-year Treasury hovers near 4.58%.
CPI miss remains in play and crypto liquidity stays tight.
Risk tone across markets leans defensive — institutions hedging more, speculating less.
📊 Volume & Order Flow Map
The sweep showed a clear volume burst but no continuation.
Footprint data suggests liquidity taken from the highs and absorbed back into range — a controlled event, not momentum-driven.
🎯 Plan
No need to rush trades after a sweep.
Let price confirm with a clean close — below 114,128.30 signals early weakness; below 112,885.20 opens range extension lower.
Above 114,128.30, we stay inside the current rotation.
Patience here protects capital.
🧠 CORE5 Note — For Traders
Sweeps are designed to pull emotion.
Your edge is to let them happen, then read what survives after.
Stay patient — control builds confidence.
— CORE5DAN
Institutional Logic. Modern Technology. Real Freedom.

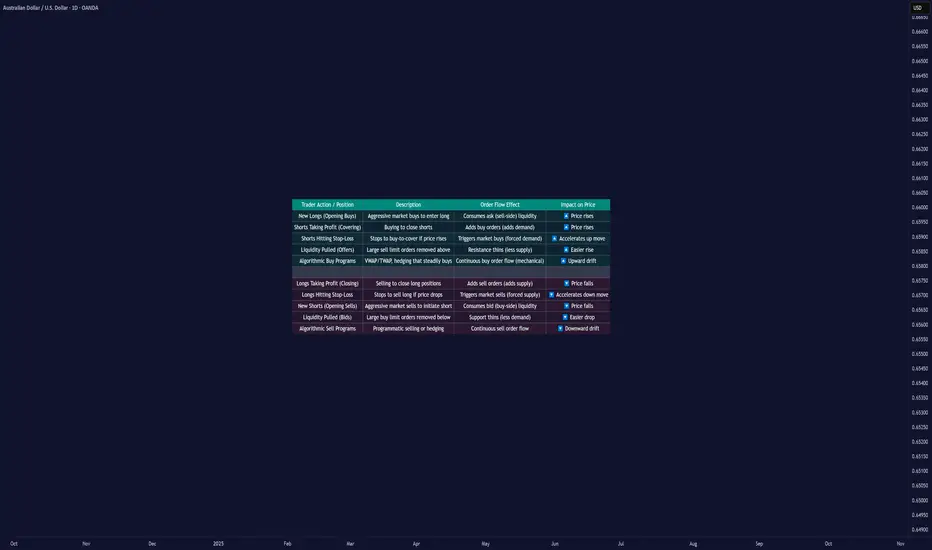
Why Prices Move Up or Down: Order Flow and Liquidity█ Why Prices Move Up or Down: Understanding Order Flow and Liquidity
Most traders are told that prices rise because “there are more buyers than sellers,” and that prices fall because “there are more sellers than buyers.” But that’s not how markets actually work. In every transaction, there’s always one buyer and one seller; what really matters is which side is more aggressive and how liquidity responds to that aggression.
Price movement is the result of order flow interacting with liquidity. When buyers use market orders and aggressively lift the available sell orders (the ask), the price moves up. When sellers hit the bid with market orders, the price moves down.
In short, price moves in the direction of the side that consumes liquidity.
█ The Engine Behind Price Movement
When buyers and sellers agree on price, the market ranges, there’s a balance. When one side becomes more aggressive, an imbalance occurs, and the price must adjust until new liquidity appears.
Imagine the market like a ladder made of buy and sell orders. Each rung shows where traders are waiting, buyers below the current price, and sellers above it. These waiting orders are what we call liquidity.
When a trader sends a market buy order, they’re not waiting; they want to buy immediately. That order takes the best available sell price (the ask). If more traders keep doing this — buying aggressively — those sell orders get used up faster than new ones appear. As a result, the next available sell price is higher, and the price moves up until new sellers fill the gap.
The same logic applies in reverse: when aggressive market sell orders hit the bids, they consume the buy-side liquidity. Once those bids are gone, the next available buyer is lower, and the price moves down.
This continuous back-and-forth, liquidity being consumed, replaced, or withdrawn, is the real engine of every price movement.
█ Why Prices Move Up
1. Aggressive Buying (New Longs)
When new participants enter with market buys, they lift the offers, consuming sell-side liquidity. If this continues, the price climbs until enough new sellers appear to absorb demand. This is the cleanest form of demand-driven uptrend, with new buyers initiating positions.
2. Short Covering
The price moves higher as short sellers buy back positions. This can happen when stops are triggered after a price rise or when shorts take profits after a decline. In both cases, their buying adds upward pressure. When many cover at once, the move can accelerate into a short squeeze — higher prices trigger stops, which trigger even more buy orders, creating a self-reinforcing rally.
Profit Taking Phase
Short Squeeze Phase
3. Stop-Loss Triggers
Clusters of stop-loss orders above previous highs act as “fuel.” When price breaks those levels, automatic buy orders fire off. These aren’t new investors; they’re forced buyers closing shorts. The result is a fast, often exaggerated upward burst.
4. Thin Liquidity and Pulled Offers
Sometimes, price surges not because of huge buying, but because there’s nobody selling. If the sell side of the order book is thin, or if large resting orders get canceled, even small buys can sweep multiple levels. This creates those “air pockets” where price jumps several ticks in seconds.
5. Algorithmic and Institutional Flows
Institutions use automated execution algorithms like VWAP or TWAP to buy steadily throughout the day. These constant flows absorb liquidity over time, creating a slow upward bias. Similarly, option dealers who are short gamma must buy as prices rise to stay hedged, adding even more mechanical buying pressure.
█ Why Prices Move Down
1. Aggressive Selling (New Shorts)
When traders use market sells, they consume buy-side liquidity. If this persists, the price naturally ticks lower as bids disappear, and the next buyer will be willing only at a cheaper level.
2. Long Profit-Taking
At some point, long traders sell to realize profits. These sales add supply, which can cap or reverse an uptrend. It’s not bearish conviction; it’s simply existing longs exiting their positions.
3. Long Stop-Loss Cascades
If prices fall to where many long traders placed stops, those automatic sell orders trigger, creating a chain reaction of forced selling. This is the mirror image of a short squeeze — a long liquidation cascade.
4. Thin Bid Liquidity or Pulled Bids
When buy orders disappear, the market has no floor. Even modest selling pressure can make the price fall through several levels until new bids emerge. This is how “flash drops” occur during low-liquidity periods.
5. Algorithmic and Mechanical Selling
Negative news or risk events can activate automated sell programs, from funds rebalancing to dealers hedging short options exposure. These trades can intensify selling, even without new bearish sentiment.
█ New Positions vs. Exits — The Hidden Difference
Not every up-move means new buyers are coming in, and not every down-move means new shorts.
Some moves happen because existing positions are being closed, not opened. and that distinction matters.
New Positions (Initiative Flow): Create real trends, since they bring new demand or supply.
Position Exits (Reactive Flow): Often short-lived, they relieve pressure rather than add it.
One way to tell the difference is through open interest (in futures or options):
Price up + Open Interest up → new longs entering (sustainable).
Price up + Open Interest down → short covering (temporary).
Price down + Open Interest down → long liquidation (often near exhaustion).
Price down + Open Interest up → new shorts entering (trend formation).
█ The Real Takeaway
Price doesn’t rise because “buyers beat sellers.” It rises because buyers were more aggressive, consuming available sell orders faster than they were replaced. It falls when sellers become more aggressive, taking out the bids.
Both entries and exits can push the price the same way:
New longs and shorts covering both create buy pressure.
New shorts and longs taking profit both create sell pressure.
To truly understand a move, traders must ask:
Who initiated it, new positions or forced exits?
Was liquidity added or withdrawn?
Did open interest confirm new participation or show a squeeze?
Once you start thinking in these terms, price becomes more than a random chart line; it becomes a story of liquidity and intent unfolding in real time.
█ Multiple Forces in Motion
While each example above highlights a single mechanism in isolation, the market rarely moves for one reason alone. In real trading, several of these forces often act simultaneously, new longs entering, shorts covering, stops triggering, algorithms executing, and liquidity thinning.
When multiple flows align in the same direction, the result is acceleration, price moves rapidly as liquidity vanishes, and reactions compound. When opposing forces meet, price can stall, consolidate, or violently whip as both sides compete for control.
In essence, market movement is the sum of overlapping liquidity events, not isolated causes. Understanding how these factors interact in real time is key to reading true intent behind every move.
█ In summary:
Markets move not because of “more buyers” or “more sellers,” but because one side becomes impatient, consumes liquidity, and forces repricing until balance returns.
Understanding who’s moving the market and why — new positioning, forced exits, or vanished liquidity — is the foundation of reading true market intent.
-----------------
Disclaimer
The content provided in my scripts, indicators, ideas, algorithms, and systems is for educational and informational purposes only. It does not constitute financial advice, investment recommendations, or a solicitation to buy or sell any financial instruments. I will not accept liability for any loss or damage, including without limitation any loss of profit, which may arise directly or indirectly from the use of or reliance on such information.
All investments involve risk, and the past performance of a security, industry, sector, market, financial product, trading strategy, backtest, or individual's trading does not guarantee future results or returns. Investors are fully responsible for any investment decisions they make. Such decisions should be based solely on an evaluation of their financial circumstances, investment objectives, risk tolerance, and liquidity needs.
Price Doesn’t Move Randomly: It Hunts Liquidity1. Introduction
Every trader starts by learning “supply and demand.”
Sounds logical: buyers push price up, sellers push it down.
But that’s not how it really works.
Price doesn’t move because of demand.
It moves toward liquidity — where orders exist.
The market’s goal is simple: find liquidity, fill it, and move on.
2. What Is Liquidity?
Liquidity is the pool of pending orders sitting on the chart — stop losses, limit orders, and resting positions.
Think of them as magnets.
Above highs: stop losses from shorts.
Below lows: stop losses from longs.
Around major levels: limit orders waiting to be filled.
Institutions and large players can’t just “market buy” or “market sell” huge positions — they need liquidity to fill them efficiently.
So, price hunts it.
3. The Game of Stop Hunts
You see it all the time:
A breakout above resistance → instant reversal.
A sweep below support → immediate bounce.
That’s not coincidence — that’s a liquidity grab.
Big players push price to trigger stop losses, collect those orders, and then reverse in the true direction.
Retail traders call it “manipulation.”
Smart traders call it “the business model.”
4. How to Read It
Stop focusing on predicting direction — start identifying where liquidity sits.
Look for:
Equal highs/lows → obvious stop clusters.
Clean levels that everyone sees → perfect trap zones.
FVGs or inefficiencies → likely rebalance points post-hunt.
Instead of asking “where will it go,” ask “who’s trapped?”
5. Takeaway
The market isn’t random. It’s strategic.
Every wick, every fake breakout, every stop hit — it all serves one purpose: to find liquidity.
Stop trying to predict the next candle.
Start understanding why the candle exists.
Price hunts liquidity — not logic.
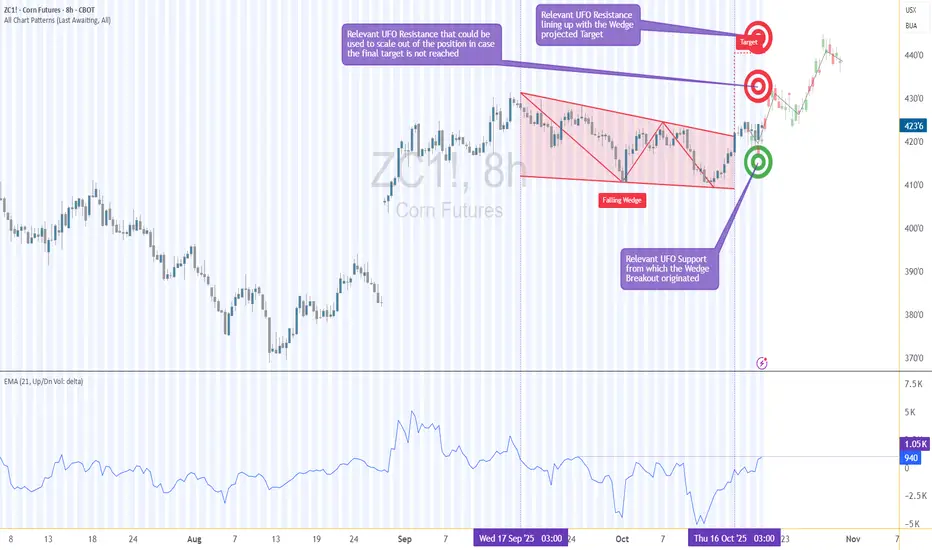
Breakout or Fake-Out? Corn Just Kissed Its Support!1. The Setup
Corn’s doing exactly what disciplined traders hoped for — pulling back to the same UFO support zone that powered the earlier wedge breakout. On the 8-hour chart, price just kissed that 418–411 area… a textbook retest where new buyers could reload the bushels.
2. The Context
We saw this coming. The initial breakout looked flashy, but the volume delta wasn’t convinced — it stayed soft. Now that price has tapped into the unfilled-order pocket, watch to see if the delta turns positive again. That’s the “ignition spark” that often separates real breakouts from fakes.
3. The Game Plan
The playbook hasn’t changed — only the timing has improved.
🎯 Entry idea: around 418 support
🛑 Stop: 411 (below the UFO zone)
📈 Targets: 430 and 442
⚖️ Reward-to-Risk ≈ 3:1
This is patience in action — waiting for the market to come to you instead of chasing it.
4. The Specs
ZC – Corn Futures: 5 000 bushels · Tick = ¼ ¢ ($12.50) · ≈ $1 000 margin
MZC – Micro Corn Futures: 500 bushels · Tick = ½ ¢ ($2.50) · ≈ $100 margin
Same analysis, smaller bite size — perfect for managing exposure while keeping precision.
5. The Takeaway
Volume shows what’s already been eaten; UnFilled Orders at support show what’s still on the table.
Corn just revisited the buffet — now we wait to see if buyers come back for seconds. 🌽🔥
Want More Depth?
If you’d like to go deeper into the building blocks of trading, check out our From Mystery to Mastery trilogy, three cornerstone articles that complement this one:
🔗 From Mystery to Mastery: Trading Essentials
🔗 From Mystery to Mastery: Futures Explained
🔗 From Mystery to Mastery: Options Explained
When charting futures, the data provided could be delayed. Traders working with the ticker symbols discussed in this idea may prefer to use CME Group real-time data plan on TradingView: www.tradingview.com - This consideration is particularly important for shorter-term traders, whereas it may be less critical for those focused on longer-term trading strategies.
General Disclaimer:
The trade ideas presented herein are solely for illustrative purposes forming a part of a case study intended to demonstrate key principles in risk management within the context of the specific market scenarios discussed. These ideas are not to be interpreted as investment recommendations or financial advice. They do not endorse or promote any specific trading strategies, financial products, or services. The information provided is based on data believed to be reliable; however, its accuracy or completeness cannot be guaranteed. Trading in financial markets involves risks, including the potential loss of principal. Each individual should conduct their own research and consult with professional financial advisors before making any investment decisions. The author or publisher of this content bears no responsibility for any actions taken based on the information provided or for any resultant financial or other losses.

Bitcoin UpdateBTC/USD — The Range Squeeze Tightens: Volatility Decides Direction
Bitcoin remains confined within a bearish range between 113 000 and 116 000. Price sits on the sell side of deviation but has yet to return to discount since yesterday’s flush.
The active range squeeze forms between the bullish point of control near 104 000 and the bearish point of control near 111 000, where both sides continue to fight for conviction. Yesterday’s session cleared heavy bullish liquidation, leaving direction to whoever reclaims volume first.
Structure: Fibonacci geometry shows BTC pressing into bearish oversold zones. Momentum remains reactive—better suited for short, tactical trades.
Order Flow: Sellers defended the 114 000 region; volume still favors supply at the upper band.
Execution: Expect consolidation until a new catalyst breaks the compression.
Upcoming events—U.S. jobless claims, Fed remarks, and tech earnings—may reset volatility. Liquidity tone stays cautious; ETF inflows paused, and yields remain firm.
Patience isn’t waiting—it’s refusing to act in confusion.
For now, watch for a 1H structure shift lower or renewed bearish momentum.
Bounces toward 111–113 k remain tactical until a daily close confirms otherwise.
Bitcoin is coiled inside a range squeeze. One side will lose soon. Until then, probability—not prediction—defines discipline.
— CORE5DAN
Institutional Logic. Modern Technology. Real Freedom.

Breakout or Fake-Out — Corn’s Price Action Under the Microscope1. When Breakouts Lie
Few things in trading are more exciting than a clean breakout. But for every breakout that soars, there’s another that fakes out and traps eager traders.
Corn Futures (ZC) on the 8-hour chart just gave us that classic test — a breakout from a falling wedge that has traders asking: Is this the real thing, or another false alarm?
The pattern looks textbook. Price compressed lower within a wedge and broke above its upper trendline. However, the true strength of any breakout lies not in the pattern itself, but in the story told by volume and order flow. That’s what we’ll unpack in this article — using ZC (Corn Futures) and MZC (Micro Corn Futures) as our guide.
2. The Falling Wedge in Focus
Falling wedges often represent market exhaustion, where selling pressure slows and buyers quietly begin to accumulate positions. On the Corn Futures 8-hour chart, price has indeed pushed beyond the wedge’s descending resistance line — the visual signal that usually excites breakout traders.
But structure alone doesn’t make a sustainable move. Beneath the surface, the UFO support and resistance levels — zones of UnFilled Orders — provide the invisible scaffolding that can support or reject price movement.
In this case:
Support Zone: 418–411
Resistance Levels: 430 and 442
These areas represent pending potential new support and resistance areas where buy and sell orders that can act as launchpads or barriers. The key is to see how the market interacts with them while volume builds or fades.
3. The Volume Delta Story
Here’s where things get interesting.
Volume Delta — the difference between buy and sell volume — shows us who’s winning the tug-of-war between buyers and sellers.
During the wedge formation, the maximum delta reached +1.05K, indicating meaningful buying activity despite the downtrend. But as the breakout unfolded, delta turned slightly negative. In plain terms, fewer new buyers are stepping in — and without new buying energy, breakouts often lose traction.
That’s a classic setup for a potential fake-out: price pokes above the wedge, but order flow doesn’t confirm. This mismatch between technical breakout and volume delta is often the canary in the coal mine for fading momentum.
4. The Trade Logic — Let the Market Come to You
Instead of chasing the breakout, the smarter play here could be to wait for the market to revisit demand/support.
Why? Because that’s where new volume tends to enter — where pending buy orders (the UFOs) become filled, strengthening the delta and giving the move fresh fuel.
A potential plan might look like this:
Entry: 418 (within support)
Stop-Loss: 411 (below the zone)
Target 1: 430 (first resistance, partial exit)
Target 2: 442 (final resistance, full exit)
This setup maintains a clear reward-to-risk ratio above 3:1, assuming disciplined execution and volatility-adjusted sizing. It’s not about prediction — it’s about preparation. Waiting for retracement allows participation in a confirmed move, rather than reacting to emotional excitement at the breakout.
5. Contract Specifications & Margin Requirements
Understanding your instrument is as important as reading your chart.
Here’s what traders should know about these CME-listed Corn contracts:
ZC – Corn Futures (Standard Contract)
Contract Size: 5,000 bushels
Tick Size: ¼ cent per bushel (0.0025) → Tick Value = $12.50
Approx. Margin: Around $1,000 USD, varying by broker and volatility
MZC – Micro Corn Futures
Contract Size: 500 bushels (1/10th of ZC)
Tick Size: ½ cent per bushel (0.0050) → Tick Value = $2.50
Approx. Margin: Around $100 USD, varying by broker and subject to market conditions
Micro contracts allow smaller-scale traders to apply the same analysis and structure as the full-size contract, but with controlled risk exposure — a major advantage for capital management.
6. When New Volume is Injected in the Market
Think of Volume Delta as a glance in the rear-view mirror — it tells us what’s already been filled. On the other hand, analyzing support and resistance levels with the idea of where new unfilled orders might come in helps us prepare to enter trades just before momentum potentially reactivates.
When both are combined:
Rising delta confirms a healthier follow-through on breakouts.
Negative delta near resistance warns of a likely fading move.
Key support and resistance zones show where resting orders could inject new volume.
7. Risk Management — Protect Before You Project
Every solid trade plan starts with a stop.
For this setup, a logical stop below 411 ensures protection if the wedge breakout fails completely.
Scaling out at 430 reduces exposure early, locking gains in case the move stalls.
Always size positions relative to account equity and volatility — the most underrated edge in trading is survival.
The best traders don’t just hunt profits — they hunt consistency. Managing risk transforms a potentially stressful market environment into a structured decision process.
8. CME Context & Final Thoughts
Both ZC and MZC are cornerstone agricultural contracts traded on the CME Group’s CBOT exchange, giving traders exposure to one of the world’s most economically significant commodities.
While the setup we’ve explored is a case study, the takeaway extends beyond Corn:
Breakouts need participation. Volume confirms conviction. Key support and resistance levels reveal intention.
In markets where fake-outs are common, aligning technical structure, order flow, and patient trade planning gives traders the clearest edge of all — confidence grounded in data, not emotion.
When charting futures, the data provided could be delayed. Traders working with the ticker symbols discussed in this idea may prefer to use CME Group real-time data plan on TradingView: www.tradingview.com - This consideration is particularly important for shorter-term traders, whereas it may be less critical for those focused on longer-term trading strategies.
General Disclaimer:
The trade ideas presented herein are solely for illustrative purposes forming a part of a case study intended to demonstrate key principles in risk management within the context of the specific market scenarios discussed. These ideas are not to be interpreted as investment recommendations or financial advice. They do not endorse or promote any specific trading strategies, financial products, or services. The information provided is based on data believed to be reliable; however, its accuracy or completeness cannot be guaranteed. Trading in financial markets involves risks, including the potential loss of principal. Each individual should conduct their own research and consult with professional financial advisors before making any investment decisions. The author or publisher of this content bears no responsibility for any actions taken based on the information provided or for any resultant financial or other losses.
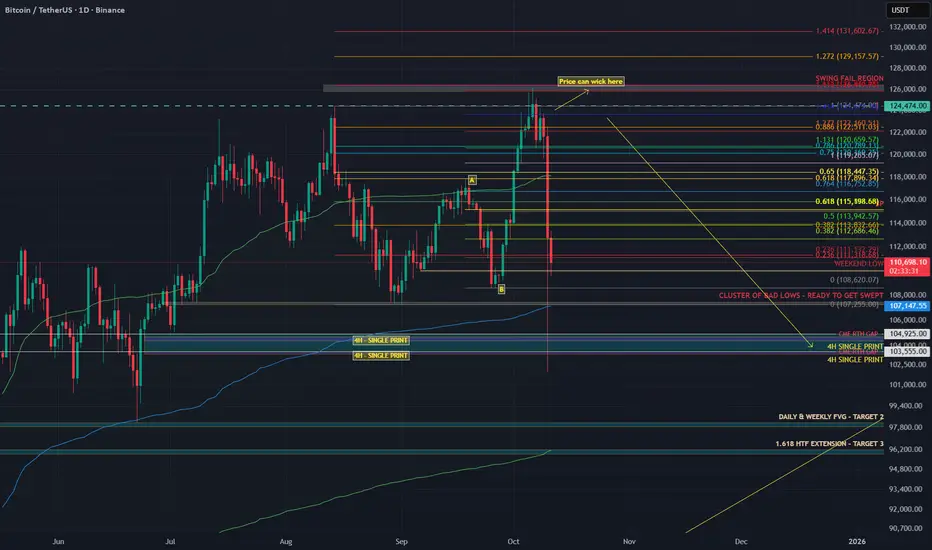
BITCOIN – THE REAL REASON BEHIND THE FALLWhen I started trading someone told me something I’ll never forget: “If you can predict tomorrow’s newspaper headline, you understand the market.”
He didn’t mean I should chase news. He meant I should read structure so well that I know what kind of headline the market is already writing, before the mass even see it.
And now, looking around online, I see the complete opposite. Everywhere you look, there’s another “confluencer” talking about crypto with big words and zero understanding.
People selling dreams, memberships, and indicators, while they don’t even know what open interest or CVD means.
I’m not here to sell anything. I’m here to help people actually learn how to read data and see through the noise. Because what most of these so-called experts call “analysis” is just emotional guessing wrapped in confidence.
What I called and what happened
Last week I posted my “Big Dump” thesis.
I said Bitcoin would swing fail above the highs, then drop into the 104K region. That is exactly what happened.
Price ran the sweep into 126K, trapped the late buyers, and dumped straight into 104K.
People blamed tariffs. The tariff headline was the spark. The fuel was crypto’s own positioning.
Why the structure was ready to snap
Before the crash, the data told the story clearly.
Stablecoin OI went from 257K to 285K contracts (+10.9%). That is new leveraged exposure.
Coin-margined OI dropped during the breakout, then rose again near the highs. Shorts were fading strength.
Spot CVD stayed flat to slightly negative. Real buyers were missing.
The long/short ratio fell from 2.05 to 1.02 even while price kept climbing.
That’s what distribution looks like. Buyers on leverage pushing price up while stronger hands sell into them. No real spot demand, just futures exposure.
You don’t need a macro event to fall. You only need a reason for those leveraged buyers to stop bidding. Think of it like a crowded elevator. Everyone keeps piling in as it moves up, feeling safe because it hasn’t stopped yet. But the moment one person hesitates, the weight shifts. When the next person panics, the whole thing drops.
That’s what happens when a market is driven by leverage instead of conviction. You don’t need bad news, you just need hesitation.
Look back at similar events.
In May 2021, funding rates were insane, perps overloaded, and spot volume thin. Elon Musk tweeted about Bitcoin’s energy use. That tweet didn’t cause the dump. It just made leveraged longs pause. The bids disappeared and the cascade started.
In August 2023, Evergrande headlines hit. Bitcoin was sitting at resistance with flat spot CVD and rising OI. Equities wobbled, crypto longs hesitated, and the structure collapsed within hours.
In March 2020, when COVID panic hit, Bitcoin had already been stretched thin. Funding was high, leverage was heavy, and liquidity was weak. The virus didn’t break the market, leverage did.
Leverage creates confidence until it doesn’t. Price doesn’t fall because people start selling. It falls because nobody steps in to buy. Headlines decide when the drop starts. Structure decides how far it goes.
Why 104K was my first target
I didn’t pick 104K out of thin air. That level was built on confluence.
1) AVWAP from the April 7 auction
That swing low kicked off with massive volume. When a move starts with that kind of participation, the anchored VWAP becomes a key reference for institutional flow. It represents the average cost of that whole auction, and when extended forward, it acts as a dynamic area where liquidity and algorithms interact.
That blue AVWAP line from April has been running right through the 104K region.
It’s not that price revisited that auction, it’s that the anchored VWAP from that event still marks the fair value area for that entire move.When price traded back down into that region, it met that same volume-weighted anchor, creating a major confluence zone that algos and larger players watch closely.
2) The June 22 breakout left an LVN
A new auction started on June 22 and pushed higher, leaving a Low Volume Node behind.
An LVN is a thin zone on the volume profile where the market moved quickly with little trade.
Markets often revisit these thin areas later to find balance or test unfinished business.
3) HTF Fibonacci cluster
Multiple higher timeframe Fibonacci retracements and extensions overlapped near the same 104K area. When several fib levels align with structure, that’s a strong confluence zone watched by both human traders and algorithms.
The 104K region was where the AVWAP line, LVN, and fib cluster all met. That’s not a random target. It’s a structurally defined area where liquidity concentrates and where markets tend to react sharply. And that’s exactly what happened.
The spark versus the structure
The tariff headline didn’t cause the drop. It triggered it.
The structure was already unstable. Leverage was maxed. Spot demand was flat. Funding was positive and rising. When the tariff news hit, traditional markets pulled back and crypto followed instantly. It wasn’t correlation, it was liquidity contagion.
Traders managing multiple books de-risk across assets when volatility spikes. That creates a gap in liquidity. When the bids vanish, the market falls into the first real pool of resting orders — in this case, the 104K zone.
You saw the same mechanics during the March 2020 crash and the 2021 deleverage. External shocks trigger internal liquidation cascades. That’s why saying “this had nothing to do with crypto is completely wrong.
This had everything to do with crypto. It’s like blaming the thunder for breaking a window when the glass was already cracked. Or saying the iceberg sank the Titanic when the captain was already steering through a sea of warnings.
Crypto was structurally weak. Leverage was stretched, spot demand was gone, and funding was positive. When the headline hit, it didn’t cause the collapse. It just gave the market permission to do what it was already set up to do — unwind.
Crypto is built on leverage.
Perpetual futures dominate volume.
Stablecoin collateral drives exposure.
When external risk events change funding conditions or risk appetite, the crypto market reacts instantly because its structure is fragile by design.
Example:
When yields spike, the dollar strengthens and funding costs rise. Leveraged longs become more expensive to hold, so traders unwind positions.
When equities dump, cross-asset desks reduce risk globally, which pulls liquidity out of crypto perps too.
Intermarket correlation always matters. Macro sets the mood. But the speed and violence of crypto moves always come from leverage inside the system.
How you can spot it next time
Compare Spot CVD vs Stablecoin CVD. If stablecoin CVD rises while spot stays flat or negative, the rally is leverage-driven.
Track Open Interest vs Price. Both rising together usually means exposure is building. Confirm with spot flow.
Watch the Long/Short ratio. If it drops while price rises, shorts are entering and the move may be getting absorbed.
Anchor VWAPs to real pivots like swing lows, breakouts, or liquidation spikes. Those levels attract institutional flow.
Study Volume Profiles. LVNs are thin and often retested. HVNs are balance zones that attract price.
Map HTF fib clusters for confluence. Reactions are stronger when multiple timeframes agree.
Note single prints and thin brackets on TPO or volume profiles. These often act as magnets.
When these factors line up, you don’t need to predict headlines.
You’ll already most likely know which headline will break the market.
TLDR
The rally was leverage-driven: Stablecoin OI up 10.9%, Spot CVD flat, Long/Short ratio down from 2.05 to 1.02
The swing fail at 126K was the final liquidity grab
104K was the target due to AVWAP + LVN + HTF fib cluster
The tariff headline was the spark, not the cause
The crash was caused by leverage and missing spot demand
Crypto didn’t fall because of politics. It fell because the market was already begging for an excuse to reset.
The data showed it clearly weeks before the drop.
If this helped you see the market a little clearer or made you think differently about how price really moves, please leave a like and drop a reaction. It keeps me motivated to keep posting real analysis, not the copy-paste bullshit hype that floods your feed every day.
Check the Order Flow Data from 6 October here: ibb.co
A simple Introduction to Footprint charts
Welcome to this educational video on footprint charts .
I decided to do this introduction because I feel it would benefit so many traders who are unfamiliar with this chart type and once understood it can serve as a very powerful additional confluence in your day to day trading .
I hope I have delivered this lesson in a simple and understandable format for you too
understand the following .
The problem with just watching the price
What is order flow
Delta explained
What is open interest
How to tie it all together to produce better entries , exists and oversight into knowing when to take your trades.
I welcome any feedback or questions and I really hope that this serves you well.
*The link to the Tradingview guide is in the designated box on the right hand side I encourage everybody to use this resource .

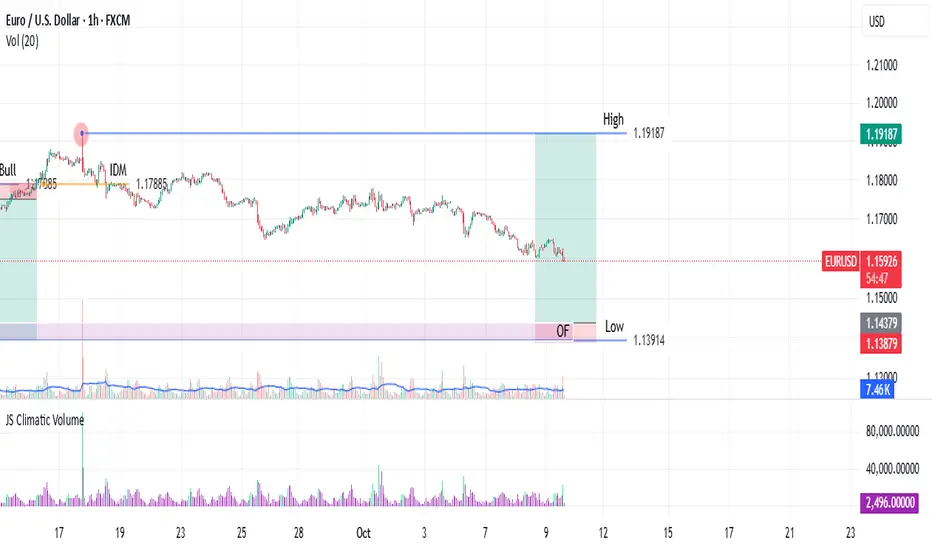
Testing a POI (Point of Interest) & Inducement FrameworkThis script is a visual aid for my personal testing of a systematic trading plan. It is designed to help me manually identify and mark key structural components on the chart. The core concepts I am testing are Trading Ranges, Inducement Levels, and Points of Interest (POI), specifically Order Flows and Order Blocks. (On this chart, an Order Flow)
This is a work in progress and represents my personal learning process. It is not intended as financial advice or a complete trading system.
Key Features I am Testing:
Trading Range Identification: The script helps mark the high and low of a defined trading range, which I identify based on a confirmed break of structure or change of character. In this case what is depicted is a change of character from Bearish to Bullish Sentiment on the EURUSD One-Hour Frame.
Inducement Visualization: It allows for the marking of key inducement levels. In my testing, an inducement is the pullback high (in a bearish move) or low (in a bullish move) immediately preceding the most recent significant low or high. A range is considered valid once its corresponding inducement is traded through.
Order Flow/Block Marking: The tool assists in highlighting potential OFs or OBs. These ranges or candles, located near range extremes, are the Points of Interest I test for potential entries.
My Testing Notes & Disclaimer:
This visual tool is part of my journaling process to build discipline and consistency. I use it to document my hypothesis for each trade setup. The market does not always respect these levels, and a key part of my testing is learning to distinguish between valid and invalid POIs.
My risk management rules are separate and non-negotiable. I always define my stop loss and position size before entering any test trade.
I am sharing this as a documentation of my own testing framework, not as a recommendation.
GBPJPY | Daily Sweep to 15M Supply ReactionDaily liquidity swept. 1H CHOCH confirms bearish shift — if price reacts instantly at 15M supply, that’s not luck, it’s smart money execution.
Watch for the retest to ride GBPJPY into the 179-pip inefficiency zone. 🩶
After a daily liquidity sweep, price printed a clear 1H CHOCH, confirming a bearish shift in market structure.
We refined our POI to the 15-minute supply zone, where displacement originated.
Now, if price taps this POI and drops immediately without forming a lower-timeframe CHOCH, that’s not invalid — it simply signals smart-money execution at origin.
When all higher-timeframe confluences (Daily Sweep ✅, 1H CHOCH ✅, 15M Supply ✅) align, the first tap can be the move.
That impulsive drop = institutional confirmation.
From here, we watch for:
🔹 Retest of 50–61% of the first impulsive leg for refined entry.
🔹 Targeting PDL (201.20) and extended inefficiency zone (200.0–199.8).
🔹 SL above the M15 POI high (~203.10).
“When the higher-timeframe story is complete, the market doesn’t ask for your confirmation — it just moves.”
— BFU-FX MARKETS
Bias: Bearish
Key Levels: 202.75
Target: 179-pip inefficiency fill
