EURJPY Technical Analysis! SELL!
My dear friends,
EURJPY looks like it will make a good move, and here are the details:
The market is trading on 181.28 pivot level.
Bias - Bearish
Technical Indicators: Supper Trend generates a clear short signal while Pivot Point HL is currently determining the overall Bearish trend of the market.
Goal - 180.92
About Used Indicators:
Pivot points are a great way to identify areas of support and resistance, but they work best when combined with other kinds of technical analysis
Disclosure: I am part of Trade Nation's Influencer program and receive a monthly fee for using their TradingView charts in my analysis.
———————————
WISH YOU ALL LUCK
P-signal

CADJPY – Final Diagonal Before the Drop!We’ve been tracking CADJPY for years, and price continues to follow Elliott Wave structure with precision.
The major decline in 2024 completed wave (1) and triggered a higher-timeframe correction. Since then, price has developed a clear W–X–Y structure.
- W topped in late 2024
- X completed after a clean ABC decline
- Price is now in wave Y, unfolding as a zigzag (5-3-5)
Within Y, waves (A) and (B) have completed, and price is now pushing through the final 5-wave structure of wave (C). This final diagonal is what will complete the entire W–X–Y correction before the next major bearish leg begins.
Our focus is now on the ending diagonal forming in wave (C). Once this diagonal structure breaks, it will confirm that wave Y has completed and that the higher-timeframe downtrend is ready to resume.
Trade Idea:
Entry: Break of the diagonal
Stops: Above the break candle / above the final high of the diagonal
Targets:
TP1: 101.50 (1200 pips)
TP2: 95.00 (1850 pips)
Optional runner: Keep a portion open for long-term continuation
Goodluck and as always, trade safe!
See below for our previous CADJPY analysis:
Swing 1:
Swing 2:
Swing 3:
Swing 4:

NATGAS What Next? SELL!
My dear friends,
NATGAS looks like it will make a good move, and here are the details:
The market is trading on 5.337 pivot level.
Bias - Bearish
Technical Indicators: Supper Trend generates a clear short signal while Pivot Point HL is currently determining the overall Bearish trend of the market.
Goal - 5.198
Recommended Stop Loss - 5.408
About Used Indicators:
Pivot points are a great way to identify areas of support and resistance, but they work best when combined with other kinds of technical analysis
Disclosure: I am part of Trade Nation's Influencer program and receive a monthly fee for using their TradingView charts in my analysis.
———————————
WISH YOU ALL LUCK

BTCUSDT.P - December 8, 2025Bitcoin is stabilizing after a prior downside leg and is now trading in a broad consolidation just above the highlighted mid-range support band around 88,500–90,000, with a clearly defined resistance zone at 97,000–98,000. A break and sustained close above that resistance would confirm a bullish continuation toward the projected 105,000–106,000 area, with invalidation below the 93,300 stop region. Conversely, rejection from resistance followed by a loss of the 88,500–90,000 support band would reassert the broader downtrend and open the way for a deeper move toward the lower 80,000s.

GBPCAD Will Explode! BUY!
My dear subscribers,
This is my opinion on the GBPCAD next move:
The instrument tests an important psychological level 1.8412
Bias - Bullish
Technical Indicators: Supper Trend gives a precise Bullish signal, while Pivot Point HL predicts price changes and potential reversals in the market.
Target - 1.8495
About Used Indicators:
On the subsequent day, trading above the pivot point is thought to indicate ongoing bullish sentiment, while trading below the pivot point indicates bearish sentiment.
Disclosure: I am part of Trade Nation's Influencer program and receive a monthly fee for using their TradingView charts in my analysis.
———————————
WISH YOU ALL LUCK

GOLD The Target Is UP! BUY!
My dear subscribers,
GOLD looks like it will make a good move, and here are the details:
The market is trading on 4206.0 pivot level.
Bias - Bullish
My Stop Loss - 4196.6
Technical Indicators: Both Super Trend & Pivot HL indicate a highly probable Bullish continuation.
Target - 4221.3
About Used Indicators:
The average true range (ATR) plays an important role in 'Supertrend' as the indicator uses ATR to calculate its value. The ATR indicator signals the degree of price volatility.
Disclosure: I am part of Trade Nation's Influencer program and receive a monthly fee for using their TradingView charts in my analysis.
———————————
WISH YOU ALL LUCK

USDJPY: Short Trade Explained
USDJPY
- Classic bearish formation
- Our team expects pullback
SUGGESTED TRADE:
Swing Trade
Short USDJPY
Entry - 155.39
Sl - 155.54
Tp - 155.15
Our Risk - 1%
Start protection of your profits from lower levels
Disclosure: I am part of Trade Nation's Influencer program and receive a monthly fee for using their TradingView charts in my analysis.
❤️ Please, support our work with like & comment! ❤️

EURUSD Sellers In Panic! BUY!
My dear followers,
I analysed this chart on EURUSD and concluded the following:
The market is trading on 1.1642 pivot level.
Bias - Bullish
Technical Indicators: Both Super Trend & Pivot HL indicate a highly probable Bullish continuation.
Target - 1.1653
Safe Stop Loss - 1.1636
About Used Indicators:
A super-trend indicator is plotted on either above or below the closing price to signal a buy or sell. The indicator changes color, based on whether or not you should be buying. If the super-trend indicator moves below the closing price, the indicator turns green, and it signals an entry point or points to buy.
Disclosure: I am part of Trade Nation's Influencer program and receive a monthly fee for using their TradingView charts in my analysis.
———————————
WISH YOU ALL LUCK

US30 Trading Opportunity! SELL!
My dear friends,
Please, find my technical outlook for US30 below:
The instrument tests an important psychological level 47934
Bias - Bearish
Technical Indicators: Supper Trend gives a precise Bearish signal, while Pivot Point HL predicts price changes and potential reversals in the market.
Target - 47694
About Used Indicators:
Super-trend indicator is more useful in trending markets where there are clear uptrends and downtrends in price.
Disclosure: I am part of Trade Nation's Influencer program and receive a monthly fee for using their TradingView charts in my analysis.
———————————
WISH YOU ALL LUCK

BTCUSDT.P - December 7, 2025Price is consolidating in a sideways range after a sharp prior decline, forming an ascending triangle-style squeeze against short-term resistance around 90,300–90,500. A break and sustained hold above this ceiling would likely trigger a continuation move toward the higher resistance band near 92,200–92,400, aligning with the marked long scenario. Failure to clear resistance followed by a break of the rising trendline and support near 89,200–89,300 would favor the short scenario, exposing the lower support zone around 87,300–87,600.

GOLD Consolidation Starts (Correction zone) Buyers Slow ExitNow after the all time high of 3482.
GOLD enters into a Consolidation zone Starts or (Correction zone) Buyers Slow Exit.
So at current market price 4180 Sell and again buy at 4000 and again sell at 4170 range and again buy at 3890 and again sell at 4050 and again buy at 3890 and again sell at 4160 and again buy at 3737.
This is for Education Purpose only, am still testing WD Gann theory!

NZDCAD: Long Signal with Entry/SL/TP
NZDCAD
- Classic bullish formation
- Our team expects pullback
SUGGESTED TRADE:
Swing Trade
Long NZDCAD
Entry - 0.7976
Sl - 0.7963
Tp - 0.8000
Our Risk - 1%
Start protection of your profits from lower levels
Disclosure: I am part of Trade Nation's Influencer program and receive a monthly fee for using their TradingView charts in my analysis.
❤️ Please, support our work with like & comment! ❤️

GBPUSD Set To Grow! BUY!
My dear friends,
My technical analysis for GBPUSD is below:
The market is trading on 1.3315 pivot level.
Bias - Bullish
Technical Indicators: Both Super Trend & Pivot HL indicate a highly probable Bullish continuation.
Target - 1.3332
Recommended Stop Loss - 1.3305
About Used Indicators:
A pivot point is a technical analysis indicator, or calculations, used to determine the overall trend of the market over different time frames.
Disclosure: I am part of Trade Nation's Influencer program and receive a monthly fee for using their TradingView charts in my analysis.
———————————
WISH YOU ALL LUCK

SILVER: Bearish Continuation & Short Trade
SILVER
- Classic bearish pattern
- Our team expects retracement
SUGGESTED TRADE:
Swing Trade
Sell SILVER
Entry - 58.349
Stop - 58.743
Take - 57.644
Our Risk - 1%
Start protection of your profits from lower levels
Disclosure: I am part of Trade Nation's Influencer program and receive a monthly fee for using their TradingView charts in my analysis.
❤️ Please, support our work with like & comment! ❤️

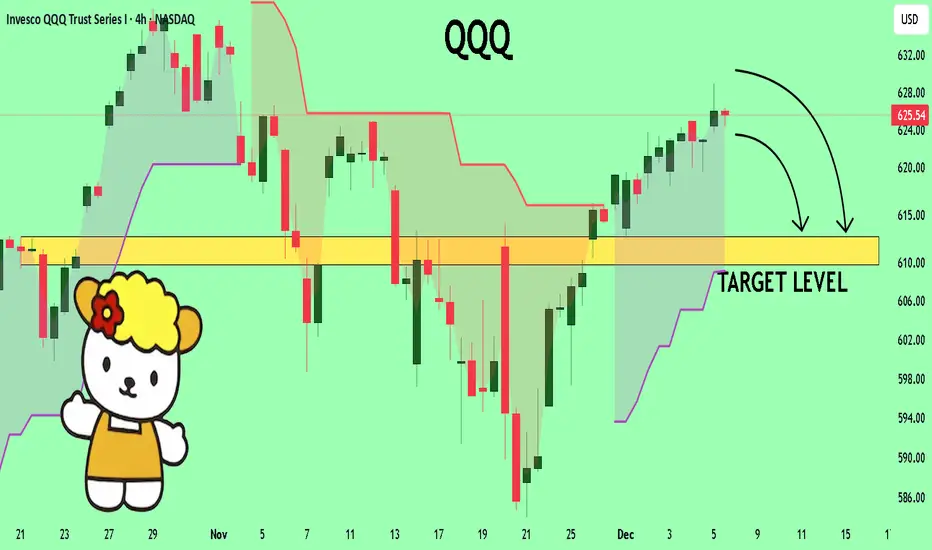
QQQ A Fall Expected! SELL!
My dear followers,
This is my opinion on the QQQ next move:
The asset is approaching an important pivot point 625.54
Bias - Bearish
Technical Indicators: Supper Trend generates a clear short signal while Pivot Point HL is currently determining the overall Bearish trend of the market.
Goal - 612.68
About Used Indicators:
For more efficient signals, super-trend is used in combination with other indicators like Pivot Points.
Disclosure: I am part of Trade Nation's Influencer program and receive a monthly fee for using their TradingView charts in my analysis.
———————————
WISH YOU ALL LUCK
BTCUSD Massive Long! BUY!
My dear subscribers,
My technical analysis for BTCUSD is below:
The price is coiling around a solid key level - 89308
Bias - Bullish
Technical Indicators: Pivot Points Low anticipates a potential price reversal.
Super trend shows a clear buy, giving a perfect indicators' convergence.
Goal - 91550
About Used Indicators:
By the very nature of the supertrend indicator, it offers firm support and resistance levels for traders to enter and exit trades. Additionally, it also provides signals for setting stop losses
Disclosure: I am part of Trade Nation's Influencer program and receive a monthly fee for using their TradingView charts in my analysis.
———————————
WISH YOU ALL LUCK

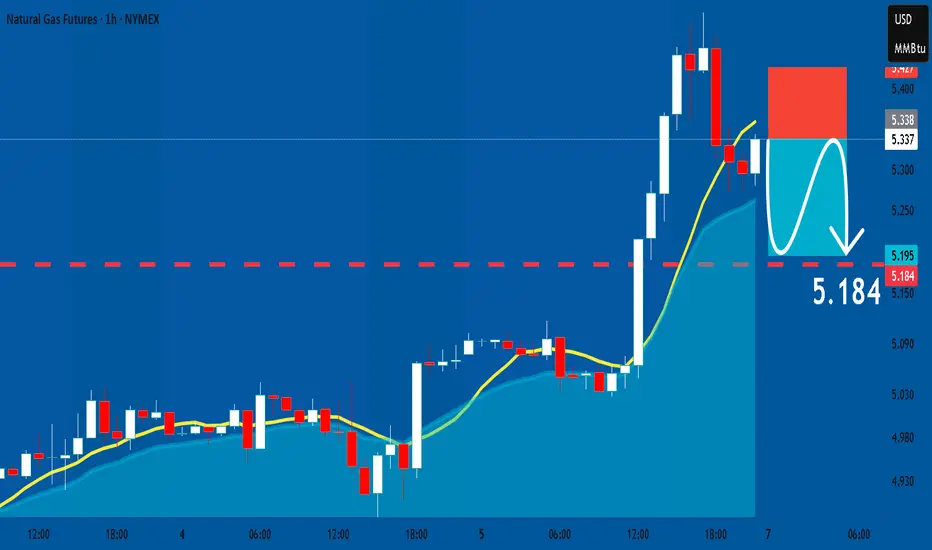
NATGAS: Short Signal with Entry/SL/TP
NATGAS
- Classic bearish formation
- Our team expects fall
SUGGESTED TRADE:
Swing Trade
Sell NATGAS
Entry Level - 5.338
Sl - 5.427
Tp - 5.184
Our Risk - 1%
Start protection of your profits from lower levels
Disclosure: I am part of Trade Nation's Influencer program and receive a monthly fee for using their TradingView charts in my analysis.
❤️ Please, support our work with like & comment! ❤️
EURUSD: Long Trading Opportunity
EURUSD
- Classic bullish setup
- Our team expects bullish continuation
SUGGESTED TRADE:
Swing Trade
Long EURUSD
Entry Point - 1.1642
Stop Loss - 1.1635
Take Profit - 1.1656
Our Risk - 1%
Start protection of your profits from lower levels
Disclosure: I am part of Trade Nation's Influencer program and receive a monthly fee for using their TradingView charts in my analysis.
❤️ Please, support our work with like & comment! ❤️

SILVER My Opinion! SELL!
My dear followers,
I analysed this chart on SILVER and concluded the following:
The market is trading on 58.349 pivot level.
Bias - Bearish
Technical Indicators: Both Super Trend & Pivot HL indicate a highly probable Bearish continuation.
Target - 57.776
Safe Stop Loss - 58.724
About Used Indicators:
A super-trend indicator is plotted on either above or below the closing price to signal a buy or sell. The indicator changes color, based on whether or not you should be buying. If the super-trend indicator moves below the closing price, the indicator turns green, and it signals an entry point or points to buy.
Disclosure: I am part of Trade Nation's Influencer program and receive a monthly fee for using their TradingView charts in my analysis.
———————————
WISH YOU ALL LUCK

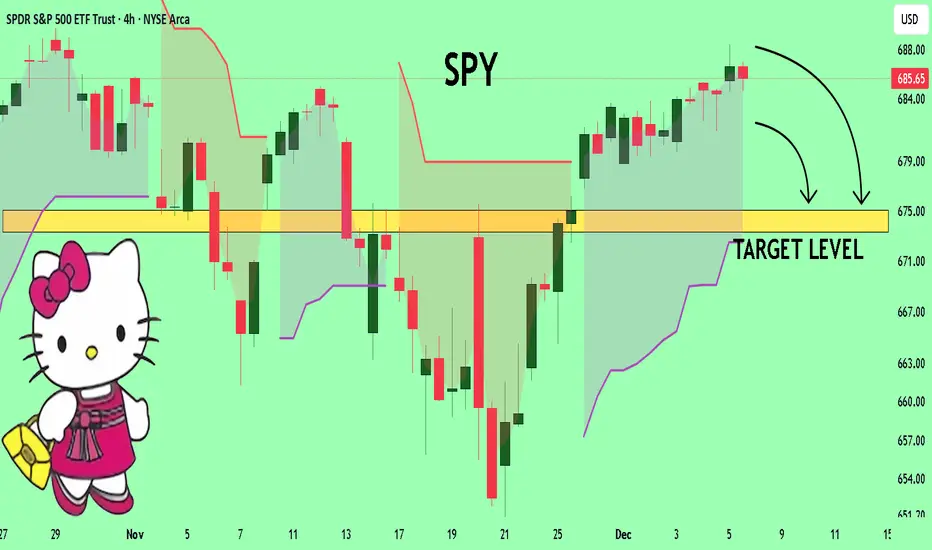
SPY Set To Fall! SELL!
My dear followers,
I analysed this chart on SPY and concluded the following:
The market is trading on 685.65 pivot level.
Bias - Bearish
Technical Indicators: Both Super Trend & Pivot HL indicate a highly probable Bearish continuation.
Target - 675.10
About Used Indicators:
A super-trend indicator is plotted on either above or below the closing price to signal a buy or sell. The indicator changes color, based on whether or not you should be buying. If the super-trend indicator moves below the closing price, the indicator turns green, and it signals an entry point or points to buy.
Disclosure: I am part of Trade Nation's Influencer program and receive a monthly fee for using their TradingView charts in my analysis.
———————————
WISH YOU ALL LUCK
USOIL Will Collapse! SELL!
My dear friends,
USOIL looks like it will make a good move, and here are the details:
The market is trading on 60.13 pivot level.
Bias - Bearish
Technical Indicators: Supper Trend generates a clear short signal while Pivot Point HL is currently determining the overall Bearish trend of the market.
Goal - 59.69
Recommended Stop Loss - 60.41
About Used Indicators:
Pivot points are a great way to identify areas of support and resistance, but they work best when combined with other kinds of technical analysis
Disclosure: I am part of Trade Nation's Influencer program and receive a monthly fee for using their TradingView charts in my analysis.
———————————
WISH YOU ALL LUCK

BTCUSDT.P - December 6, 2025Price remains in a short-term downtrend, respecting a descending trendline while failing to establish any higher swing highs. The current rebound shows weak momentum, suggesting a potential retest of the 87.5k–86.9k support region before any meaningful reversal attempt. A sustained break above 91.2k resistance would be required to confirm bullish structure, while a drop below 85.7k would likely extend the bearish leg. Overall, the market is consolidating within a corrective structure, awaiting a decisive breakout.

AUDCAD: Long Trade Explained
AUDCAD
- Classic bullish formation
- Our team expects growth
SUGGESTED TRADE:
Swing Trade
Buy AUDCAD
Entry Level - 0.9188
Sl - 0.9176
Tp - 0.9210
Our Risk - 1%
Start protection of your profits from lower levels
Disclosure: I am part of Trade Nation's Influencer program and receive a monthly fee for using their TradingView charts in my analysis.
❤️ Please, support our work with like & comment! ❤️
