EURUSD Bearish Continuation Toward LiquidityQuick Summary
The bearish outlook on EURUSD remains valid and Price may retrace higher toward 1.19617
After that a downside move is expected to break the equal lows formed today
This move would support continuation of the bearish trend toward the liquidity void left over the past two weeks
Full Analysis
The bearish view on EURUSD continues to hold despite short term price fluctuations
A corrective move higher is possible with price expected to reach the 1.19617 level
This upside move is considered a retracement rather than a trend reversal
From that area the market may resume its decline and target the equal lows formed earlier today
These equal lows represent a clear liquidity pool that often attracts price during bearish conditions
Breaking them would open the path for continuation of the broader downtrend
The ultimate objective of this move is the liquidity void that EURUSD has left behind over the past two weeks
That imbalance remains a strong magnet for price and supports the expectation of further downside
As long as price remains below recent highs the bearish scenario stays active
Any upward movement is viewed as an opportunity for continuation rather than a change in market direction
Community ideas

Gold - Preparing the final blow off top!💰Gold ( OANDA:XAUUSD ) will rally a final +20%:
🔎Analysis summary:
Just in January alone, Gold is up another +25% so far. Looking at this very bullish parabolic rally, Gold remains super strong and is still not done with the bullrun. Until Gold retests the ultimate resistance trendline, it can easily rally another +20% from the current levels.
📝Levels to watch:
$6,000
SwingTraderPhil
SwingTrading.Simplified. | Investing.Simplified. | #LONGTERMVISION

Ethereum update after "the crash" — $1.67B long liquidations 24hThere is no crash really, more like a continuation of the retrace...
Good morning my fellow Cryptocurrency trader, I hope you are having a wonderful day.
Ethereum is a very strong buy right now. We are witnessing the production and confirmation of a higher low. 30-January 2026 vs 21-November 2025. A true higher low I should say this time.
The low 21-November was $2,623. The low today $2,689. This is technically a double-bottom. The price is too close to the last low but the higher low signal still valid remains. It can be read in both ways.
On a daily basis, trading volume has been dropping since November 4.
What to expect?
Within the last 24 hours, $1.67B worth of long positions have been liquidated. The signal that I've been mentioning for the bulls also works in reverse. That is, when the market liquidates $1.2B worth of shorts within 24 hours, we know the bulls are in.
The fact that we have this much liquidations, $1.67B in just a single day, reveals the retrace is over. The bulls have been liquidated, the market can go up next.
The exchanges will use all the profits they made through selling and loaning and fees to buy everything at bottom prices, at the current market low. This low is the lowest possible, the exchanges know. Many people are not able to buy because of the recent move but the exchanges can, they buy everything at the low and prop up the market. When prices are really high, the same situation with the long positions will be repeated with the shorts.
Remember, we trade against exchanges not other people, and the exchanges have all of our information and hold all the coins. The way to beat the exchanges is to buy spot focusing on the long-term.
Ethereum continues to be bullish, market conditions have not changed.
We have an even better entry price now. Prepare for massive growth. The last bullish advance before the continuation of the bear market that started 4 months ago.
While Ethereum produced a lower high based on the candle wick, within the consolidation range, it produced a higher high based on candle close. The candle close is more important than the wick. Couple this with the current double-bottom/higher low, and you get the picture... The relief rally is not over, we have one more bullish move before the continuation of the bearish cycle.
The next drop, after the last jump, will produce a strong lower low compared to 21-November 2025. Right now, we are still within the same trading zone.
The smaller altcoins will grow many times more compared the bigger projects. Many of these altcoins were not affected by Bitcoin's and Ethereum's recent drop, ENSOUSDT and THEUSDT are two quick examples if you want to see some charts, also ROSEUSDT from the ones I've been sharing recently. This reveals much. Many of these altcoins will produce a massive bull run in the coming weeks. Choose wisely.
Namaste.

EURUSD: Bearish to 0.87 in 3 Waves for wave ((b)) or (2)DISCLAIMER : All labelling and wave counts done by me by manually and i will keep change according to the LIVE MARKET PRICE ACTION. So don't bias, hope on my trade plans...try to learn and make your own strategy...Following is not that much easy...I AM NOT RESPONSIBLE FOR ANY LOSSES IF U TOOK THE TRADE ACCORDING TO MY TRADE PLANS....THANKS LOT..CHEERS

Microsoft (MSFT) Shares Post a Record DeclineMicrosoft (MSFT) Shares Post a Record Decline
On Wednesday, after the close of the regular trading session, Microsoft (MSFT) released its quarterly earnings report, which exceeded analysts’ expectations:
→ Earnings per share: actual $4.14, forecast $3.90;
→ Gross revenue: actual $81.2bn, forecast $80.3bn;
→ Operating profit: up 21%.
Despite the strong results, MSFT shares suffered a dramatic sell-off of around 10% by the close of yesterday’s trading. According to media reports, this was the largest one-day drop in Microsoft’s share price on record, with the company losing roughly $360bn in market capitalisation.
Why MSFT Shares Collapsed
Market participants were most likely disappointed by the following factors:
→ A sharp rise in capital expenditure: capex surged by 66% to $37.5bn as Microsoft continued to invest heavily in data centres and AI infrastructure, while the timing of meaningful returns on these investments remains uncertain.
→ Slowing growth in the cloud computing segment.
Technical Analysis of Microsoft (MSFT) Shares
When analysing the MSFT chart on 15 January, we identified a key ascending channel reflecting the stock’s long-term price structure. At that time, we suggested that the market might find a temporary balance ahead of the earnings release.
Since then, although volatility persisted, the price showed an ability to recover from 22 January onwards, indicating that buyers were attempting to wrest control from sellers.
Yesterday’s record decline significantly altered the picture, but two factors are worth noting:
1 → The price fell below the 1 May low, entering the area of a broad bullish gap located above the psychological $400 level.
2 → In 2026, the market has been forming a descending channel (shown in red), with the price now reaching its lower boundary.
It is reasonable to assume that these two factors could act as support. The structure of yesterday’s candle supports this view: the session closed well above the low, and trading volumes were the highest in several years. This suggests active buying interest, with the price rebounding from around $422 to $433.
As a result, it is possible that the initial emotional reaction may fade and MSFT shares will avoid a further acceleration of the downtrend. However, a meaningful shift back to a bullish market structure would require strong fundamental catalysts.
This article represents the opinion of the Companies operating under the FXOpen brand only. It is not to be construed as an offer, solicitation, or recommendation with respect to products and services provided by the Companies operating under the FXOpen brand, nor is it to be considered financial advice.

ES UpdateNot really sure what the heck the market is doing, lol. Germans tanked the market this morning, it rebounded, but AAPL didn't move at all on earnings so no pump tonight. I had bought some calls yesterday, but flipped them in the morning when the market started to tank.
Holding a few GM and PCAR calls, but I'm probably just gonna close the positions tomorrow morning and call it a week. Made a bunch of money on AAPL calls this week. Pre-earnings play, I did not hold any overnight.
Probably gonna go cash over the weekend and figure out a new play next week.

GOLD HOLDS BULLISH STRUCTURE AFTER FOMC — VOLATILITY IS THE OPPO📰 FOMC Update (Jan 29)
The Fed kept rates unchanged, as expected.
Powell remained data-dependent, avoiding any aggressive hawkish shift.
Markets read this as no urgency to tighten further, keeping real yields capped.
Result: USD hesitates → Gold volatility expands, but trend stays intact.
This is not “buy the news” — it’s flow reacting to policy clarity.
📊 Technical Structure (H1–H4 Context)
Clear bullish BOS before FOMC → trend already established.
Post-FOMC impulse pushed price into ATH territory, followed by a healthy pullback.
No bearish CHoCH confirmed → structure remains bullish continuation, not distribution.
Price is correcting within trend, not reversing.
🔑 Key Zones to Watch
ATH / Premium Reaction: ~5560
FVG 1 (shallow pullback): ~5436
FVG 2 (deeper rebalancing): ~5353
These are reaction zones, not FOMO levels.
🧠 Scenarios (If – Then)
Primary Scenario – Continuation (≈70%)
If price holds above 5436, expect continuation toward new highs after rebalancing.
Alternative Scenario – Deeper Pullback (≈30%)
If 5436 fails, price may rebalance into 5353 FVG.
Only a clear H1 close below 5353 would weaken the bullish bias.
✅ Summary
FOMC created volatility, not a trend change.
Gold is respecting structure, absorbing liquidity, and preparing for the next leg.
Trade the reaction, not the headline.
Buy pullbacks. Respect structure. Let price confirm.

GOLD(XAUUSD): still runningHi there
gold hunted twice the boundary of the rectangle pattern!
But I think it will break it up!
The target of the long position will be around $5326!

USD - The Oversold TestRSI on the daily chart of DXY got down to extreme levels earlier in the week with a Tuesday close below the 25-level. This would be the lowest value for the indicator since 2020 when, at the time, the Fed was pushing loose monetary policy to stimulate growth despite much of the globe still being shut down. That instance soon led to a significant low and that was followed by a roaring rally in 2021 and 2022 as the Fed finally reacted to inflation.
RSI is not a great timing indicator - but it can be fantastic context and that's what I'm taking this as currently. It doesn't mean automatic reversal but it does mean caution if chasing the trend lower.
As for drivers, I think it's obvious what would need to push to allow the sell-off to continue and that's continued unwind of the USD/JPY carry trade, which for the past two days has been stalled. Going into Friday the big question is whether we see another push of weakness in USD/JPY which can have an outsized impact in DXY and, in-turn, USD-pairs, even something like EUR/USD despite the fact that the Euro is a much larger component of the DXY basket. - js

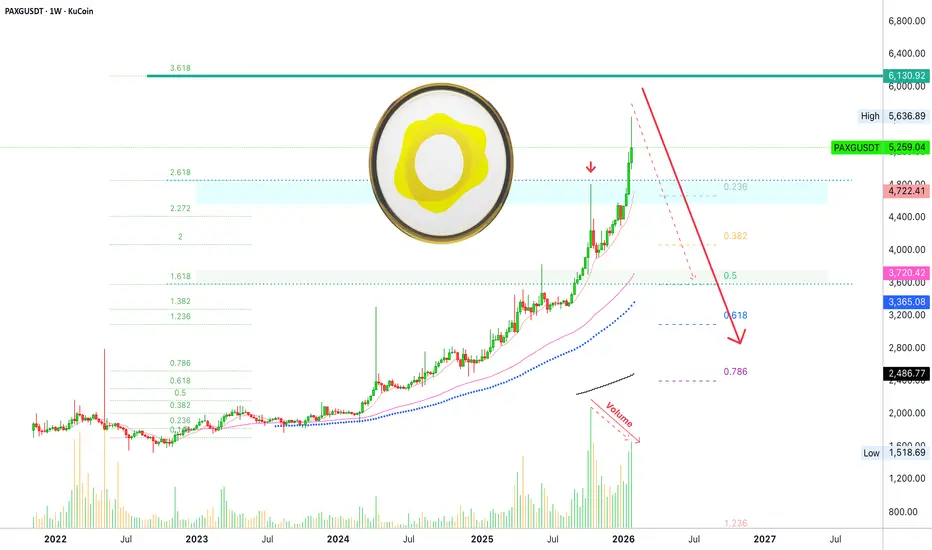
PAX Gold goes bearish · vs bullish altcoins marketPAX Gold produced a long upper wick mid-October 2025. As this bullish move was happening, we also witnessed the highest volume ever.
After a small retrace, PAXGUSDT continued growing reaching a new all-time high this month, January 2026. The ATH this month has less volume compared to October. This gives us a bearish volume divergence. At the same time, the RSI is overbought and also showing a four months old bearish divergence.
With a full parabolic rise, PAX Gold now has bearish potential. A major crash can happen anytime.
PAX Gold vs the altcoins market
When PAXG was extremely bullish mid-October 2025 the altcoins were extremely bearish. As PAX Gold moved up, the altcoins moved down.
Seeing the inverse relation, it can happen that as the PAX Gold moves down the altcoins market moves up.
Namaste.
This is not the end this is beginning 5% gain towrd 5700$Hi
The title and my previous ideas(tagged under this post) for gold tell everything, no need for more explanation.

IMPORTANT BITCOIN ALERT! TRAP BEFORE THE CRASH? Jan 30 2026!!BTC IMPORTANT ALERT! Jan 29 2026.
I know you've been waiting for this update, but there's been a new development in the chart.
Data from 2014 to 2026, presented across multiple charts, suggests that we are approaching a major market crash. That said, there may still be short-term rallies in altcoins, while Bitcoin is likely to remain relatively muted. This final move could turn out to be the ultimate bull trap.
This is purely based on fractal analysis; it’s not a personal bias.
I expect Bitcoin to form a bottom somewhere between $44k and $54k over the coming months. I’ll be sharing a more detailed chart soon, including the projected timelines for potential bottoms in both BTC and altcoins.
I plan to position on the bearish side once the final bull trap is in. Until then, we will continue scalping on lower timeframes, primarily from the short side.
We will make money even if the market crashes.
This cycle hasn’t been the bull run we hoped for; it’s been brutal. But what defines us is that we never give up. We adapt, we fight back, and we keep going.
Hope this gets the point across.
In short, BTC could still push as high as $100k in the coming weeks as part of a final bull trap, even though the overall structure looks extremely ugly.
Please hit the like button if you like it.
Let me know what you think in the comments.
Thank you
#PEACE

SLV - Parabolic Exhaustion Play - $100 Puts Feb 13📉 Pattern Recognition Setup
AMEX:SLV just completed a 68% run from $65 to $110 in under 3 months. This isn’t normal commodity ETF behavior - this is meme-stock price action.
Key Observation:
The current parabolic structure mirrors the prior $30→$48 spike that collapsed violently after hitting exhaustion (see bar pattern overlay on daily). Same RSI divergence, same volume behavior, same exhaustion signature.
Technical Confluence:
• RSI: 74 (overbought with multiple bear divergence signals)
• Structure: Double top at $110 resistance zone
• Volume: 8h chart shows peak Volume surges mark local Tops/Bottoms
• Pattern Target: $88.91 measured move
• Historical Precedent: Prior parabolic collapse followed identical setup
Trade Details:
Entry: $100 Puts, Feb 13 expiration
Trigger: Close below $105 on 4H timeframe
Target: $88-90 zone
Stop: Reclaim and hold above $110 invalidates pattern
Risk Management:
This is a defined-risk speculation on technical pattern completion. When parabolic runs exhaust at resistance with stacked divergence, retracements are swift and violent - not gradual. Size accordingly.
Timeline: 11 trading days for execution
This is my own thoughts put together by Claude.ai
This is my own charting and my own words and thoughts gathered into a presentable form.

Gold Near 5600: Pullback to 5300 Before Next Liquidity Run AheadXAUUSD | Intraday Smart Money Plan – H1
Gold is trading inside a strong bullish structure after a clean upside expansion and BOS on H1. Price recently rallied into the 5,550–5,600 region, where momentum started to slow and candles showed hesitation. This typically signals liquidity delivery at highs rather than fresh institutional buying.
From an SMC perspective, price is deep in premium. Smart Money often uses these conditions to distribute and rebalance before deciding on continuation. The chart shows a clear H1 imbalance (FVG) and a defined buy zone below, suggesting unfinished business on the downside before any sustainable push higher.
Hot Macro Drivers Today
Gold remains highly reactive to:
• Ongoing Fed rate-path uncertainty and rate-cut timing debate
• Mixed U.S. data creating USD volatility
• Persistent geopolitical risks supporting safe-haven flows
These themes keep the higher-timeframe bias bullish, but intraday flows show rotation and liquidity engineering rather than straight-line continuation.
Market Structure & Liquidity
• H1 structure bullish with confirmed BOS
• Liquidity swept near recent highs
• Clear FVG left below current price
• Defined demand zone around 5,302–5,300
• Logic: Premium distribution → Discount reload → Potential continuation
Smart Money seeks efficient pricing, not emotional breakouts.
Key Trading Scenarios
🔴 Premium Sell Reaction (Short-term)
Zone: 5,600–5,602
SL: 5,610
Confluence:
• Psychological 5,600 handle
• Prior liquidity objective
• Slowing momentum near highs
Expectation: rejection here can drive price into FVG / buy zone.
🟢 Discount Buy Reaction (Primary Setup)
Zone: 5,302–5,300
SL: 5,290
Confluence:
• H1 demand + prior structure
• Liquidity sweep potential
• Ideal Smart Money reload area
Buy only after bullish confirmation on lower timeframes.
🟢 Continuation Targets
Upside: 5,600 → 5,630 external liquidity
Valid after a proper discount reaction and shift in order flow.
Invalidation
Strong H1 acceptance and hold above 5,610
→ Signals direct continuation without deeper pullback.
Expectation & Bias
• Not a FOMO environment
• Liquidity comes before direction
• Rejection = rotation
• Acceptance = continuation
• Execution > prediction
Gold is at a decision point:
Will price mitigate the H1 imbalance and tap 5,300 liquidity first — or accept above 5,600 and run external liquidity?

Time & Price Map – Intraday NIFTY (Educational)Time & Price Map – Intraday NIFTY (Educational)
Markets don’t move just on levels —
they move when price reaches a level at the right time.
Today’s intraday structure is guided by a Time & Price Map, where demand is expected to respond within a defined time window.
🧠 Educational Framework:
CMP: 25,380
Strategy: Buy on Dips
Support Validity: Above 25,325
Stop Loss: Below 25,325
⏳ Time is the Key Variable:
This setup remains active on or before 2:15 PM.
If price respects support within this time window, probability favors continuation.
🎯 Projected Price Zones:
Target 1: 25,510
Target 2: 25,595
📐 Why This Matters (Learning Point):
Price reaching a level without time confirmation is incomplete.
When time and price align, moves become decisive and fast.
📊 Viewer Takeaway:
Intraday trading is not about prediction —
it’s about mapping where price should be, and by when.
⚠️ Educational view only. Risk management is essential.

GBPJPY - LONGS BACK TO LAST HIGHS?After finding support at 210.344 I am expecting GBP/JPY to continue its bullish momentum
TP1: 214.225


Gold Is Not Crashing — Traders Are Being Forced OutWhat we are seeing in Gold right now is NOT normal volatility.
In my entire trading career, I have rarely seen:
• 400–500 pips moves on every 5-minute candle
• 4000+ pips drop in under 30 minutes
• Zero respect for structure, zones, or indicators
This is not technical selling.
This is forced liquidation.
Here’s what’s really happening:
• Over-leveraged traders getting margin called
• Brokers force-closing positions
• Algorithms accelerating panic
• Liquidity disappearing between candles
That’s why: ❌ No pullbacks
❌ No structure respect
❌ No “entry confirmation” works
If you are trading this like a normal market, you are already late.
🔑 Reality check:
When volatility explodes, survival matters more than accuracy.
This is not the time to: • Chase trades
• Predict bottoms
• Prove you’re right
This is the time to: • Reduce risk
• Reduce size
• Or stay out completely
💬 Serious question:
Are you trading this market —
or is this market trading you?

BTCUSD – 30M – Bullish Continuation From SupportBITSTAMP:BTCUSD
After sweeping liquidity from the lower demand zone, BTC shifted momentum bullish and pushed toward the 90,700–91,000 resistance zone. Price is now retracing into prior support, suggesting a potential continuation if buyers defend the level.
Key Scenarios
✅ Bullish Case 🚀 → Hold above 88,500 with bullish reaction
🎯 Target 1: 90,700 – 91,000
🎯 Target 2: 91,800 – 92,200
❌ Bearish Case 📉 → Clean breakdown below 88,500
A loss of structure opens downside toward 86,300 demand, invalidating the bullish setup.
Current Levels to Watch
Resistance 🔴: 90,700 – 91,000
Support 🟢: 88,500 / 86,300
⚠️ Disclaimer: This analysis is for educational purposes only. It is not financial advice. Please do your own research before trading.

GOLD-SELL strategy weekly chart Reg ChannelI have not changed my medium-term outlook. This is not a trading outlook, rather setting up position for medium-term for the expected recovery. The market is no doubt one-way street, and this makes it dangerous, since the move up will be a correction that will be as severe. the catalyst we cannot predict, but market has build in expectation of collapse of system, and/or collapse of the dollar, which neither is likely in the near-term, is my personal viewpoint.
Strategy is SELL @ 5,450-5,600 (adding to existing shorts) and take profit in stages, first @ $ 4,250 area and followed by $ 3,700.

AUDUSD potential SELLAUDUSD is currently in a clear bearish market structure after strong downside displacement. This is a sell idea, not an active trade yet.
Price has not tapped my entry zone, so I’m patiently waiting for a retrace into the marked premium / supply area. Location aligns with prior highs and bearish imbalance, giving good downside potential if price delivers.
The setup only becomes valid once price reaches the zone and shows lower-timeframe bearish confirmation (structure shift or strong rejection). Until then, no entry — patience over forcing trades.
Bias remains bearish as long as structure holds. Invalidation above the supply high.

EUR/USD: Multi-Wave Corrective Cycle and Major Support TestThe EUR/USD pair is currently developing a complex corrective structure on the 15-minute timeframe. Following a strong rejection from the recent swing highs near 1.20000, the price action is showing a clear shift into a bearish distribution phase. The market is now oscillating within a descending series of peaks, seeking to mitigate imbalances created during the previous impulsive move.
Technical Observations:
Distribution at Premium: The price has formed a localized "Lower High" structure after failing to sustain momentum above the 1.19872 level. This indicates that institutional sellers are defending the upper boundary of the range.
Forecasted Corrective Trajectory: As illustrated by the black forecast path, we anticipate a multi-wave decline. This structure involves several minor internal rallies (relief bounces) that are expected to be sold into, leading the price toward deeper liquidity pools.
Key Support Objectives:
Primary Target: 1.19000 – This immediate purple demand zone represents a significant structural floor where initial buy-side interest is concentrated.
Major Objective: 1.18200 – A deeper extension toward the foundational support block (lower purple box), which marks the base of the primary accumulation phase.
Risk Parameters: The bearish outlook for this correction is invalidated if the price produces a decisive 15-minute candle close back above the 1.19900 mark. Such a move would suggest a resumption of the bullish trend toward new highs.
Execution Logic: This setup favors a "Sell the Rally" strategy within the corrective phase. Traders should monitor for bearish confirmation—such as rejection wicks or engulfing candles—at the peaks of the projected relief bounces before targeting the major demand zones below.

Gold 30Min Engaged ( Bullish Reversal Entry Detected )⚡Base : Hanzo Trading Alpha Algorithm
The algorithm calculates volatility displacement vs liquidity recovery, identifying where probability meets imbalance.
It trades only where precision, volume, and manipulation intersect —only logic.
Technical Reasons
/ Direction — LONG / Reversal 4946 Area
☄️Bullish momentum confirmed through strong candle body.
☄️Structure shifted with higher-low near key demand base.
☄️Volume expanding confirms order-flow alignment upward.
☄️Buyers reclaimed imbalance with sustained clean break.
☄️Algorithm detects rising momentum under low liquidity.
⚙️ Hanzo Alpha Trading Protocol
The Alpha Candle defines the day’s real control zone — the first battle of momentum.
From this origin, the Volume Window reveals where the next precision strike begins.
⚙️ Hanzo Volume Window / Map
Window tracked from 10:30 — mapping true market behavior.
POC alignment exposes institutional bias and breakout potential zones.
⚙️ Hanzo Delta Window / Pulse
Delta window monitors real buying vs. selling power behind each move.
Tracks volume aggression to expose who controls the candle — buyers or sellers.
When Delta aligns with Volume Map, momentum becomes undeniable.
