Bear market has startedThe End of the Bull Cycle. Why I'm Selling Everything and Won't Buy Again Until September 2026.
For the last year and a half, I have said that we are in a bull market. I never once changed my opinion. But all things come to an end. The time has come.
September 13, 2025, the date I have been mentioning across my social media, was, in my opinion, the peak of this market cycle. As painful as it may sound, the bull market is over.
"Altseason" is a Scam. It's Time to Grow Up
Let's be honest. The "altseason" that everyone was dreaming of never happened. Yes, there were pumps on selective, mostly new coins. But the old guard, for the most part, showed nothing.
Therefore, I want to officially declare: I will never use the word "altseason" again. It's a meme from 2017. There are now over a million coins on the market. Liquidity is so diluted that pumping everything is impossible. Instead of "altseason," we have, and always will have, "selective pumps" driven by interested players. Our job is to learn how to find them, not to wait for a mythical wave that will lift all boats.
Why Now? The Classic Signs of a Top
I wouldn't be so certain if I didn't see the classic signs of euphoria that always appear at the top of a cycle:
- Universal Optimism: Governments are embracing crypto, creating reserve funds.
-Corporate Buying: Public companies are massively buying Bitcoin and Ethereum.
-Positive News: The media is filled with only positive news; no one wants to sell and is waiting for $200k, $300k, $500k.
When the crowd rushes into the market, smart money begins to exit. I prefer to be with the latter.
My Personal 2-Year Plan. Maximum Transparency
I'm not just saying the market will fall. I am publicly sharing my plan of action:
1. I am exiting the market into stablecoins NOW. I am locking in my profits.
2. I will NOT be buying the first correction. When Bitcoin drops to $90,000, most people will be buying, thinking it's a discount. I will not.
3. I plan to start actively buying again in September 2026.
Why so long? Because those who buy at the $90-100k mark risk sitting through two years of psychological and financial drawdown just to break even. I am not willing to pay that price. I won't disconnect from the market; I'll keep my finger on the pulse, but I don't plan on making any active buys.
Cycles Work. My Technical Rationale
My decision is not based on emotion but on cycle theory, which I have tested for years. The cycle consists of ~151 weeks of growth and ~51 weeks of decline. We have just completed the growth phase. The period between September 13 and October 6 is the exact reversal zone after which a decline should begin.
I could be wrong. No one can be right all the time. Perhaps the cycle theory will break this time. But I trust my system.
Conclusion: What's Next? The Long-Term View
I have not become a bear forever. I believe Bitcoin will hit $300,000. But not in the coming months. It will be worth that in 2.5 years, after a healthy 50-60% correction from the peak.
From this moment on, my bias is bearish. On strong upward bounces, I might even open short positions. A new game is beginning, with new rules. My job is to preserve my capital and multiply it in the next cycle. What about yours?
Why bear market started now Proofs:
Best regards EXCAVO
Community ideas

USD/JPY - Bullish Channel, Next Targeting 148.95 (23.09.2025)#USDJPY #Forex #Trading #TechnicalAnalysis
USD/JPY is trading within a Bullish Channel Pattern on the 30M chart, holding above the rising trendline support. The pair is bouncing from the support zone (147.50 – 147.70), signaling potential upside continuation.
🔹 Market Structure:
Bullish channel intact with higher highs & higher lows.
Price rejected the support zone and trendline.
Momentum suggests buyers could retest upper channel resistance.
🔹 Key Levels:
Support Zone: 147.50 – 147.70
1st Resistance: 148.58
2nd Resistance: 148.95
📈 Trading Idea:
As long as USD/JPY stays above the support zone, bulls may drive price higher toward 148.58 → 148.95.
⚠️ Invalidation:
A break below 147.50 would weaken the bullish outlook.
“Discipline + Patience = Consistency 🔑”

Lingrid | GOLD Rally Targeting $3800 Resistance Level ?The price perfectly fulfilled my previous idea . OANDA:XAUUSD is pressing higher after breaking out of its consolidation channel and reclaiming the 3750 level. The market structure is supported by an upward trendline with successive higher highs confirming bullish momentum. As long as price holds above 3728, a push toward the 3800 resistance zone remains likely. The broader trend continues to favor buyers with gold eyeing new all-time highs.
⚠️ Risks:
A drop back below 3728 would weaken the breakout and open the way for a retest of 3700 support.
Stronger USD from Fed Chair Powell comments could cap upside momentum.
Profit-taking near the 3800 psychological level may trigger short-term volatility.
If this idea resonates with you or you have your own opinion, traders, hit the comments. I’m excited to read your thoughts!

"XAUUSD Bullish Setup Toward 3800–3810"This chart shows the XAU/USD (Gold vs US Dollar) 1-hour analysis.
Price is currently trading around 3769 after a bullish move.
A support trend line is holding price momentum, suggesting buyers are still active above this level.
Immediate support is seen near 3753, while the trendline also aligns with this support zone.
If price respects the support trend line, a bullish continuation is expected.
The upside targets are marked at 3800 as the next key level, and 3810 as a potential new all-time high (ATH).
The projection indicates a possible short-term pullback to the trend line before resuming upward movement.
Overall, the setup suggests a bullish outlook, as long as price stays above the support and trend line.

Gold Bull Markets Long Term Overview and 2025 Market UpdateGold Bull Markets Long Term Overview and 2025 Market Update
________________________________________
• This cycle is different: record central-bank buying + renewed ETF inflows + lower real rates = powerful tailwind.
• Price: Gold notched fresh ATHs this month (up to $3,790.82). 2025 is shaping up as the strongest year since the late 1970s.
• Relative: Gold is crushing equities YTD (≈+40% vs S&P 500 ≈+13% total return).
• Setup: A 13-year “cup-and-handle” breakout in 2024 kick-started the move.
• Outlook: Base case from the Street: $3,700 by end-’25 and ~$4,000 by mid-’26; upside to $4,500 if flows accelerate.
________________________________________
🏆 Historic Gold Bull Markets — Timeline & Stats
1) 1968–1980 “Super Bull”
• Start/End: ~$35 → $850 (Jan 1980)
• Gain: ~2,330%
• Drivers: End of Bretton Woods, oil shocks, double-digit inflation, geopolitical stress.
• Drawdown: ~–45% (1974–1976) before the final blow-off run.
2) 1999–2011/12
• Start/Peak: ~$252 (1999) → ~$1,920 (2011–12)
• Gain: ~650%
• Drivers: Commodities supercycle, EM demand, USD weakness, GFC safe-haven bid.
3) 2016/2018–Present (The “CB-Led” Cycle)
• Start Zone: $1,050–$1,200 → New ATH $3,790 (Sep 2025)
• Gain: ~215–260% (depending on 2016 vs 2018 anchor)
• Drivers: Record central-bank accumulation, sticky inflation/low real rates, geopolitics; 2024 13-yr base breakout.
________________________________________
📊 At-A-Glance Comparison (Updated 2025)
Metric 1968–80 Super Bull 1999–2012 2016/18–2025 Current
🚀 Total Gain ~2,330% ~650% ~215–260% (so far)
⏲️ Duration 12 yrs 13 yrs 7–9 yrs (ongoing)
💔 Max Drawdown ~–45% (’74–’76) ~–30% (’08) ~–20% (2022)
🏦 Main Buyer Retail/Europe Funds/EM Central Banks (dominant)
🏛️ Pattern Secular parabolic Cyclical ramps 13-yr base → breakout (’24)
Notes: current cycle characteristics validated by WGC demand trends & technical breakout in Mar 2024.
________________________________________
📈 Top 10 Stats of the Current Bull (2025)
1. Price & ATHs: Spot $3,75–$3,79k; fresh ATH $3,790.82 on Sep 23, 2025.
2. 2025 YTD: Roughly +40–43% YTD (best since the late ’70s).
3. Central Banks: 1,045 t added in 2024 (3rd straight 1k+ year). H1’25 ≈ 415 t (still elevated).
4. ETF Flows: Strongest half-year inflows since 2020, aiding the surge.
5. Gold vs Equities: Gold ≈+40% vs S&P 500 ≈+13% total return YTD.
6. Jewelry Demand: Price strength is crimping tonnage (2024 down ~11%; Q2’25 –14% y/y), even as value hits records.
7. Gold–Silver Ratio: Now around ~85–88 (silver catching up as it pushes $43–$44).
8. Macro Link: Strong safe-haven bid + rate-cut hopes supporting new highs.
9. Technical: Confirmed cup-and-handle breakout (Mar ’24) underpinning trend.
10. Street Forecasts: DB lifts 2026 to $4,000; GS baseline $4,000 by mid-’26, upside $4,500 with bigger private-investor rotation.
________________________________________
🔄 What Makes This Bull Different (2025 Edition)
• 🏦 Central-Bank Dominance — Official sector is the anchor buyer (3rd straight 1k+ tonne year in 2024; 2025 tracking strong despite Q2 deceleration).
• ⚡ Faster Recoveries — Pullbacks have been shallower and shorter vs the 1970s analog.
• 📈 Coexisting With Risk Assets — Rare combo: gold ATHs with equities up YTD suggests a macro hedge bid alongside optimism in select risk assets.
• 📐 Structural Breakout — The 13-year base cleared in 2024 set multi-year targets.
________________________________________
🎯 Strategy Ideas (2025 & Beyond)
Core
• Buy/Hold on Dips: Stagger entries (DCA) into physical (allocated), ETFs (e.g., GLD/IAU), and quality miners/royalties.
• Prefer Physical/Allocated where counterparty risk matters; use ETFs for liquidity.
Satellite/Leverage
• Silver & GSR Mean-Reversion: With the GSR ~85–88, silver historically offers torque in up-legs. Pair with high-quality silver miners.
• Factor Tilt in Miners: Focus on low AISC, strong balance sheets, growing reserves, and jurisdictions with rule-of-law.
Risk-Management
• Define max drawdown tolerance per sleeve; pre-plan trims near parabolic extensions or if macro invalidates (e.g., real-yield spike).
________________________________________
🧪 Reality Check: What Could Invalidate the Bull?
• Real yields + USD rip higher (sustained), dampening non-yielding assets.
• Sharp halt in official-sector buying (e.g., policy shifts).
• Rapid growth re-acceleration reducing safe-haven & rate-cut expectations.
________________________________________
🧭 Quick Reference Tables
🧾 Summary: Historic vs Current
Feature 1968–80 1999–2012 2016/18–2025
Total Gain ~2,330% ~650% ~215–260%
Duration 12 yrs 13 yrs 7–9 yrs (ongoing)
Correction ~–45% ~–30% ~–20% (’22)
Main Buyer Retail/Europe Funds/EM Central Banks
Pattern Parabolic Cyclical Cup & Handle → Secular
🧩 “If-This-Then-That” Playbook
• If real yields fall & CB buying persists → Ride trend / add on consolidations.
• If USD + real yields jump → Trim beta, keep core hedge.
• If GSR stays >80 with silver momentum → Overweight silver sleeve for torque.
________________________________________
🧠 Outside-the-Box Adds
💼 Role in a Portfolio (example frameworks)
• Resilience sleeve (5–10%): Physical + broad ETF.
• Offense sleeve (2–5%): Quality miners/royalties; optional silver tilt.
• Tactical (0–3%): Trend-following overlay (breakouts/consolidations).
🧭 Decision Checkpoints (quarterly)
• Central-bank net purchases (WGC).
• ETF flows (Western markets).
• Real yields (10y TIPS), USD trend, and GSR.
________________________________________
🔚 Key Takeaways (Updated)
• Relentless official-sector demand + technical breakout are the twin pillars of this cycle.
• Macro mix (policy easing expectations, geopolitics, diversification from USD reserves) supports an extended run.
• Base case: Street sees $3.7k by end-’25 and ~$4k by mid-’26, with upside to $4.5k if private capital rotation accelerates. Manage risk; embrace volatility.

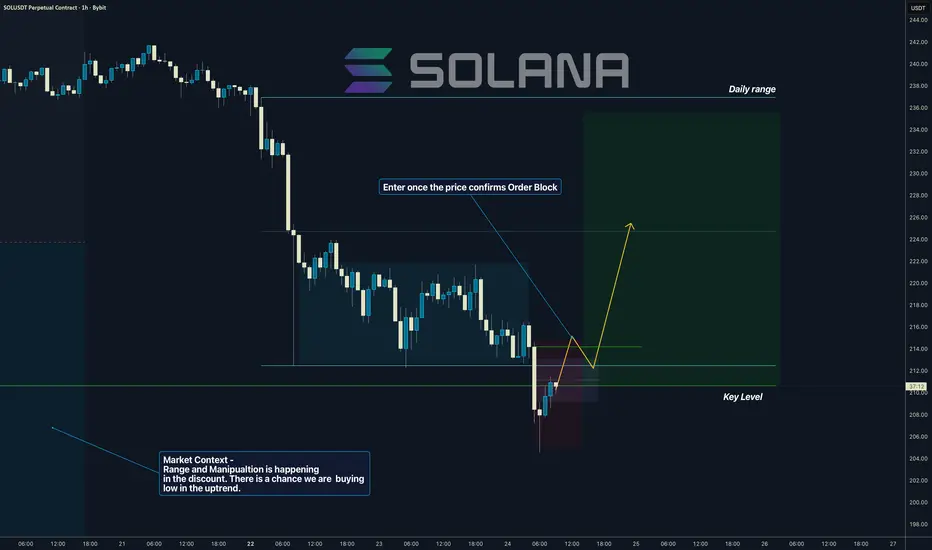
Solana I Daily Range I the discount - Manipulation phaseHi Traders, Solana is in the discount territory. Which means we are below a 50% of the latest up swing which is giving us nice trader probability for the patter.
📍
I have explained Premium / Discounts in this thread below
Price has created nice range which is being manipulated at this moment. In other words
market makers are loading liquidity.
📍I have explained liquidity in the thread below
📍At this stage when we are in the manipulation phase we dont know yet, if price will go up. Hence we must wait for the Order block confirmation which I explained in this thread bellow.
Once it all aligns and price switch in to the distribution phase there is a change for bullish move which is in sync with this HTF perspective.
💊 Note: this is just a probability. Win rate of this method is above 70% if you trade it with the right market context.
“Adapt what is useful, reject what is useless, and add what is specifically your own.”
David Perk aka Dave FX Hunter ⚔
Bitcoin (BTC/USDT): Uptrend ReinforcedHello everyone, after a brief pullback around 113,000 USD, Bitcoin has maintained its strength as it remains above the Ichimoku cloud – a clear signal that the uptrend has not weakened. The support zones at 111,000 USD and 110,000 USD are acting as crucial foundations, and if they hold, BTC could easily break above 113,000 USD to target 115,000 USD, with the potential to extend further toward 120,000 USD.
On the news side, the Fed’s continued high-rate policy has led many investors to view Bitcoin as an alternative safe-haven asset to the USD. At the same time, institutional involvement from companies such as MicroStrategy, Tesla, and particularly BlackRock’s Bitcoin ETF filing continues to strengthen confidence. With global uncertainties ranging from banking to trade, Bitcoin is standing out as a safer decentralised asset. Therefore, as long as the 110,000–111,000 USD zone remains intact, the primary bias for BTC continues to lean firmly to the upside.

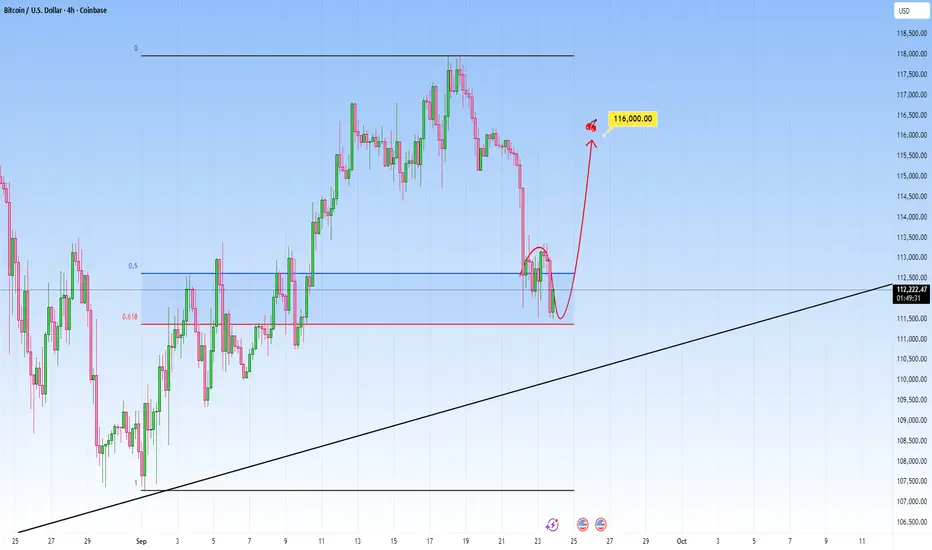
Bitcoin Analysis: Key Level to WatchPrice sold off aggressively, and now it sits within a key reaction area.
We can see price just tapped into the 0.5 and 0.618 Fibonacci retracement level of the last leg up. This is the golden pocket, a place where markets tend to react often.
Now look closely: price is showing early signs of rejection here, with wicks forming and momentum slowing down. If buyers step in here, and hold this zone that is our signals, targeting around the previous high.
But if price breaks clean below it, that invalidates the bullish idea and we could see some more continuation lower.
NZD/CAD: Time to Recover?!NZDCAD approached an important daily horizontal structure support level.
The subsequent test of this level halted the bearish momentum.
Furthermore, the market formed an inverted head and shoulders pattern on the 4-hour timeframe, subsequently breaching its neckline, thereby providing a clear bullish signal.
Consequently, a price rebound towards the 0.8131 level is anticipated.

XAU/USD | GOLD Breaking Records – $4K Target Loading…!By analyzing the TVC:GOLD chart on the 1-hour timeframe, we can see that nothing seems to be stopping its series of new record highs — it almost feels like the $4,000 target isn’t too far away! Every small correction in gold is simply gathering more liquidity and demand to push toward higher levels.
At this very moment, gold has printed a new ATH at $ 3,734 , and I expect the rally to continue. The next possible upside targets are $3,740, $3,780, and $3,800.
THE MAIN ANALYSIS :
Please support me with your likes and comments to motivate me to share more analysis with you and share your opinion about the possible trend of this chart with me !
Best Regards , Arman Shaban

EURUSD Pullback Toward 1.17400 as DXY Struggles Below 99Hey Traders, in today's trading session we are monitoring EURUSD for a buying opportunity around the 1.17400 zone. The pair is trading in an uptrend, with price currently correcting toward this key support/resistance level.
Structure: The broader bias remains bullish, but price is pulling back after recent highs.
Key level in focus: 1.17400 — a significant zone where buyers may look to rejoin the trend.
Fundamentals: The U.S. Dollar Index (DXY) remains in a downtrend and is correcting toward the 99.000 resistance area. If DXY fails to break higher, it could reinforce USD weakness and support a bullish continuation in EURUSD.
Trade safe,
Joe.

EUR/USD: Bullish Momentum Continues ? 👋Hello everyone, what do you think about the trend of FX:EURUSD ?
Today, EUR/USD continues to solidify its bullish momentum as it breaks through the key resistance level of 1.1800. This upward movement occurs amid a lack of stability in the US Dollar, declining US Treasury yields, and ongoing speculation that the Fed may cut rates twice by the end of the year, all setting the stage for the pair’s recovery.
From a technical perspective, I remain optimistic. If the upward momentum continues, the next target will be the resistance zone at 1.186, followed by the yearly high above 1.1900. A clear breakout beyond this level will pave the way for a potential move towards the round figure of 1.200.
And you, what do you think about EURUSD? Feel free to share your thoughts in the comments!
Wishing you successful and profitable trading!

Gold Continues to Probe for New Highs.👋Hello everyone, what do you think about the trend of OANDA:XAUUSD ?
Gold continued its upward momentum on Tuesday, reaching a new record high near 3800 USD. Persistent geopolitical tensions, the Federal Reserve's dovish stance, and signs of weakness in major economies in Europe and the U.S. seem to be sustaining investor interest in the precious metal.
At the time of writing, gold is hovering around 3765 USD, undergoing a slight pullback, but the overall trend still supports further gains. From a technical perspective, I believe that after this correction, we could see higher price movements. The immediate target is to reclaim the 3790 USD level, followed by 3800 USD, and if conditions remain favorable, we could push even higher, as long as no deep corrections occur.
💬What do you think about gold? Feel free to share your views in the comments, I'm looking forward to your feedback!
Good luck!

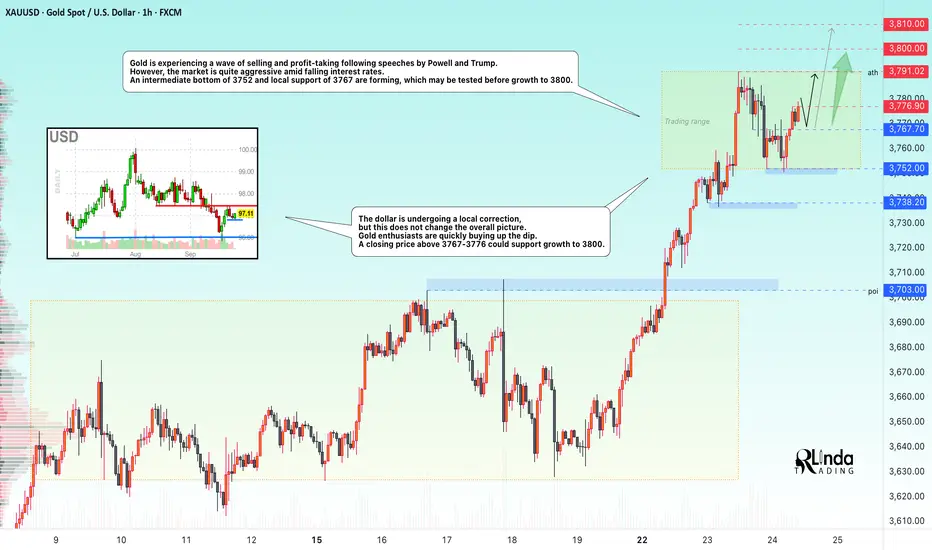
GOLD → Intermediate bottom. Consolidation before growth FX:XAUUSD is being sold off and declining amid profit-taking following speeches by Powell and Trump. However, the market is quite aggressive amid falling interest rates. After forming an interim bottom, the market quickly bought back the decline.
Gold is correcting after record growth, awaiting new signals from Fed representatives and PCE inflation data on Friday. The price remains close to historic highs, but the upward momentum has temporarily slowed, with consolidation forming at 3752-3791.
Key factors : Powell gave no clear hints about future rate cuts, noting the risks of rising inflation and a weakening labor market. The probability of a rate cut in October has risen to 92%, but the Fed's sentiment index is fluctuating somewhat...
The risk of a US government shutdown on October 1 and mixed PMI data are holding back the USD's strengthening.
Technically, gold remains in a bullish trend, but consolidation is possible in the short term. PCE data will be the deciding factor — weak figures will support the metal, while strong figures will trigger a correction.
Resistance levels: 3776.9, 3791, 3800
Support levels: 3767, 3752, 3738
The price is consolidating. Before reaching 3791-3800, there may be a retest of local support. Similarly, a retest of the ATH may also trigger a small pullback of 1/2 of the impulse before a breakout and growth to the specified targets.
Best regards, R. Linda!
XAUUSD Long: Bullish Momentum to ContinueHello, traders! The price auction for XAUUSD has been in a strong bullish phase, confirmed by the establishment of a well-defined ascending channel. This uptrend was initiated after a breakout from lower levels and has shown significant strength by pushing through multiple prior resistance areas, including the 3470 DEMAND 2 and 3675 DEMAND levels, turning them into new support.
Currently, the price action is continuing its ascent within the upper portion of this ascending channel, indicating that the bullish initiative remains firmly in control. The market is in a clear expansion phase, with very little sign of significant selling pressure, suggesting that any pullbacks are likely to be minor and short-lived.
My scenario for the development of events is a direct continuation of the current bullish momentum. I believe that the price will only make a shallow correction from the current levels before the next impulsive wave higher begins. In my opinion, the underlying trend is strong enough to carry the price to a new high within the channel. The take-profit is therefore set at 3835 points, targeting the upper resistance line of the channel. Manage your risk.

Can Pi Network(PI) Bounce +15% From PRZ?In recent days, Pi Network ( OKX:PIUSDT ) has dropped more than -40% , raising the big question: Is Pi still a project we can rely on, or is momentum fading away?
Main Reasons Behind the Drop:
1-Mass token unlocks in September → Huge increase in supply created heavy selling pressure.
2-Rising exchange reserves → More than 420M now sitting on CEX wallets, a sign of potential sell waves.
3-Fast-track KYC & protocol upgrades → Gave many users access to their tokens, fueling more selling activity.
4-Low liquidity + whale sell-offs → A few large orders accelerated the decline.
The Pi community remains strong, but current supply shocks are outweighing demand. Until the project reaches full exchange listings and sustainable utility, traders should stay cautious and manage risk carefully.
---------------------------------------------------------------
Now let’s take a look at the PI Token chart on the 15-minute time frame .
The PI Token has formed a descending channel over the past day.
From the perspective of Elliott Wave theory , it looks like PI Token is completing a Double Three Correction(WXY) in the descending channel .
I expect PI Token to start rising as it enters or touches the Potential Reversal Zone(PRZ) again and rise to $0.289(+15%) . In general, a break of the upper line of the descending channel is a good sign for the PI token to rise .
Please respect each other's ideas and express them politely if you agree or disagree.
Pi Network Analysis (PIUSDT), 15-minute time frame.
Be sure to follow the updated ideas.
Do not forget to put a Stop loss for your positions (For every position you want to open).
Please follow your strategy and updates; this is just my Idea, and I will gladly see your ideas in this post.
Please do not forget the ✅' like '✅ button 🙏😊 & Share it with your friends; thanks, and Trade safe.

Gold 30Min Engaged ( Bullish Reversal Entry Detected )Time Frame: 30-Minute Warfare
Entry Protocol: Only after volume-verified breakout
🩸Bullish Reversal - 3750
➗ Hanzo Protocol: Volume-Tiered Entry Authority
➕ Zone Activated: Dynamic market pressure detected.
The level isn’t just price — it’s a memory of where they moved size.
Volume is rising beneath the surface — not noise, but preparation.
🔥 Tactical Note:
We wait for the energy signature — when volume betrays intention.
The trap gets set. The weak follow. We execute.
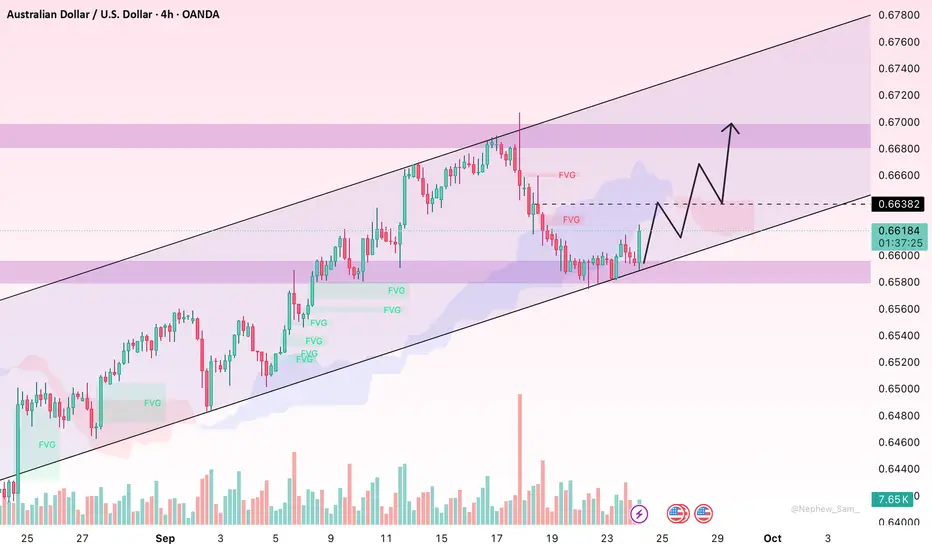
AUD/USD: Mild Uptrend and Key Levels to WatchHello everyone,
AUD/USD is currently maintaining a mild uptrend after breaking above 0.6590 and holding steady above 0.6600. On the chart, Fair Value Gaps (FVGs) appear as imbalances in price, which could act as areas where the market may revisit before resuming the trend.
From a technical standpoint, price is trading above the Ichimoku cloud, suggesting that the bullish bias remains intact. When price stays above the cloud, the market typically continues higher, with the cloud acting as dynamic support during pullbacks. Immediate support is seen at 0.6600 and 0.6580, while nearby resistance sits at 0.6620–0.6630. A breakout above this zone could open the way towards 0.6650 and potentially 0.6700. Trading volume has also increased during upward moves, signalling that buying momentum is still dominant.
On the news side, the Reserve Bank of Australia (RBA) recently kept interest rates unchanged, though markets anticipate potential adjustments in the coming months. This remains a key driver for the AUD. Meanwhile, US CPI data and the Federal Reserve’s policy stance are still the primary factors shaping USD direction. In addition, global economic conditions and trade tensions could contribute to further volatility in this pair.
Given the current picture, the preferred scenario is still to the upside. If AUD/USD breaks above 0.6630, the next targets could be 0.6650 and 0.6700. On the other hand, if price pulls back to test 0.6600–0.6580, it could provide a solid buying opportunity as long as supportive factors remain in place.
Wishing you successful trades and effective risk management!
GBPJPY: Aiming for New Highs👋Hello to my smart and wealthy friends, what do you think about OANDA:GBPJPY ?
Recently, GBPJPY reached a new high at 201.000 before pulling back slightly. However, the pair found support around 199.30 and has since entered a temporary consolidation phase.
The trend remains bullish as long as the support level holds firm, with the next target being to conquer the previous high. Keep a close eye on the price action around the support zone to identify potential opportunities.
I remain optimistic about this pair. What are your thoughts on GBPJPY? I'd love to hear your opinion, looking forward to your insights.
Good luck!

How to Avoid Massive Losses in Crypto ChaosThe crypto market is full of volatility and excitement these days.
How ready are you to make the right decisions amid this chaos?
Many traders enter without a plan and experience huge losses, but you can be different.
Hello✌️
Spend 2 minutes ⏰ reading this educational material.
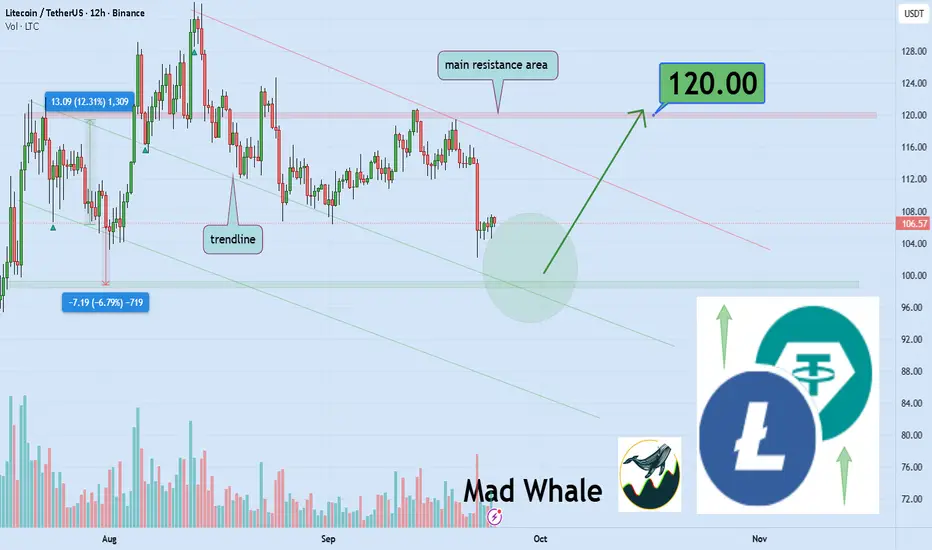
🎯 Analytical Insight on Litecoin:
Litecoin is testing a critical trendline and support zone 📉.
If it holds, a 12% rally could push price toward 120 USD 🚀.
Now , let's dive into the educational section,
Understanding Market Psychology and Trader Emotions 🧠
When the market is chaotic, fear and greed heavily influence your decisions.
Many traders panic sell during sharp drops and suffer major losses.
On the other hand, FOMO can push you to buy at the top and regret it after corrections.
Focusing on collective market behavior and identifying dominant emotions can help you avoid these mistakes.
Strategies to Prevent Big Losses 🚨
Always define your maximum acceptable loss.
Avoid heavy positions and high leverage.
Diversify your portfolio to reduce risk.
Use a combination of technical and on-chain analysis for smart decisions.
Watch whale movements; their large trades can shake the market.
Managing Emotions and Staying Focused ⚖️
Take deep breaths and avoid impulsive decisions.
Have a daily plan to check the market and resist FOMO.
Keep a trading journal to analyze and improve your behavior.
Practical Strategy During High Volatility 🔄
Volatile markets trigger impulsive decisions.
Always identify support and resistance levels.
In extreme swings, trade smaller and safer positions.
Avoid high leverage to prevent large losses in sudden moves.
Focus on the overall trend, not short-term price noise, to protect your capital.
Key TradingView Tools 🛠️
Stop Loss and Take Profit
Limit losses and lock in profits
Set entry and exit points before trading
RSI and MACD
Detect overbought or oversold conditions
Identify short-term trends
Volume Profile
See trading volume at different price levels
Spot real support and resistance zones
Alerts and Notifications
Set alerts on key levels
Stay ahead of sudden market movements
Short Summary 📌
By managing risk, using TradingView tools, and controlling emotions, you can limit big losses and identify safer opportunities.
3 Top Recommendations for Traders 💡
Always have a plan before entering any trade and set your maximum loss.
Avoid following crowd emotions and make decisions logically.
Use analysis tools in combination and practice to minimize risk effectively.
✨ Need a little love!
We pour love into every post your support keeps us inspired! 💛 Don’t be shy, we’d love to hear from you on comments. Big thanks , Mad Whale 🐋
📜Please make sure to do your own research before investing, and review the disclaimer provided at the end of each post
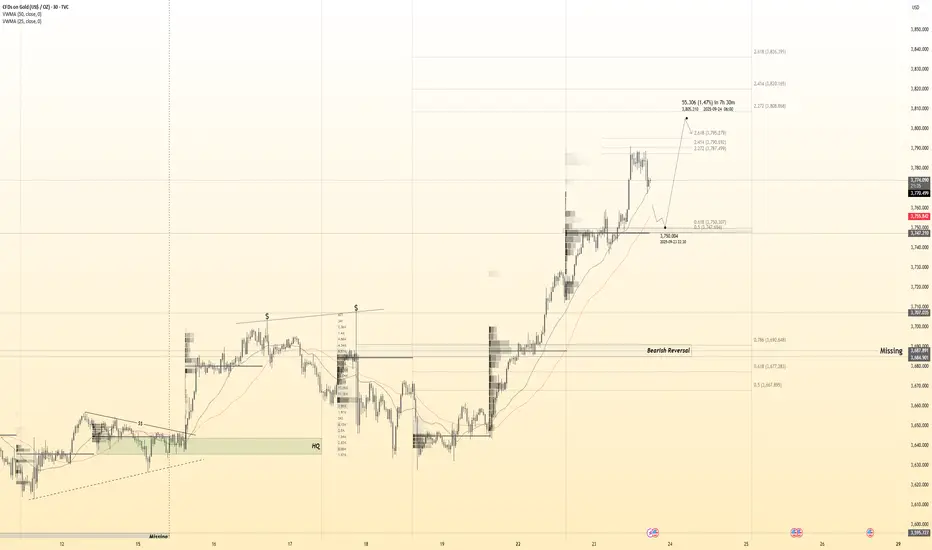
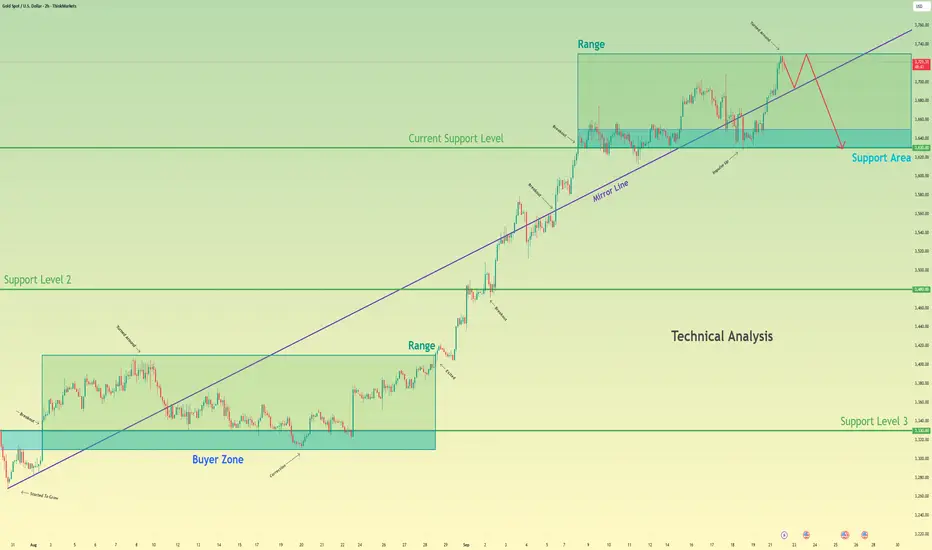
Gold can Complete its Topping Pattern and FallHello traders, I want share with you my opinion about Gold. The market has been developing a complex consolidation structure after its initial uptrend failed to sustain momentum. After breaking out of a first range, the bullish impulse failed, leading to a breakdown below the major ascending mirror line and establishing the current, higher second range. The price action for XAU has since been contained within this new consolidation, repeatedly testing the upper resistance and lower support boundaries. Currently, the asset is again testing the upper boundary of this range, an area that has consistently attracted sellers. In my mind, this price action is forming a complex topping pattern. I expect that the price will be rejected from the top of the current range, perhaps after a brief interaction with the nearby mirror line, and then fail at the highs one more time. I think this final failure will trigger a significant decline with enough momentum to break the mirror line support decisively. Therefore, I have placed my TP at the 3630 current support level, targeting the bottom of this second range. Please share this idea with your friends and click Boost 🚀
Disclaimer: As part of ThinkMarkets’ Influencer Program, I am sponsored to share and publish their charts in my analysis.
BTC Breakdown: Watching 112.6K-113.5K for Rejection Toward 109kHello guys!
Trend Structure:
The price was moving in a clear ascending channel, but recently broke down below the lower boundary with strong bearish momentum. This confirms a structural shift from bullish to bearish sentiment.
Current Price Action:
After the breakdown, BTC attempted a relief rally but is now struggling around the 112,682 – 113,581 resistance zone (marked in blue). This area was previously support inside the channel and is now acting as resistance (role reversal).
Scenarios (Entries):
Rejection at 112,682 zone:
If BTC fails to break above this resistance, sellers could step in and push the price lower. A clean rejection here would open the way toward 109,884 (next major support).
Deeper pullback to 113,581:
If bulls manage to push higher, the 113,581 level becomes the last line of resistance. A rejection here would be a high-probability short entry, also targeting 109,884.
Target Zone:
Both rejection scenarios point to 109,884 as the key downside target. A break below that level would increase bearish momentum toward 108,000 and possibly lower.

GOLD 4H CHART ROUTE MAP UPDATEHey Everyone,
Please see update on our 4H chart idea after completing our 1H chart idea yesterday.
This chart is also playing out analysed. We got our Bullish target hit at 3696 followed with ema5 cross and lock opening 3738. This target was also hit with a further cross and lock opening 3778. 3778 now completed with no further cross and lock confirming the rejection.
We will now use lower Goldturns for support and Bounce until we see further cross and lock above for a continuation.
We will keep the above in mind when taking buys from dips. Our updated levels and weighted levels will allow us to track the movement down and then catch bounces up.
We will continue to buy dips using our support levels taking 20 to 40 pips. As stated before each of our level structures give 20 to 40 pip bounces, which is enough for a nice entry and exit. If you back test the levels we shared every week for the past 24 months, you can see how effectively they were used to trade with or against short/mid term swings and trends.
The swing range give bigger bounces then our weighted levels that's the difference between weighted levels and swing ranges.
BULLISH TARGET
3696 - DONE
EMA5 CROSS AND LOCK ABOVE 3696 WILL OPEN THE FOLLOWING BULLISH TARGETS
3738 - DONE
EMA5 CROSS AND LOCK ABOVE 3738 WILL OPEN THE FOLLOWING BULLISH TARGET
3778 - DONE
EMA5 CROSS AND LOCK ABOVE 3778 WILL OPEN THE FOLLOWING BULLISH TARGET
3811 -
EMA5 CROSS AND LOCK ABOVE 3811 WILL OPEN THE FOLLOWING BULLISH TARGET
3845
BEARISH TARGETS
3655
EMA5 CROSS AND LOCK BELOW 3655 WILL OPEN THE FOLLOWING BEARISH TARGET
3615
EMA5 CROSS AND LOCK BELOW 3615 WILL OPEN THE FOLLOWING BEARISH TARGET
3583
EMA5 CROSS AND LOCK BELOW 3583 WILL OPEN THE SWING RANGE
3546
3509
EMA5 CROSS AND LOCK BELOW 3509 WILL OPEN THE SECONDARY SWING RANGE
3458
3409
As always, we will keep you all updated with regular updates throughout the week and how we manage the active ideas and setups. Thank you all for your likes, comments and follows, we really appreciate it!
Mr Gold
GoldViewFX
