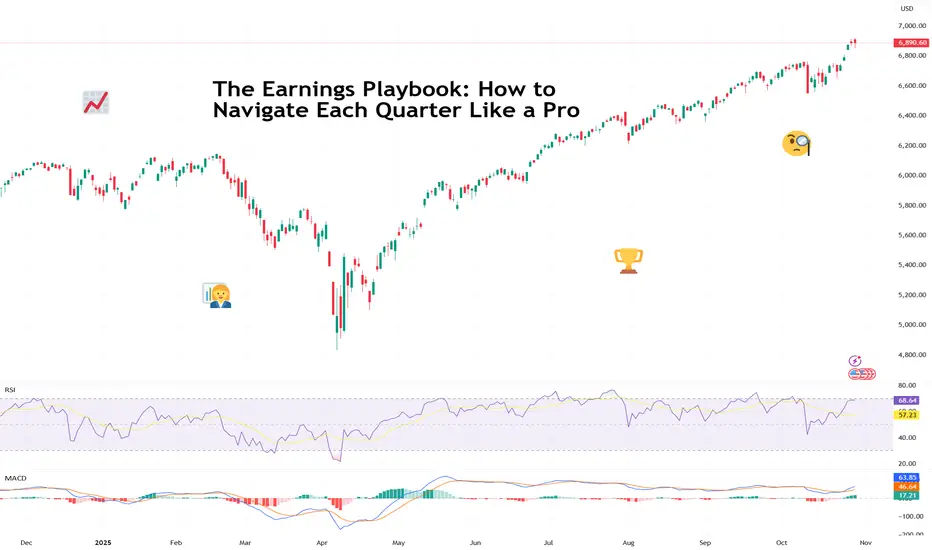
The Earnings Playbook: How to Navigate Each Quarter Like a ProTraders are in the heat of the earnings season and euphoria is sweeping every corner of the market.
The charts twitch, traders stop talking about the Fed for five minutes ( not this week, though ), and online forums turn into a parade of watch-me-trade sessions.
It’s that glorious stretch when companies pop open the books and reveal what’s really been happening behind the scenes.
For professional investors, it’s data heaven. For retail traders, it’s emotional cardio. Stocks can rise 20% on a single upbeat forecast — or plummet before your coffee cools. The trick isn’t just to survive it. It’s to navigate it like a pro.
💼 Know the Seasons (and the Mood Swings)
Earnings season comes four times a year — January, April, July, and October — and each has its own flavor.
Q1 (April): That’s the hangover quarter. Holiday sales meet new-year cost cuts. Traders recalibrate expectations and reality collides with ambition.
Q2 (July): The mid-year checkup. CEOs brag about “momentum,” analysts start sharpening their red pencils. Markets get twitchy.
Q3 (October): The credibility test. Guidance revisions and cautious tones dominate. If the year’s been good, this is where the victory laps start.
Q4 (January): The scoreboard reveal. Everyone tallies their annual wins and losses, and traders begin to bet on who carries the next year’s momentum.
Each cycle has a similar rhythm: hype, reaction, digestion, and speculation. Think of it like a four-act play.
📊 Mind the Gap
One thing to keep in mind whenever you find yourself in the earnings bonanza: the actual numbers matter less than the narrative. ( Looking at you, Oracle NYSE:ORCL )
A company can beat on revenue, miss on profit, and still rally — if the CEO sells a compelling story about the next quarter. Conversely, it can post record earnings and tank because analysts wanted even more.
The pros know to look beyond the headline EPS. They dig into guidance, margins, and segment performance. Is revenue growing because of genuine demand, or just creative accounting? Are margins improving, or did the company quietly cut R&D?
Markets don’t price what’s happened — they price what’s next. That’s especially true for growth stocks like t echnology companies .
🎯 Don’t Chase the Knee-Jerk
Every earnings season has its share of instant overreactions — the “up 10% at open, down 8% by lunch” kind of chaos. That’s when seasoned traders sit back and let volatility do the heavy lifting.
Smart money avoids buying into the frenzy or shorting into despair. Instead, they wait for the second move — when dust settles, algorithms calm down, and humans return to their desks.
🧠 Build Your Own Playbook
To trade earnings season like a pro, you need a plan. Here’s how the veterans prep:
Start early. Check the earnings calendar and mark high-impact names in your portfolio or watchlist.
Study the setup. Look at how the stock’s performed heading into earnings. A big pre-report rally can mean expectations are too high.
Focus on guidance. Earnings beats are old news — future commentary moves markets.
Use position sizing. Never bet the farm on one report. Even the best setups can go sideways.
Don’t forget the macro. Rate cuts, inflation prints, or a stray tweet from the US President can overshadow the best earnings beat.
🕹️ The Big Picture: Earnings as Market GPS
Earnings season is the market’s health check because it tells you which sectors are thriving, which are limping, and how CEOs feel about the future (watch the language: “headwinds” and “volatility” are polite ways of saying buckle up).
Taken together, earnings trends shape the broader narrative — from interest rate expectations to sector rotations. In other words, earnings season is where short-term trading meets long-term investing.
Now go and prepare for the next batch of earnings — Big Tech is on deck this week with Apple NASDAQ:AAPL and Amazon NASDAQ:AMZN reporting today.
Off to you : What’s your strategy this earnings season? Buying the hype or waiting to buy the dip? Share your thoughts in the comments!
Community ideas
Trading Bots: The Future of the Markets?Let’s be real, the idea of a trading bot sounds like the holy grail.
Set it up, go to bed, and wake up to profit.
If only it were that simple.
Most bots don’t fail because of bad code, they fail because of bad logic.
A bot is only as good as the rules you give it.
What a Trading Bot Actually Does
A bot doesn’t predict the market, it reacts to it.
It follows a defined strategy:
Buy when X happens, sell when Y is confirmed, cut losses if price breaks Z.
That’s all.
No fear. No greed. No “maybe I’ll wait for one more candle.”
The power of bots isn’t in magic,it’s in consistency.
They do what most traders can’t: follow the plan exactly as written, every single time.
Why Most Bots Fail
The truth?
Most traders plug in random bots they find online without understanding what’s inside.
They win a few trades, feel invincible… and then lose it all when volatility spikes.
The reason isn’t the bot, it’s the lack of testing and understanding.
If you don’t know your system’s weak spots, you’ll eventually find them the hard way.
That’s why backtesting matters.
Backtesting: Your First Line of Defense
Backtesting shows how your logic performs over hundreds of trades — across bull, bear, and sideways markets.
It reveals your system’s strengths, weaknesses, and drawdowns before you risk a dollar.
A good backtest should tell you:
Your average win rate and risk/reward ratio.
How your system handles volatility.
How often it hits consecutive losses.
Whether your edge actually holds over time.
If your bot looks good in backtests and performs similarly in live conditions — you’re onto something real.
*Example of one of our indicator
How Bots Can Enhance Your Trading
You don’t have to hand everything over to automation.
In fact, many great traders use bots to handle the mechanical side, while keeping the decision-making human.
Here are a few examples:
Trade Execution: Let the bot enter trades instantly after your setup triggers.
Risk Management: Bots can move stop-losses, take partial profits, or scale positions automatically.
Signal Filtering: Use automation to scan hundreds of pairs and alert you only when conditions align.
Backtesting Sandbox: Test new ideas safely with data before deploying them live.
Bots don’t replace traders, they multiply efficiency.
They free your mind from execution so you can focus on refinement.
The Real Lesson
A trading bot isn’t a shortcut.
It’s a mirror, it reflects your discipline, your rules, and your logic.
If your plan is solid, a bot will make it unstoppable.
If your plan is weak, it’ll just lose money faster.
Automation doesn’t fix bad habits, it exposes them.
So learn the logic, test it hard, then let the system do what humans struggle with most: follow the plan.

XAUUSD (GOLD) – ASIA SESSION ANALYSIS RESULTS4️⃣ High-Probability Trade Scenarios
📉 SELL Setup (Main Bias)
• Entry Zone: 3,955 – 3,964 (Golden Zone)
• Confirmation: 5M/15M bearish engulfing or CHoCH after liquidity sweep.
• TPs: 3,940 → 3,930 → 3,916 → 3,898 → 3,886
• SL: Above 3,976
💡 Rationale: Rejection from fib zone aligns with H1 structure continuation; best risk-reward short setup.

3xplain — Purchasing Power vs Gold, Stocks, Real Estate, BitcoinA visual comparison of U.S. dollar purchasing power versus major real assets since 1971, the year the U.S. ended the gold standard.
The chart tracks inflation-adjusted performance of Gold, Stocks (S&P 500), Real Estate, and Bitcoin, each normalized to 100 in 1971, showing how the dollar has lost value relative to scarce and productive assets.
Sources: FRED (CPIAUCSL, SP500, MSPUS) - OANDA (XAUUSD) - TradingView (INDEX:BTCUSD/BLX)
Visualization by 3xplain.com - Finance, 3x clearer

The Billy Big Balls MomentA trader reached out to me by direct message here on Trading View highlighting a challenge that many of us face from time to time. We’re talking about self sabotage. That moment you know what to do - but do something entirely different and get a result that frustrates the **** out of you.
Follow along, I hope this helps.
BUT FIRST
NOTE – This is a post on mindset and emotion. It’s not a trade idea or strategy designed to make you money. My intention is to help you preserve your capital, focus, and composure so you can trade your own system with calm and confidence.
Here's a scenario you might be familiar with...
You nail a sequence of trades.
Precision. Flow. Everything lines up.
And then something flips.
You start pushing harder, sizing up, breaking your own rules.
A few minutes later, you’re staring at a screen wondering,
“What the hell just happened?”
It’s not lack of discipline nor is it a technical problem.
You have an emotional pattern that hasn’t been mapped out yet.
This pattern has roots into your subconscious and it’s sabotaging your efforts.
WHATS REALLY HAPPENING AND WHERE DOES THE DRIVER REALLY COME FROM
When you start winning, your brain gets flooded with dopamine , the chemical of reward and anticipation.
If your nervous system has ever learned that success leads to loss, losing control, losing safety, losing connection it quietly associates “winning” with risk .
The mind says, “Let’s keep this going.” Deeper down though is the silent warning … “This isn’t safe.”
Doesn’t sound logical right? It’s not. It’s emotional. Deeply embedded in your psyche and activated whenever the mind feels that familiar feeling again.
The mind wants to go forward - the body wants to intervene. And so you get an internal split. A moment of pressure that your mind just has to resolve. And the fastest way the subconscious knows to relieve that pressure… is to end the win.
So you do something impulsive, not because you want to fail,
but because deep down, you're trying to protect yourself or believe or not, you might be even trying to punish yourself.
Weird stuff happens in the subconscious.
That’s why the sabotage happens right after a run of success.
It’s not logic breaking down.
It’s the mind trying to restore an emotional equilibrium.
HOW TO CATCH IT BEFORE IT HAPPENS
Listen. The moment you size up impulsively is not random.
It’s a repeatable signal that your emotional system has been triggered.
You can’t fix what you can’t see - so start tracking it.
1. Notice your signature cue.
For some, it’s tension in the chest or a fidgety feeling of restlessness.
For others, it’s the need to “just check one more chart.”
For you it might be something else. Pay attention and start to become aware of what comes up for you.
2. Map the pattern
Keep a short log : what happens right before you go rogue?
Notice the time of day, physical tension, thoughts.
You are looking for a repeatable sequence.
3. Identify your threshold
There’s always a tipping point where clarity narrows: your breath shortens, attention tunnels or you start fantasising about bigger gains.
That’s your signal.
4. Interrupt the pattern and create a recovery plan (as you notice the cues)
Physically step away from the desk.
Exhale through the mouth long, slow, 6 seconds.
Let your eyes rest on something still . This shifts the nervous system out of fight-or-flight and back into focus.
This isn’t about controlling emotion.
Its about expanding your capacity so emotion doesn't control you.
Next time you’re on a hot streak, notice where focus ends and thrill begins.
That’s the edge that makes or breaks the run.

The Interconnected Role of Banks and Financial Markets1. The Foundation: Banking and Market Structures
At the heart of the financial system lie two major components—banks and financial markets—that collectively mobilize and allocate resources.
Banks are institutions that accept deposits and extend loans, serving as a bridge between surplus and deficit units. They play a key role in transforming short-term deposits into long-term credit—a process known as maturity transformation.
Financial markets, on the other hand, provide direct channels for capital raising. Investors buy securities issued by corporations or governments, thus providing funds without the need for traditional bank intermediation.
While both systems perform similar economic functions—mobilizing savings, facilitating investment, and managing risks—the mechanisms differ. Banks rely on balance-sheet intermediation, whereas markets depend on price mechanisms and investor behavior. Over time, the boundary between them has blurred due to financial innovation, deregulation, and globalization.
2. Complementary Functions in Capital Allocation
Banks and financial markets complement each other in channeling funds to productive sectors.
Banks specialize in relationship-based finance. They lend to small and medium-sized enterprises (SMEs), consumers, and sectors where creditworthiness is difficult to assess using market signals. Through continuous relationships, banks monitor borrowers, reduce information asymmetry, and support long-term projects.
Financial markets excel in allocating large-scale capital efficiently. Public corporations issue shares or bonds to raise funds from a diverse investor base, allowing broader participation and liquidity. Market prices serve as signals that guide resource allocation—firms with strong prospects can attract funds easily, while weaker firms face higher costs.
This complementarity ensures that both traditional lending and market-based finance coexist, offering a diversified funding ecosystem. For instance, in emerging markets, banks often dominate due to limited capital market development. In contrast, in advanced economies like the U.S., markets play a larger role, but banks remain critical in supporting households and smaller firms.
3. Interdependence through Financial Instruments
The interaction between banks and markets is not merely functional—it is structural. Banks are active participants in financial markets as investors, borrowers, and intermediaries.
As investors, banks hold government securities, corporate bonds, and even equities as part of their portfolios. These assets help manage liquidity, meet regulatory requirements, and generate income.
As borrowers, banks raise funds in the interbank and bond markets, issuing certificates of deposit (CDs), commercial papers, or subordinated debt.
As intermediaries, they facilitate client transactions, underwrite securities, and provide market-making services.
The development of securitization—where banks pool loans (like mortgages) and sell them as securities—further integrates banks with capital markets. This process frees up bank capital for new lending but also links their balance sheets to market fluctuations. The 2008 Global Financial Crisis demonstrated how deep this interconnection had become: when market liquidity dried up, banks’ asset values plummeted, and credit supply froze, leading to a systemic collapse.
4. Role in Monetary Policy Transmission
The central bank’s monetary policy relies heavily on the interconnectedness of banks and financial markets. Policy instruments such as interest rates, reserve requirements, and open market operations influence both sectors simultaneously.
Through banks, lower policy rates reduce borrowing costs, encouraging credit expansion. Higher rates, conversely, tighten lending and cool demand.
Through financial markets, interest rate changes impact bond yields, stock valuations, and investor sentiment. A cut in rates typically boosts equity prices and lowers bond yields, improving firms’ ability to raise funds.
The policy transmission mechanism, therefore, operates via both the bank-lending channel and the asset-price channel. If either sector weakens—say, if banks are undercapitalized or markets are illiquid—the effectiveness of monetary policy diminishes. Hence, a well-integrated and stable relationship between banks and markets is essential for maintaining macroeconomic stability.
5. Risk Sharing and Financial Stability
A major benefit of interconnectedness is diversified risk sharing. Financial markets distribute risks among a broad base of investors, while banks absorb and manage credit risks internally.
However, this interlinkage can also amplify vulnerabilities. Banks’ exposure to market risks—interest rate, liquidity, and credit spread risks—means that shocks in markets can directly hit bank balance sheets. For example, a sudden rise in bond yields can devalue banks’ holdings, reducing their capital adequacy. Similarly, a decline in stock or real estate prices can increase default risks among borrowers.
To mitigate such contagion, financial regulators emphasize macroprudential policies, stress testing, and capital buffers. The Basel III framework, for instance, requires banks to maintain higher liquidity and leverage ratios to withstand market shocks. Simultaneously, market regulators enforce disclosure and transparency norms to prevent mispricing of risks.
6. The Shift Toward Market-Based Finance
In recent decades, there has been a structural shift from bank-dominated systems to market-based finance, particularly in advanced economies. The rise of institutional investors—such as pension funds, mutual funds, and insurance companies—has reduced firms’ dependence on bank loans. Securitization and shadow banking have expanded credit creation outside the traditional banking system.
This evolution enhances financial flexibility but also introduces new systemic risks. Market-based institutions are less regulated and more sensitive to investor sentiment. During crises, sudden capital outflows or liquidity shortages can trigger chain reactions that eventually affect banks. Hence, central banks now monitor not only banking indicators but also non-bank financial intermediation (NBFI) activities to assess systemic health.
7. Globalization and Cross-Border Interlinkages
Global financial integration has deepened the ties between banks and markets across borders. International banks operate in multiple jurisdictions, participating in global bond, currency, and derivative markets. Capital flows move rapidly in response to policy changes or market shocks, linking domestic systems to global cycles.
For example, when the U.S. Federal Reserve tightens rates, emerging markets often experience capital outflows, currency depreciation, and tighter liquidity conditions. Banks in these countries face funding pressures, while local bond markets witness volatility. The 1997 Asian Financial Crisis and the 2008 Global Financial Crisis both highlighted how cross-border linkages can transmit shocks worldwide.
This interconnectedness calls for international coordination in financial regulation and crisis management. Institutions such as the IMF, BIS, and FSB play vital roles in promoting stability through policy frameworks and global standards.
8. Digitalization and Financial Innovation
The digital era has redefined how banks and markets interact. Fintech, blockchain, and digital payments have blurred traditional boundaries even further. Banks use algorithmic trading, robo-advisory, and tokenized assets to access markets efficiently. Meanwhile, online platforms offer market-based credit (peer-to-peer lending) that competes with bank loans.
While innovation enhances efficiency and inclusion, it also introduces cybersecurity risks, data privacy concerns, and regulatory challenges. Central banks are exploring Central Bank Digital Currencies (CBDCs) to ensure that digital finance remains integrated with the formal monetary system. The next phase of interconnectedness will likely involve hybrid models—where banks act as gateways to decentralized markets while maintaining regulatory oversight.
9. The Role During Economic Crises
During economic downturns or financial crises, the interdependence of banks and markets becomes most visible. When one system falters, the other provides temporary stability—though sometimes at a cost.
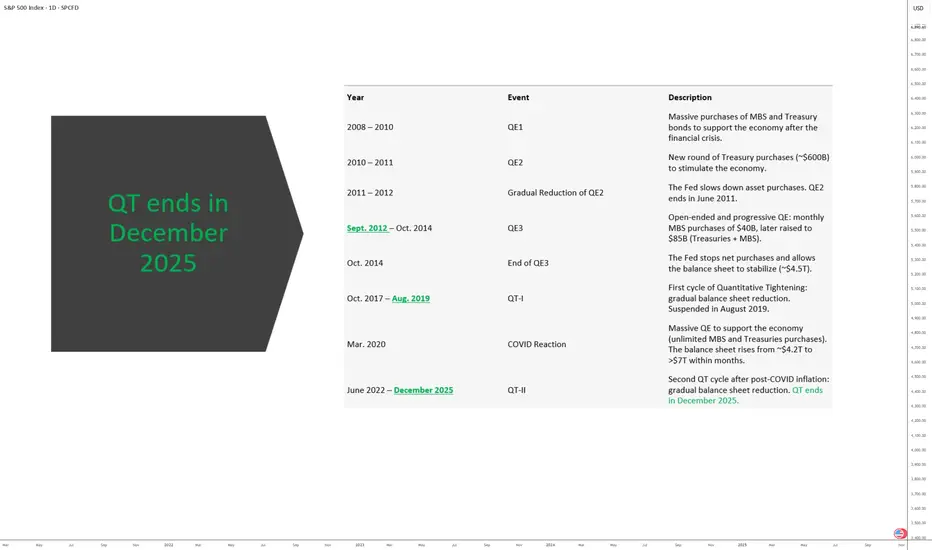
In crises like 2008, central banks injected liquidity into both sectors through quantitative easing (QE)—purchasing bonds and securities to stabilize markets and ensure banks had access to funds.
Conversely, when markets freeze, banks become the primary credit providers, cushioning the economy through lending backed by government guarantees.
The COVID-19 pandemic reaffirmed this relationship. As markets crashed, banks played a stabilizing role by extending credit lines, while policy interventions restored confidence in capital markets. Such coordination ensures the continuity of capital flow and prevents systemic collapse.
10. Emerging Market Perspectives
In emerging economies like India, Brazil, and Indonesia, banks traditionally dominate the financial system due to underdeveloped markets. However, the trend is gradually changing as equity and bond markets expand and retail participation grows.
For instance, in India, the rise of corporate bond markets, mutual funds, and Sovereign Gold Bonds (SGBs) has diversified funding channels. Yet, banks remain central to infrastructure financing and SME lending—areas where markets are less effective. The integration between banks and markets is therefore essential for mobilizing long-term capital, especially for nation-building projects.
Regulatory bodies like the Reserve Bank of India (RBI) and SEBI coordinate to align monetary and market policies, ensuring balance between credit growth and capital market stability.
11. Policy Implications and the Need for Balance
The interconnectedness between banks and markets creates both opportunities and risks. Policymakers must strike a balance between efficiency, innovation, and stability.
Excessive dependence on banks can limit credit diversification and expose economies to concentrated risks.
Overreliance on markets can lead to speculative bubbles and volatility.
Thus, a hybrid financial architecture—where banks and markets complement each other—is most desirable. Regulations should encourage market deepening while ensuring that banks remain well-capitalized and resilient.
Coordinated oversight, robust information systems, and global cooperation are crucial. Transparency in both banking operations and market transactions helps prevent contagion and enhances investor confidence.
12. Conclusion: An Integrated Financial Ecosystem
The relationship between banks and financial markets is not one of competition, but of mutual reinforcement. Together, they form an integrated ecosystem that fuels economic growth, manages risks, and supports innovation. Their interconnection ensures that savings are efficiently transformed into investments, liquidity is maintained across sectors, and monetary policy reaches its intended targets.
As the global economy evolves—driven by technology, globalization, and sustainability—this partnership will become even more intricate. The challenge for regulators, investors, and policymakers is to harness the benefits of this interconnectedness while minimizing systemic vulnerabilities. A stable, transparent, and adaptive financial system—where banks and markets coexist harmoniously—is the cornerstone of a resilient global economy.

Fed Overview: The Good and the Not So GoodDriven by an euphoric phase, the S&P 500 has approached 7,000 points, nearing its 2000 valuation record, with six consecutive months of gains without retracement.
The key question for investors is now clear: has the Federal Reserve provided enough justification for this confidence, or does Jerome Powell’s caution mark the beginning of the end of this euphoric phase?
1) A Fed slowing the pace without complacency
On Wednesday, October 29, the Fed announced another 25-basis-point rate cut, bringing the federal funds rate into the 3.75%–4.00% range. This is the second consecutive reduction, aimed at countering the labor market slowdown.
However, the FOMC vote revealed strong internal divisions: one member wanted a deeper cut, another preferred no change. This reflects the delicate balance between supporting employment and avoiding renewed inflationary pressure.
Another key signal: the Fed decided to pause its balance sheet reduction (quantitative tightening) starting December 1st, in order to preserve financial system liquidity, as credit markets show early signs of stress. Powell clarified that this pause does not imply a lasting return to an expansionary stance.
Finally, Powell cooled expectations for another rate cut in December, stating that “nothing is guaranteed.” Money markets now price roughly a 70% chance of a hold in December, down from nearly 90% odds of a cut before the meeting.
2) Between monetary realism and market excess
The Fed is not ruling out further easing, but it refuses to fuel a bullish rally in the S&P 500 that is now considered excessive relative to fundamentals.
Current valuations rely heavily on expectations of continued rate cuts. If that narrative weakens, the likelihood of a technical correction in the S&P 500 rises.
At this stage, however, the index has not yet signaled a reversal.
DISCLAIMER:
This content is intended for individuals who are familiar with financial markets and instruments and is for information purposes only. The presented idea (including market commentary, market data and observations) is not a work product of any research department of Swissquote or its affiliates. This material is intended to highlight market action and does not constitute investment, legal or tax advice. If you are a retail investor or lack experience in trading complex financial products, it is advisable to seek professional advice from licensed advisor before making any financial decisions.
This content is not intended to manipulate the market or encourage any specific financial behavior.
Swissquote makes no representation or warranty as to the quality, completeness, accuracy, comprehensiveness or non-infringement of such content. The views expressed are those of the consultant and are provided for educational purposes only. Any information provided relating to a product or market should not be construed as recommending an investment strategy or transaction. Past performance is not a guarantee of future results.
Swissquote and its employees and representatives shall in no event be held liable for any damages or losses arising directly or indirectly from decisions made on the basis of this content.
The use of any third-party brands or trademarks is for information only and does not imply endorsement by Swissquote, or that the trademark owner has authorised Swissquote to promote its products or services.
Swissquote is the marketing brand for the activities of Swissquote Bank Ltd (Switzerland) regulated by FINMA, Swissquote Capital Markets Limited regulated by CySEC (Cyprus), Swissquote Bank Europe SA (Luxembourg) regulated by the CSSF, Swissquote Ltd (UK) regulated by the FCA, Swissquote Financial Services (Malta) Ltd regulated by the Malta Financial Services Authority, Swissquote MEA Ltd. (UAE) regulated by the Dubai Financial Services Authority, Swissquote Pte Ltd (Singapore) regulated by the Monetary Authority of Singapore, Swissquote Asia Limited (Hong Kong) licensed by the Hong Kong Securities and Futures Commission (SFC) and Swissquote South Africa (Pty) Ltd supervised by the FSCA.
Products and services of Swissquote are only intended for those permitted to receive them under local law.
All investments carry a degree of risk. The risk of loss in trading or holding financial instruments can be substantial. The value of financial instruments, including but not limited to stocks, bonds, cryptocurrencies, and other assets, can fluctuate both upwards and downwards. There is a significant risk of financial loss when buying, selling, holding, staking, or investing in these instruments. SQBE makes no recommendations regarding any specific investment, transaction, or the use of any particular investment strategy.
CFDs are complex instruments and come with a high risk of losing money rapidly due to leverage. The vast majority of retail client accounts suffer capital losses when trading in CFDs. You should consider whether you understand how CFDs work and whether you can afford to take the high risk of losing your money.
Digital Assets are unregulated in most countries and consumer protection rules may not apply. As highly volatile speculative investments, Digital Assets are not suitable for investors without a high-risk tolerance. Make sure you understand each Digital Asset before you trade.
Cryptocurrencies are not considered legal tender in some jurisdictions and are subject to regulatory uncertainties.
The use of Internet-based systems can involve high risks, including, but not limited to, fraud, cyber-attacks, network and communication failures, as well as identity theft and phishing attacks related to crypto-assets.
Lessons Learned from Past Meltdowns (2008, 2020, etc.)1. The 2008 Financial Crisis: A Wake-Up Call for Systemic Risk
The 2008 Global Financial Crisis (GFC) was triggered by the collapse of the U.S. housing bubble, excessive leverage in financial institutions, and the widespread use of complex derivatives such as mortgage-backed securities (MBS) and collateralized debt obligations (CDOs). When Lehman Brothers filed for bankruptcy in September 2008, panic spread globally. The crisis led to trillions in lost wealth, millions of job losses, and the deepest recession since the Great Depression.
Key Lessons from 2008:
a. Importance of Transparency and Regulation:
The 2008 crisis revealed how opaque financial products and inadequate oversight can destabilize the entire financial ecosystem. Banks took excessive risks without sufficient capital buffers, while rating agencies failed to assess true risk levels. Post-crisis reforms, such as Basel III norms, Dodd-Frank Act, and stress testing frameworks, were introduced to improve capital adequacy, liquidity, and accountability.
b. Systemic Risk Can Spread Rapidly:
The interconnection of global banks turned what began as a housing market issue into a worldwide meltdown. The concept of “too big to fail” became central to financial discourse. The lesson: monitoring systemic risk is as important as regulating individual institutions. Financial contagion can cross borders instantly, necessitating global cooperation among central banks and regulators.
c. Moral Hazard and Bailouts:
Massive government bailouts (e.g., TARP in the U.S.) saved the system but raised questions about moral hazard—whether saving reckless institutions encourages future risk-taking. The lesson was clear: regulation should prevent risk-taking before it requires taxpayer-funded rescues.
d. The Role of Monetary Policy:
Central banks realized their power and limitations. The U.S. Federal Reserve’s near-zero interest rate policy and quantitative easing (QE) became critical tools to stabilize markets. However, these also laid the groundwork for future inflationary pressures and asset bubbles. Lesson: monetary easing is effective but must be balanced with fiscal prudence and structural reforms.
e. Behavioral Economics Matters:
Investor psychology—greed during booms and fear during crashes—played a decisive role. Overconfidence, herd behavior, and the illusion of endless housing price appreciation fueled the bubble. Behavioral finance emerged as a crucial field for understanding and mitigating irrational market behavior.
2. The 2020 Pandemic Crash: A Crisis Like No Other
Unlike 2008, which was a financial crisis rooted in excess and mismanagement, the 2020 crash was a health crisis turned economic catastrophe. When COVID-19 spread globally in early 2020, lockdowns halted production, trade, and travel, triggering a sudden and sharp global recession. Stock markets collapsed, oil prices turned negative, and unemployment soared. Yet, recovery was surprisingly swift—thanks to unprecedented fiscal and monetary interventions.
Key Lessons from 2020:
a. Speed and Scale of Policy Response Matter:
Governments and central banks acted far faster in 2020 than in 2008. The U.S. Federal Reserve slashed rates to zero within weeks and launched unlimited QE, while fiscal packages like the CARES Act pumped trillions into the economy. Similarly, India announced the Atmanirbhar Bharat stimulus. The lesson: speed and magnitude of support can prevent temporary shocks from becoming long-term depressions.
b. Technology as an Economic Lifeline:
The digital economy emerged as a savior. Remote work, e-commerce, fintech, and cloud computing allowed many sectors to survive and even thrive. The pandemic accelerated the digital transformation of business and finance, leading to greater adoption of digital payments, virtual collaboration, and online education. Lesson: digital infrastructure is not optional—it is a core pillar of economic resilience.
c. The Fragility of Global Supply Chains:
The shutdown of manufacturing hubs in China and other countries exposed how deeply global supply chains were interconnected and vulnerable. The shortage of semiconductors, medical supplies, and essential goods highlighted the risk of over-dependence on a few suppliers. Lesson: economies must build supply chain diversification and strategic self-reliance.
d. Inequality and Social Resilience:
The pandemic widened existing inequalities. While asset prices recovered quickly, millions of small businesses and low-income workers faced lasting damage. Lesson: inclusive recovery must be prioritized; safety nets and targeted fiscal support are crucial for societal stability.
e. Investor Behavior and Market Resilience:
The 2020 crash also showcased how investor psychology had evolved. Retail investors, aided by trading apps and social media, became a dominant force. Markets rebounded sharply, partly due to liquidity and optimism about vaccines and technology. Lesson: information flow, sentiment, and social media can now move markets faster than ever.
3. Common Threads Between 2008 and 2020
Though different in origin, both crises shared key characteristics that reveal the vulnerabilities of modern capitalism.
a. Interconnected Global Systems:
Both crises demonstrated how local shocks quickly became global due to financial, trade, and psychological linkages. Whether it was mortgage-backed securities in 2008 or supply chain disruptions in 2020, the globalized economy magnifies contagion. The lesson: resilience depends on diversification—not isolation.
b. Central Bank Dominance:
In both crises, central banks played an unprecedented role. The Federal Reserve, European Central Bank, and others became the “market backstop.” Their actions stabilized confidence but also increased dependence on monetary intervention. This dependence raises long-term concerns about asset bubbles and debt sustainability.
c. The Importance of Communication and Trust:
Both meltdowns showed that trust is the ultimate currency in a crisis. When financial institutions, governments, or investors lose confidence, panic sets in faster than any policy can react. Transparent communication by policymakers can anchor expectations and prevent spirals of fear.
d. Innovation Follows Crisis:
Both periods triggered innovation. After 2008, fintech and blockchain rose from the ashes of mistrust in traditional banks. After 2020, remote work tech, digital health, and AI-driven analytics became mainstream. History proves: crises often accelerate technological and structural evolution.
4. Lessons for Policymakers
a. Build Buffer Capital and Fiscal Space:
Governments and banks must maintain sufficient reserves for emergencies. High fiscal deficits and excessive leverage before a crisis reduce the ability to respond later. Prudent fiscal management and healthy capital ratios are essential for resilience.
b. Develop Counter-Cyclical Tools:
Automatic stabilizers—such as unemployment benefits and targeted stimulus—can cushion economic shocks. Regulators must enforce counter-cyclical lending and investment practices to prevent overheating during booms.
c. Strengthen Global Coordination:
Global problems require global responses. The 2008 and 2020 crises both highlighted how coordination among G20 nations, IMF, and World Bank was vital. Shared frameworks for debt relief, liquidity swaps, and vaccine distribution illustrate the power of cooperation.
d. Invest in Data and Predictive Systems:
Early warning systems using AI and real-time data could help detect vulnerabilities before they escalate. Governments and financial regulators must embrace data-driven policy frameworks for crisis prevention.
5. Lessons for Financial Institutions
a. Risk Management Must Be Dynamic:
Traditional models failed to predict both crises. Stress testing must account for low-probability, high-impact events like pandemics or geopolitical disruptions. Banks must integrate climate risk, cyber risk, and behavioral risk into their frameworks.
b. Liquidity Is King:
Both meltdowns reinforced that liquidity dries up first in a panic. Institutions must maintain adequate short-term funding buffers. Central banks’ liquidity facilities are a lifeline, but dependence should be reduced through prudent planning.
c. ESG and Sustainable Finance:
The 2020 crisis emphasized environmental and social resilience. Firms with strong ESG principles fared better, reflecting investor preference for sustainability. Lesson: ethics and responsibility are now financial imperatives, not optional ideals.
6. Lessons for Investors
a. Stay Rational Amid Panic:
The biggest losses occur when investors react emotionally. Those who stayed invested or bought during the 2020 crash witnessed record recoveries. Lesson: time in the market often beats timing the market.
b. Diversification Works:
Diversified portfolios—across asset classes, sectors, and geographies—performed better in both crises. Lesson: never rely solely on one market or theme.
c. Long-Term Vision Pays Off:
Both crises produced winners—innovative companies that adapted early. Investors who focused on fundamentals and long-term growth stories reaped massive returns. Lesson: focus on quality, adaptability, and innovation.
7. Structural Shifts Triggered by Crises
a. Rise of Alternative Finance:
Post-2008, distrust in banks led to the growth of fintech, crypto assets, and decentralized finance (DeFi). These innovations democratized finance but also created new regulatory challenges.
b. Work and Consumption Redefined:
After 2020, remote work, digital payments, and online services became embedded in everyday life. Businesses now prioritize resilience over efficiency—shifting from “just-in-time” to “just-in-case” models.
c. Inflation and Monetary Reckoning:
Massive stimulus in 2020 eventually fueled inflationary pressures by 2022–23. This underscored that liquidity without productivity creates long-term imbalances. Lesson: monetary expansion must be matched with real economic output.
8. Preparing for the Next Crisis
While we can’t predict the next meltdown, we can prepare for it. Future shocks might stem from climate change, AI-driven job disruptions, or cyber warfare. The lessons from 2008 and 2020 teach us that flexibility, coordination, and foresight are the best defenses.
Anticipate the Unthinkable: Stress testing and scenario modeling must include black swan events.
Prioritize Human Capital: Education, healthcare, and social safety nets ensure societies rebound faster.
Embrace Sustainable Growth: Over-leverage and short-term gains always backfire.
Enhance Financial Literacy: Empowering individuals to understand risk and debt reduces systemic vulnerability.
Conclusion
The crises of 2008 and 2020 were vastly different in origin—one financial, the other biological—but they shared a common truth: economic systems are only as strong as the trust, transparency, and adaptability they embody. The lessons learned from these meltdowns go beyond economics—they speak to governance, ethics, and collective responsibility.
In both cases, the world witnessed immense pain but also extraordinary recovery and innovation. As we move deeper into an era of digital finance, geopolitical shifts, and environmental challenges, these lessons form the blueprint for building a resilient, equitable, and sustainable global economy—one that learns from its scars and grows stronger after every crisis.
Blockchain’s Role in Different Trading Segments1. Introduction: Redefining Trust in the Trading World
The modern trading ecosystem — spanning financial markets, commodities, forex, and digital assets — relies heavily on trust, transparency, and speed. For decades, intermediaries such as brokers, clearing houses, and central depositories have played a vital role in ensuring smooth settlements and recordkeeping. However, this system is often plagued by inefficiencies, high transaction costs, and occasional lapses in security or accountability.
Enter blockchain technology — a decentralized ledger system that offers immutable, transparent, and secure recordkeeping. By eliminating the need for traditional intermediaries, blockchain has the potential to revolutionize how trades are executed, verified, and settled across different segments of the global financial market.
Blockchain’s role in trading is not confined to cryptocurrencies. Its applications now extend to stock markets, commodity exchanges, forex trading, derivatives, and even carbon credit and energy trading. Each of these sectors can benefit from blockchain’s ability to automate trust and reduce systemic inefficiencies.
2. Understanding Blockchain in the Context of Trading
At its core, blockchain is a distributed database shared among a network of participants. Once data — such as trade details or payment confirmations — is recorded on the blockchain, it cannot be altered without the consensus of the network. This ensures that all trading participants operate from a single, verified source of truth.
In trading terms:
Each transaction (buy or sell order) is a “block.”
These transactions are chained together chronologically.
The system is decentralized, meaning no single entity can manipulate data.
This architecture has far-reaching implications for global markets:
Instant settlements instead of multi-day clearing cycles.
Elimination of counterparty risk, as smart contracts execute automatically.
Lower transaction costs due to reduced intermediary dependence.
Enhanced auditability, since all data is time-stamped and verifiable.
3. Blockchain in Stock Market Trading
The traditional equity trading system involves multiple intermediaries — brokers, stock exchanges, clearing corporations, and custodians — all performing specific functions such as matching orders, confirming trades, and settling securities. While effective, this system is slow and costly.
How Blockchain Transforms Stock Trading
Real-Time Settlement: Blockchain can reduce the settlement period from the current T+2 (trade date plus two days) to near-instantaneous settlement (T+0). This significantly reduces liquidity risk and capital lock-in.
Tokenization of Assets: Shares can be represented as digital tokens on a blockchain. This enables fractional ownership, making high-value stocks accessible to smaller investors.
Decentralized Exchange Platforms: Decentralized stock trading platforms can facilitate peer-to-peer transactions without intermediaries, ensuring transparency and reducing costs.
Immutable Recordkeeping: Corporate actions such as dividends, bonus issues, and stock splits can be recorded permanently and automatically distributed using smart contracts.
Examples
Nasdaq Linq: One of the early adopters of blockchain, Nasdaq used the Linq platform to record private securities transactions, demonstrating efficiency and transparency.
India’s NSE pilot programs: The National Stock Exchange of India has experimented with blockchain for know-your-customer (KYC) data and settlement tracking.
4. Blockchain in Forex (Foreign Exchange) Trading
The foreign exchange market is the world’s largest financial market, with daily volumes exceeding $7 trillion. Yet, it remains fragmented, opaque, and reliant on central intermediaries like banks and payment processors.
Blockchain’s Advantages in Forex
Cross-Border Settlement: Blockchain enables direct peer-to-peer currency exchange without intermediaries, drastically cutting transfer times and fees.
Transparency and Auditability: All trades recorded on a blockchain are verifiable, reducing manipulation and fraud risks.
Smart Contracts for FX Swaps: Automated execution of forex swaps and forward contracts ensures minimal counterparty risk.
24/7 Accessibility: Unlike traditional systems, blockchain-based FX networks can operate continuously without downtime.
Example
RippleNet and Stellar Lumens use blockchain to enable instant cross-border currency transfers with minimal costs, challenging the dominance of SWIFT.
5. Blockchain in Commodity Trading
Commodity trading — involving oil, metals, and agricultural goods — often suffers from documentation delays, supply chain opacity, and settlement inefficiencies. Blockchain brings trust and traceability to this sector.
Applications
Smart Contracts for Trade Settlement: Automatically execute trades once contractual conditions are met (e.g., delivery confirmation triggers payment).
Supply Chain Transparency: Blockchain can trace commodities from extraction or production to final sale, ensuring authenticity and sustainability.
Tokenization of Commodities: Commodities like gold, crude oil, or carbon credits can be represented digitally, making them easier to trade and fractionalize.
Reduction in Paperwork: Blockchain eliminates the need for multiple physical documents like bills of lading, inspection certificates, and letters of credit.
Example
Vakt, a blockchain-based platform supported by BP and Shell, digitizes the post-trade processes in oil markets, improving efficiency and reducing fraud.
6. Blockchain in Derivatives and Futures Markets
Derivatives — including futures, options, and swaps — are complex instruments often involving multiple intermediaries. Blockchain’s smart contracts can automate these trades and settlements with precision.
Benefits
Instantaneous Settlement: Reduces the time gap between contract execution and settlement, minimizing counterparty and liquidity risks.
Automated Margin Calls: Smart contracts can automatically adjust margin requirements based on real-time price movements.
Transparency: Blockchain’s shared ledger ensures all participants view the same data, reducing disputes.
Regulatory Compliance: Blockchain enables real-time reporting to regulators, improving oversight.
Example
DTCC (Depository Trust & Clearing Corporation), which handles trillions in derivatives, has explored blockchain for trade reporting and settlement to enhance efficiency.
7. Blockchain in Cryptocurrency Trading
Cryptocurrency trading is the first and most obvious area where blockchain has already established dominance. Cryptos like Bitcoin and Ethereum are themselves blockchain-native assets, and their trading happens entirely on blockchain-based exchanges.
Innovations
Decentralized Exchanges (DEXs): Platforms like Uniswap and PancakeSwap allow traders to exchange tokens directly from their wallets without intermediaries.
Liquidity Pools: Smart contracts automatically match buyers and sellers, ensuring market liquidity.
Transparency and Security: Every trade is publicly recorded on the blockchain, ensuring full auditability.
Challenges
High volatility, lack of regulation, and scalability limitations still pose obstacles to mainstream adoption.
8. Blockchain in Energy and Carbon Credit Trading
The rise of sustainability-focused finance has introduced new markets like carbon credits and renewable energy certificates. Blockchain ensures authenticity and prevents double-counting in these emerging asset classes.
Applications
Tokenized Energy Certificates: Renewable energy output (solar, wind, hydro) can be tokenized and traded on blockchain platforms.
Carbon Credit Trading: Blockchain ensures each credit is unique, traceable, and not resold multiple times.
Peer-to-Peer Energy Trading: Consumers with solar panels can directly sell surplus energy to others through blockchain-enabled microgrids.
Example
Power Ledger (Australia) uses blockchain to enable P2P renewable energy trading, giving consumers control over energy distribution and pricing.
9. Blockchain in Real Estate and Asset Tokenization
Although not traditionally viewed as a “trading” sector, real estate is rapidly evolving into a digital trading marketplace through blockchain tokenization.
Benefits
Fractional Ownership: High-value properties can be divided into digital tokens, allowing small investors to participate.
Instant Liquidity: Instead of lengthy paperwork, property tokens can be traded instantly on secondary markets.
Transparency and Authenticity: Land titles and ownership histories recorded on blockchain reduce fraud.
Example
Platforms like RealT and Propy are pioneering blockchain-based real estate trading with tokenized assets.
10. Blockchain’s Role in Regulatory Compliance and Risk Management
Beyond execution and settlement, blockchain plays a crucial role in compliance, auditing, and risk management.
Regulatory Advantages
Real-Time Monitoring: Regulators can access immutable records of trades in real-time.
KYC/AML Integration: Blockchain-based identity systems simplify customer verification while maintaining data privacy.
Reduced Fraud and Errors: Tamper-proof records and automated reconciliations enhance overall market integrity.
Example
The European Securities and Markets Authority (ESMA) has studied blockchain-based trade reporting to enhance transparency across the EU markets.
11. Challenges and Limitations
Despite its immense potential, blockchain adoption in trading faces practical and regulatory hurdles:
Scalability Issues: Large exchanges process millions of transactions daily; most blockchains still struggle with high throughput.
Regulatory Uncertainty: Many governments have yet to create clear frameworks for blockchain-based trading systems.
Integration Complexity: Legacy financial infrastructure is deeply entrenched, making transition costly and time-consuming.
Privacy Concerns: While transparency is valuable, full data visibility may conflict with confidentiality requirements in institutional trading.
Energy Consumption: Proof-of-work systems like Bitcoin consume significant power, though newer consensus models (e.g., proof-of-stake) are more efficient.
12. The Future of Blockchain in Global Trading
As the technology matures, blockchain is expected to become the backbone of next-generation trading infrastructure. The future may see:
Fully tokenized stock exchanges, where equities, bonds, and derivatives exist as digital assets.
Interoperable blockchains, allowing seamless transfers between different networks and asset classes.
AI and blockchain integration, combining data-driven trading strategies with transparent execution.
Central Bank Digital Currencies (CBDCs) simplifying settlement between global financial institutions.
The convergence of blockchain, AI, and IoT will lead to hyper-efficient, transparent, and inclusive trading ecosystems — reshaping how capital, commodities, and data flow across borders.
13. Conclusion
Blockchain’s entry into the trading world represents a paradigm shift — from trust-based intermediaries to trustless digital verification. Whether in stock markets, forex, commodities, or emerging asset classes like carbon credits, blockchain introduces unmatched levels of transparency, efficiency, and inclusiveness.
While challenges persist, the direction is clear: blockchain is not just a supporting technology; it is the new foundation of global trading architecture. The world’s markets are moving steadily toward an era where every trade, every asset, and every participant is digitally connected in a decentralized, verifiable, and borderless network of trust.
Why the Eurodollar Market Became a Financial HavenIntroduction
The Eurodollar market stands as one of the most significant and transformative developments in modern finance. Despite its name, the term “Eurodollar” has little to do with Europe as a continent or the euro as a currency. Instead, it refers to U.S. dollar-denominated deposits held in banks outside the United States, particularly in Europe during its early days. What began as a niche market in the post-World War II era gradually evolved into a global financial haven—an offshore ecosystem of liquidity, flexibility, and innovation that reshaped international finance.
Understanding why the Eurodollar market became a financial haven requires examining the historical context, regulatory framework, and the incentives driving global capital flows. It was not merely a byproduct of globalization; it was the very foundation that allowed global finance to operate efficiently across borders, free from the constraints of national monetary policies.
1. Origins of the Eurodollar Market
The roots of the Eurodollar market trace back to the late 1940s and 1950s, when geopolitical tensions and economic transformations began reshaping the financial landscape. After World War II, the United States emerged as the world’s dominant economic power, with the U.S. dollar becoming the global reserve currency under the Bretton Woods system.
During this time, many foreign banks and corporations began holding dollar deposits outside the United States, particularly in European banks. One of the first major holders of such deposits was the Soviet Union, which sought to protect its dollar holdings from potential U.S. sanctions during the Cold War. By placing dollars in European banks, the Soviets could still conduct trade and financial transactions in dollars—without the risk of U.S. authorities freezing their assets.
As European economies rebuilt under the Marshall Plan, dollar-based trade expanded rapidly. European banks found themselves flush with dollar deposits, which they began lending out to other international borrowers. This marked the birth of the Eurodollar market—a decentralized, unregulated offshore market for U.S. dollars.
2. Regulatory Arbitrage: The Core Catalyst
The Eurodollar market thrived largely because it existed outside U.S. regulatory jurisdiction. Domestic banks in the United States faced strict regulations under the Federal Reserve System, including reserve requirements and interest rate ceilings imposed by Regulation Q. These restrictions limited how much interest U.S. banks could pay on deposits and constrained their lending flexibility.
In contrast, offshore banks—mainly in London—were not subject to U.S. banking regulations. This regulatory arbitrage created a competitive advantage: Eurodollar deposits could offer higher interest rates, and Eurodollar loans could be made more flexibly and at lower costs.
Borrowers and depositors around the world quickly recognized the benefits. Multinational corporations preferred Eurodollar loans for their international operations, and investors sought Eurodollar deposits for better yields. The absence of reserve requirements meant that Eurobanks could leverage their funds more aggressively, enhancing liquidity in the market.
This unregulated freedom made the Eurodollar system an ideal haven—a place where capital could move freely, unencumbered by the constraints of national borders and domestic monetary policies.
3. The London Advantage: The World’s Financial Hub
London’s role as the birthplace and hub of the Eurodollar market was no coincidence. The city had centuries of experience as a global financial center, connecting Europe, America, and the Commonwealth. By the 1950s, the British government encouraged offshore banking activity to boost its post-war economy and maintain London’s global relevance.
The Bank of England adopted a hands-off approach toward Eurodollar transactions, seeing them as foreign currency operations that did not affect domestic monetary stability. This permissive environment, combined with London’s strategic time zone (bridging Asia and America), created a perfect breeding ground for 24-hour international finance.
As a result, London became the nerve center of global dollar liquidity, with Eurodollar deposits circulating seamlessly between Europe, Asia, and the Americas. By the 1970s, Eurodollar markets had become the cornerstone of global finance—fueling trade, investment, and speculation on an unprecedented scale.
4. The Rise of Global Liquidity and Flexibility
The Eurodollar market’s greatest strength was its ability to provide liquidity when and where it was needed most. Unlike domestic banking systems, which were often constrained by national policies and reserve rules, Eurobanks operated in a borderless environment.
Corporations used Eurodollar loans to fund trade, mergers, and acquisitions, while central banks and sovereign wealth funds used Eurodollar deposits as a store of value. The market also became a vital source of funding for governments, especially developing nations seeking to borrow in dollars without going through the tightly regulated U.S. market.
By the late 1960s, the Eurodollar market had grown into a massive pool of offshore liquidity. When the Bretton Woods system collapsed in 1971 and exchange rates began to float, the Eurodollar market became even more essential. It offered a global mechanism for hedging, borrowing, and investing across currencies—laying the foundation for today’s interconnected financial system.
5. Freedom from Monetary Control
Another key reason the Eurodollar market became a financial haven lies in its freedom from central bank control. In the U.S., the Federal Reserve could regulate domestic money supply, influence interest rates, and impose capital controls. However, it had little jurisdiction over offshore dollar transactions.
This meant that even when the Fed tightened domestic credit conditions, international borrowers could still access dollar liquidity through Eurobanks. In essence, the Eurodollar market allowed global finance to operate independently of U.S. monetary policy.
This autonomy had far-reaching implications. It weakened the effectiveness of national monetary controls and allowed financial institutions to bypass domestic credit restrictions. The result was a truly globalized money market—one that operated beyond the reach of any single government, creating a self-sustaining ecosystem of private credit creation.
6. Innovation and Market Instruments
The Eurodollar market also became a laboratory for financial innovation. As competition intensified, banks developed new instruments to manage risk and enhance returns. These included floating-rate loans, syndicated lending, and short-term Eurodollar certificates of deposit.
The introduction of the London Interbank Offered Rate (LIBOR) in the 1960s provided a standardized benchmark for pricing Eurodollar loans. LIBOR quickly became the most important reference rate in global finance, underpinning trillions of dollars in loans, derivatives, and securities.
These innovations transformed the Eurodollar market into a complex web of interbank relationships and credit channels. It was not just a deposit market—it was a full-fledged financial system operating parallel to, but distinct from, domestic banking systems.
7. Safe Haven for Capital and Sovereigns
For many investors and nations, the Eurodollar market became a safe haven for several reasons:
Currency Stability: The U.S. dollar was (and remains) the world’s most trusted currency. Holding dollar assets offshore allowed investors to preserve value even when local currencies faced inflation or devaluation.
Confidentiality: Offshore banking jurisdictions often offered privacy and discretion, making them attractive to corporations, governments, and wealthy individuals seeking to protect their assets from political risks.
Political Neutrality: During the Cold War and beyond, the Eurodollar market offered a politically neutral ground for transactions between entities that might not otherwise cooperate through U.S.-regulated channels.
Diversification: Holding Eurodollar assets provided global investors with diversification away from domestic financial risks.
These features reinforced the Eurodollar market’s reputation as a financial sanctuary, a place where money could flow freely and securely amid global uncertainty.
8. The Eurodollar Market and Global Financial Power
Over time, the Eurodollar system reshaped the balance of financial power. It gave rise to massive offshore banking networks, enabled shadow banking, and facilitated the globalization of credit.
By the 1980s and 1990s, Eurodollar deposits had become an integral part of international capital markets. They funded corporate expansions, sovereign debt issuance, and speculative investments across continents. Even today, a significant portion of the world’s dollar liquidity exists outside U.S. borders—testament to the enduring legacy of the Eurodollar market.
In essence, the Eurodollar market made the U.S. dollar truly global—not just a national currency, but the lifeblood of international finance. Ironically, while it strengthened the dollar’s dominance, it simultaneously limited America’s ability to control its own currency’s global circulation.
9. Challenges and Risks
While the Eurodollar market offered flexibility and freedom, it also introduced new risks. The absence of regulation meant there was no lender of last resort for Eurobanks. During periods of financial stress, such as the 2008 Global Financial Crisis, the shortage of dollar liquidity in offshore markets amplified global instability.
Moreover, the market’s opacity made it difficult for regulators to monitor systemic risk. Interbank exposures, derivative linkages, and maturity mismatches often went undetected until crises struck. Despite these challenges, the Eurodollar market’s scale and interconnectedness made it impossible to dismantle—it had become too central to the functioning of global finance.
10. The Modern Eurodollar Landscape
Today, the Eurodollar market continues to play a vital role, even as financial technology and regulations evolve. Although LIBOR is being phased out and replaced by alternative benchmarks like SOFR (Secured Overnight Financing Rate), the fundamental dynamics of offshore dollar liquidity remain intact.
From Asian financial hubs like Singapore and Hong Kong to Middle Eastern centers like Dubai, the Eurodollar spirit lives on through global dollar lending and deposit activities. The rise of digital finance and offshore capital markets further extends the reach of the Eurodollar ecosystem—making it an indispensable pillar of the global financial architecture.
Conclusion
The Eurodollar market became a financial haven because it embodied freedom, efficiency, and trust in a world increasingly shaped by regulation and geopolitics. Its unregulated origins offered participants higher yields and greater flexibility, while its global reach turned the U.S. dollar into a universal instrument of trade, investment, and security.
From Cold War strategies to modern financial globalization, the Eurodollar market represents more than just offshore banking—it represents the world’s pursuit of monetary independence beyond political borders.
Even in the 21st century, the Eurodollar system remains the invisible backbone of global liquidity, silently powering international finance. It is both a sanctuary for capital and a mirror of our interconnected economic reality—a financial haven born from innovation, trust, and the unstoppable flow of money across nations.

Trading is the Game of ProbabilitiesMost traders start with one simple goal ➜ to be right all the time
🔲Right about the trend.
🔲Right about the breakout.
🔲Right about the trade.
But here’s the truth - 'the market doesn’t care who’s right'.
↳ Even the best analysis fails sometimes.
↳ Even the weakest setup works sometimes.
Because trading isn’t a test of accuracy, it’s a test of managing what is more probable.
↳ Profitable traders don’t chase perfection.
↳ They focus on risk, reward, and consistency.
We can be wrong 6 times out of 10...
And still make money if our winners are bigger than our losers.
↳ Trading success is not about predicting.
↳ It’s about positioning and managing our trade.
We manage risk when the odds are low.
We maximize reward when the odds are high.
The shift happens when we stop trying to be right...
and start thinking in probabilities.
That’s when we stop gambling and start profitable trading.
Are you playing casino or managing your risk?
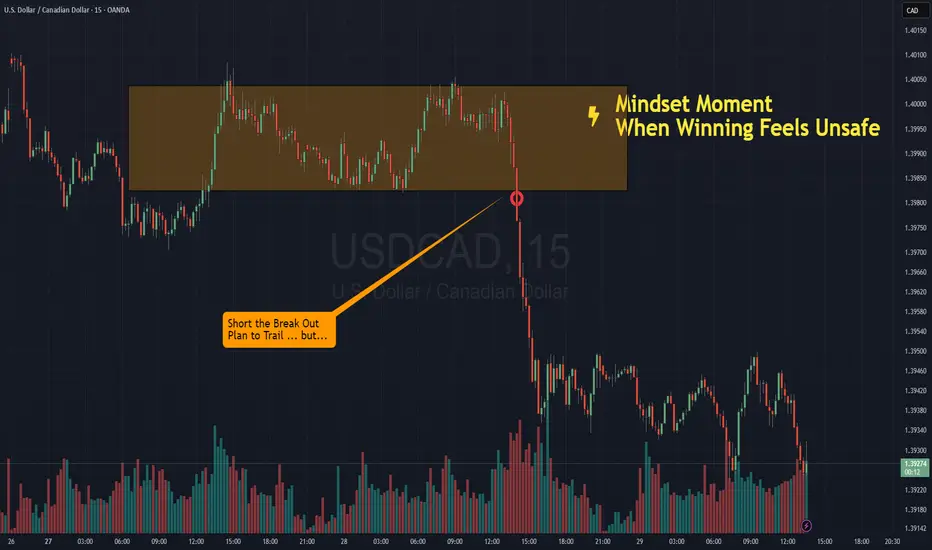
When Winning Feels UnsafeNOTE – This is a post on mindset and emotion. It is not a trade idea or strategy designed to make you money. My intention is to help you preserve your capital, focus, and composure so you can trade your own system with calm and confidence.
You’re in profit.
The trade’s working.
Your system’s doing exactly what it should.
But instead of ease, something tightens.
A flicker of doubt.
You can hear that inner voice: “Don’t mess this up. You wouldn’t want to give this back now would you? How much is enough anyway?”
You scan the chart again.
Check your unrealized PnL.
Move the stop closer.
Start managing… what doesn’t need managing.
Here’s what’s really happening:
Your subconscious is remembering what happened the last time you saw success…
The time you relaxed and it reversed.
The time you felt proud and someone cut you down.
The time you won and it didn’t last.
So even when the market moves in your favour, part of you braces.
Waiting for the other shoe to drop.
So that voice saying, don’t mess this up - is actually a memory trying to protect you.
And in so doing, never really lets you feel safe
The point here is that your work as a trader is to be in the here and now. Not in the past.
Be cognisant to the cues of your memory and body that don’t work in your favour.
So when you notice tension rising,
Take one slow breath. Feel your feet on the floor. And repeat. ‘Right here, right now’.
And then …
Follow your trade plan.
Stay true to your trading plan.
Manage your risk
And let the market do what it does.
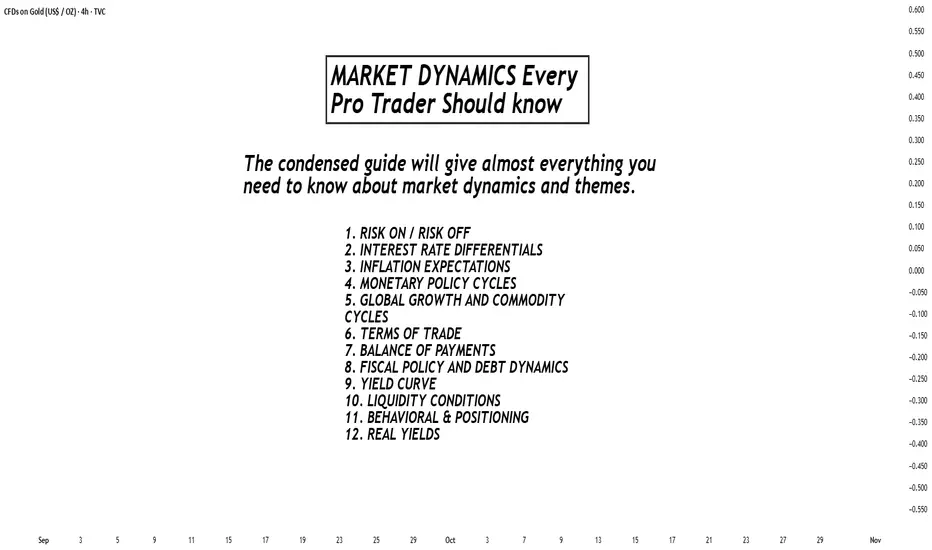
Markets Dynamics Every Pro Trader Should KnowMarkets move based on fundamental forces that shape pro traders behavior, capital flows, and asset valuations. I will cover the most important concepts that drive market behavior across all asset classes and are fundamental to professional traders.
RISK-ON / RISK-OFF DYNAMICS
The most important concept is the oscillation between risk-on and risk-off sentiment—investor willingness to take on risk in pursuit of returns.
Risk-On: Equities, commodities, high-yield bonds, and risk-sensitive currencies like AUD, NZD rise.
Typical triggers are: positive economic data, easy central bank policies, geopolitical stability.
Risk-Off: Safe-haven assets : USD, JPY, CHF, U.S. Treasuries, gold strengthen. This happens as money managers and investors prioritize capital preservation.
Typical triggers: negative economic data, geopolitical tensions, financial crises.
Why USD strengthens during risk-off:
USD has a global reserve currency status, and that structurally creates demand; deepest treasury market for holding capital; trillions in global debt denominated in USD.
Why JPY strengthens during risk-off:
Carry trade unwinding (investors close positions by buying back yen); Japanese institutions bring back home trillions in foreign assets during crises.
INTEREST RATE DIFFERENTIALS
Capital moves toward countries offering higher real interest rates (real rates = nominal rates minus inflation). This creates currency trends over weeks, months, and years.
Higher interest rates leads to higher bond yields, increasing capital inflows, resulting in currency appreciates
The Carry Trade: Borrow in low-yield currencies (JPY, CHF), invest in high-yield currencies (AUD, NZD), profit from interest rate differential. Carry trades unwind strongly during risk-off times due to leverage and crowded positioning.
INFLATION EXPECTATIONS
Markets trade based on where they expect inflation to be in the future, not current readings. Rising inflation expectations means central banks are likely to tighten policy, hence Bond yields rise and that may lead to currency strengthening initially.
Key metrics: CPI (Consumer Price Index), PCE, core vs. headline inflation, break-even inflation from TIPS spreads.
MONETARY POLICY CYCLES
Central banks are the most powerful players in financial markets. They control interest rates and balance sheet operations.
Tightening Cycle (hiking rates, quantitative tightening): Strengthens currency, negative for equities, bond prices fall, slows economic activity.
Easing Cycle (cutting rates, QE): Weakens currency, positive for equities, bond prices rise, stimulates economic activity.
GLOBAL GROWTH AND COMMODITY CYCLES
Strong global growth means higher demand for energy/metals = Commodity prices rise = Strengthens commodity currencies (AUD, CAD, NOK, BRL).
Key indicators to watch: Global PMIs, global trade data, commodity indices, China growth indicators.
TERMS OF TRADE
When a country's export prices rise more than its import prices, local income increases and currency typically strengthens. Example: Australia's AUD strengthens when iron ore and coal prices rise.
BALANCE OF PAYMENTS
Current account measures trade balance, income flows, and transfers.
Surplus (exports > imports): This accumulates foreign reserves, and generally supports currency.
Deficit (imports > exports): This requires capital inflows to fund deficit, and can pressure currency lower.
FISCAL POLICY AND DEBT DYNAMICS
Government spending and taxation are another dynamic that can influence economic growth and inflation.
Expansionary Policy: Higher spending or lower taxes = short-term growth boost = can increase inflation = increases deficit.
Contractionary Policy: Lower spending or higher taxes (this is know as “austerity”) = slows growth =reduces inflation = improves budget balance.
YIELD CURVE
One of the most important dynamics: it plots interest rates of government bonds across different maturities (2-year, 10-year, 30-year).
Normal/Steep Curve: Growth and inflation optimism, typically supports risk-on sentiment.
Flat Curve: Uncertainty about future growth, usually in late-cycle economies.
Inverted Curve (short rates > long rates): Recession warning. markets expect the central bank to cut rates due to the slowing economy. The inverted curve has preceded almost every U.S. recession in the past half decade.
LIQUIDITY CONDITIONS
Liquidity means availability of credit in the financial system.
High Liquidity: Credit is easy and cheap, supports asset prices, enhances risk appetite. Sources of ample liquidity are central bank QE, low interest rates.
Tight liquidity: Credit becomes scarce and expensive, forces deleveraging, triggers risk-off sentiment. Reasons that can lead to low liquidity are central bank QT, rising rates, banking stress.
BEHAVIORAL & POSITIONING DYNAMICS
When too many investors are positioned the same way (crowded trade), small sentiment changes can trigger strong reversals. Extreme bullishness can signal sell opportunities when everyone is fully invested. Extreme bearishness can signal buy opportunities when selling pressure is exhausted.
Key indicators to measure market positioning are: CFTC positioning data, VIX (volatility index), put/call ratios, fund flow data.
REAL YIELDS
Real Yield = Nominal Yield - Expected Inflation
Rising Real Yields: Stronger currency (attracts foreign capital), weaker gold (higher opportunity cost), pressure on growth stocks.
Falling Real Yields: Weaker currency, stronger gold, support for growth/tech equities.
Real yields drive cross-asset flows through opportunity cost (risk-free alternative return), discount rate changes (affects stock valuations), and dollar funding (global capital flows).
BOTTOM-LINE AND DYNAMICS INTERACTIONS
Markets are driven by multiple forces simultaneously. The strongest moves occur when multiple dynamics align in the same direction. Identify the dominant theme (inflation? growth? central bank policy?), understand asset class implications, look for alignment, and monitor for shifts.
Example Scenario - Fed Aggressive Tightening: Fed raises rates and begins QT → U.S. yields rise → Rising real yields → Tighter liquidity → Risk-off sentiment → USD strengthens, AUD/NZD/EM weaken, gold falls, growth stocks underperform.
Success comes from identifying the dominant market theme, understanding implications across asset classes, looking for alignment when multiple dynamics point in the same direction, and monitoring for theme shifts that can reverse the entire market structure quickly.
If you have questions or need any explanation don't hesitate to drop a comment.
Banishing Greed From Trading: Why Wanting More Keeps You LosingGreed is one of the most destructive emotions in trading — it convinces you to ignore your plan, hold too long, and overleverage after a win. In this session, we break down how greed quietly sabotages traders and how to build the mental discipline needed to trade with clarity.
This episode of The Trader’s Therapist explores the psychological roots of greed, how it distorts decision-making, and how professional traders use stoic principles to detach from the outcome and focus purely on execution.
You’ll learn:
The real psychology behind greed and overtrading
How to spot greed before it costs you
Why the “enough” mindset is key to long-term consistency
Practical tools to eliminate emotional trading habits
If you’ve ever turned a winning trade into a loss because you wanted just a little more, this discussion will hit home.
Tags: trading psychology, greed in trading, emotional control, trading discipline, forex mindset, risk management, stoic trading, consistency in trading, mindset for traders, professional trading habits

AUDUSD sell setupOne of the most beautiful sell setup this week. AUDUSD swept a noticeable liquidity high at Supply level, then after CPI news yesterday confirming dollar strength, This led to clear Market structure shift (mss) on XXX/USD pairs.
Retest of the move today confirmed downward pressure on the pair. OB mitigation + imb
As far as there's a prescence of market gap below, my bearish bias is not yet invalidated.
Learn!

Shifts in Global Trade Patterns and Supply ChainsIntroduction: The New Dynamics of Global Trade
The 21st century has witnessed an unprecedented transformation in global trade patterns and supply chains. From the post–World War II dominance of Western industrial economies to the rise of Asia as the global manufacturing hub, and now to an era shaped by digitalization, sustainability, and geopolitical realignment, trade is no longer just about goods crossing borders—it’s about interconnected systems, data flows, and strategic dependencies.
The COVID-19 pandemic, escalating trade wars, and regional conflicts like the Russia–Ukraine war have further reshaped the global trade map, compelling nations and corporations to rethink where and how they source, produce, and distribute goods. Today’s supply chains are not just economic instruments but also political, environmental, and technological battlegrounds.
This essay explores how global trade patterns and supply chains are shifting—highlighting the key forces driving these changes, the regions gaining and losing influence, and the implications for the future of global commerce.
1. Historical Context: From Globalization to Strategic Localization
In the decades following the 1990s, globalization reached its peak. Corporations sought efficiency through offshoring—relocating production to countries with cheaper labor and favorable trade policies. China, in particular, became the “world’s factory,” while emerging economies like Vietnam, Bangladesh, and Mexico grew as secondary manufacturing centers.
However, this model also created vulnerabilities. The overdependence on a few key suppliers and logistical routes meant that any disruption—whether a natural disaster, pandemic, or political tension—could paralyze entire industries. The 2008 global financial crisis and the 2020 pandemic both exposed these structural weaknesses, sparking a paradigm shift from efficiency-driven globalization to resilience-driven regionalization.
This historical backdrop set the stage for today’s reconfiguration of global trade and supply chains.
2. The Decline of Traditional Globalization
The forces of globalization—free trade, open markets, and integrated supply networks—are no longer the sole organizing principles of world commerce. Instead, nations are turning inward or aligning with regional blocs.
Key drivers of this shift include:
Trade Protectionism: The US–China trade war initiated in 2018 marked a turning point. Tariffs on hundreds of billions of dollars’ worth of goods disrupted established supply chains and forced firms to reconsider sourcing strategies.
National Security Concerns: Sensitive technologies, semiconductors, and critical minerals are now treated as strategic assets. Countries are restricting exports and promoting domestic production to avoid dependency.
Pandemic Disruptions: COVID-19 halted global logistics, revealed the fragility of “just-in-time” supply chains, and accelerated the adoption of “just-in-case” models emphasizing inventory buffers and regional diversification.
As a result, global trade growth has slowed. According to the World Trade Organization (WTO), the share of global trade in GDP has plateaued since 2015, signaling a structural slowdown in hyper-globalization.
3. Regionalization and the Rise of New Trade Hubs
A major trend reshaping global trade is the regionalization of supply chains. Instead of sourcing components from far-flung regions, companies are building shorter, more localized networks to reduce risk and improve resilience.
Key examples include:
Asia-Pacific Integration: While China remains central, production is increasingly distributed across ASEAN nations—Vietnam, Indonesia, Malaysia, and Thailand. This “China + 1” strategy helps reduce dependency on Chinese manufacturing while keeping access to its vast ecosystem.
North American Reshoring: Under the USMCA (United States–Mexico–Canada Agreement), companies are bringing manufacturing closer to home, especially in sectors like electronics, autos, and semiconductors. Mexico, benefiting from proximity to the US, has emerged as a major reshoring destination.
European Realignment: The EU is striving for “strategic autonomy” by strengthening internal supply networks, investing in renewable energy, and reducing reliance on Russian gas and Chinese raw materials. Eastern European nations like Poland, Hungary, and the Czech Republic are gaining traction as nearshoring hubs.
Regionalization doesn’t mean de-globalization—it represents a reconfiguration where trade flows become more concentrated within strategic clusters rather than globally dispersed.
4. The Digital Revolution and Smart Supply Chains
Technology is fundamentally transforming how global supply chains operate. Digital tools—ranging from artificial intelligence (AI) and blockchain to the Internet of Things (IoT) and advanced data analytics—are making supply chains smarter, more transparent, and adaptive.
Key technological impacts include:
AI-driven demand forecasting: Firms now predict market shifts with greater precision, reducing overproduction and wastage.
Blockchain for traceability: This ensures transparency across complex multi-tier supplier networks, particularly vital in industries like pharmaceuticals, food, and luxury goods.
Automation and robotics: Advanced robotics and 3D printing are reducing the cost differential between developed and developing countries, encouraging some industries to “reshore” production.
Digital trade platforms: Cloud-based trade management systems are facilitating faster customs clearance and cross-border documentation.
Digitalization thus acts as a “force multiplier,” enabling efficiency even within shorter, regional supply chains.
5. Geopolitical Tensions and Strategic Supply Chains
Geopolitics now plays a decisive role in shaping global trade patterns. The rivalry between major powers—particularly the US and China—has spilled into areas like technology, finance, and infrastructure.
Examples of this geopolitical fragmentation include:
The US–China Tech War: Restrictions on semiconductor exports, Huawei’s global ban, and supply chain decoupling efforts in critical tech sectors.
The Russia–Ukraine Conflict: Disruption in global energy and food supplies led Europe to accelerate diversification away from Russian dependence and invest in renewable alternatives.
Taiwan’s Semiconductor Dominance: Taiwan’s TSMC produces over 60% of the world’s advanced chips, making it a geopolitical flashpoint. Nations are now racing to build domestic semiconductor capabilities.
Governments worldwide are responding with industrial policies—such as the US CHIPS Act and the EU’s Green Deal Industrial Plan—to strengthen domestic supply resilience and reduce strategic vulnerabilities.
6. Sustainability and Green Supply Chains
Sustainability has become another key pillar shaping global trade. Corporations and countries are now judged not just by efficiency but by environmental and social responsibility.
Emerging sustainability trends include:
Carbon Border Adjustments: The EU’s Carbon Border Adjustment Mechanism (CBAM) will impose tariffs on carbon-intensive imports, encouraging cleaner production methods globally.
Circular Supply Chains: Companies are reusing materials, recycling components, and designing products for longevity—reducing dependency on raw material imports.
Renewable Energy Integration: Nations are aligning trade policies with green energy goals, influencing logistics routes and energy-intensive production locations.
This “green reindustrialization” is creating new opportunities for economies investing in clean manufacturing and renewable technologies, while penalizing those relying heavily on fossil fuels.
7. Emerging Markets: The New Centers of Trade Gravity
While developed economies are reshaping strategies for security and sustainability, emerging markets are becoming the new growth engines of global trade.
India: With its large labor force, pro-manufacturing policies (like “Make in India”), and digital infrastructure, India is positioning itself as a credible alternative to China for global manufacturers.
Vietnam and Indonesia: Both are attracting massive FDI inflows in electronics, apparel, and automotive sectors as part of the “China + 1” diversification strategy.
Africa: The African Continental Free Trade Area (AfCFTA) is creating a single market of over a billion people, opening new avenues for intra-African trade and global partnerships.
Latin America: Mexico and Brazil are emerging as nearshoring hubs for North America and Europe respectively.
These shifts mark a rebalancing of global economic power, where trade is less dominated by a single country or region and more evenly distributed across multiple growth centers.
8. The Logistics Revolution: Ports, Corridors, and Connectivity
Global trade depends not only on production but also on transport and logistics. Recent developments show a massive reorientation of global transport networks.
Alternative Shipping Routes: The Russia–Ukraine war and tensions in the Red Sea have redirected maritime traffic toward longer but safer routes, impacting global shipping costs.
India–Middle East–Europe Economic Corridor (IMEC): Announced in 2023, this new trade corridor aims to counterbalance China’s Belt and Road Initiative by linking India with Europe via the Middle East.
Automation in Ports: Smart ports and AI-based logistics management are reducing turnaround times and improving efficiency in global trade routes.
The next phase of trade will rely on infrastructure intelligence—where logistics are powered by data, automation, and alternative energy.
9. Supply Chain Resilience: From Just-in-Time to Just-in-Case
The traditional “just-in-time” model—minimizing inventory to cut costs—proved fragile under recent crises. Today, supply chain resilience has become a corporate priority.
Resilience strategies include:
Diversification of suppliers and locations to avoid overreliance on one country.
Inventory buffers for critical materials like semiconductors, lithium, and rare earths.
Multi-shoring and friend-shoring—favoring trade with politically aligned or nearby nations.
Scenario planning and stress testing to anticipate disruptions.
Resilience no longer means inefficiency—it is an investment in stability and strategic independence.
10. The Future of Global Trade: Multipolar, Digital, and Sustainable
The future of global trade will be multipolar, digital, and sustainability-driven. Power will no longer be concentrated in one global hub like China or the US, but spread across multiple regional clusters—each specializing in distinct industries.
Key trends for the next decade include:
Expansion of digital trade agreements (like the Digital Economy Partnership Agreement, DEPA).
Integration of AI and data analytics for predictive supply chain management.
Growth of sustainable trade finance linked to ESG (Environmental, Social, Governance) metrics.
The rise of cross-border e-commerce as small businesses join global trade through digital platforms.
In essence, globalization is not disappearing—it is evolving into a more complex, technology-enabled network of regional and digital ecosystems.
Conclusion: The Great Reconfiguration
The global trade system is undergoing its most profound transformation in decades. The twin forces of geopolitical realignment and technological innovation are redrawing the map of commerce. Efficiency is no longer the sole metric of success—resilience, sustainability, and strategic autonomy now define the new era of global trade.
Nations that adapt to these shifts—by investing in technology, building sustainable industries, and forging resilient partnerships—will lead the next chapter of globalization. Meanwhile, those clinging to old models of cost-driven offshoring may find themselves sidelined in an increasingly fragmented but interconnected world.
The global trade landscape of the 2030s will thus be characterized not by the dominance of any single power, but by the emergence of a networked, multipolar world—where innovation, adaptability, and trust define the flow of goods, data, and ideas.

Strategies for Investors in Emerging Markets1. Understanding Emerging Markets: The Opportunity and the Risk
Emerging markets are nations transitioning from low-income to middle-income status with improving infrastructure, industrial capacity, and governance. They typically exhibit higher GDP growth rates compared to developed economies but are also prone to fluctuations due to external shocks, commodity cycles, and policy uncertainty.
Opportunities:
High Growth Potential: Economic expansion driven by demographics, technology, and urbanization.
Rising Middle Class: Increasing disposable incomes create strong demand for goods, housing, and financial services.
Untapped Markets: Sectors like renewable energy, digital payments, healthcare, and logistics are still underpenetrated.
Diversification: Adding emerging markets exposure helps investors reduce overreliance on developed market cycles.
Risks:
Political Instability: Policy reversals and corruption can disrupt business environments.
Currency Volatility: Exchange rate fluctuations can erode returns for foreign investors.
Liquidity Risk: Many emerging market stocks and bonds are thinly traded.
Regulatory Uncertainty: Sudden capital controls or taxation changes may impact investments.
The challenge is balancing these opportunities and risks through intelligent portfolio design and disciplined execution.
2. Strategic Approach: Building an Investment Framework
Before diving into specific markets or sectors, investors must establish a framework that defines their objectives, time horizon, and risk tolerance.
A. Long-Term Orientation
Emerging markets tend to be volatile in the short term but rewarding over longer periods. A 7–10 year investment horizon allows investors to ride out short-term turbulence and benefit from structural growth trends like digitization, infrastructure expansion, and industrial modernization.
B. Top-Down vs. Bottom-Up Analysis
Top-Down Approach: Focuses on macroeconomic indicators like GDP growth, fiscal health, inflation, interest rates, and political stability to identify attractive countries or regions.
Bottom-Up Approach: Focuses on identifying fundamentally strong companies within those economies that are capable of delivering consistent earnings growth regardless of external volatility.
A blend of both approaches ensures that investors capture macroeconomic upside while remaining selective at the micro level.
3. Geographic Diversification: Don’t Bet on a Single Country
One of the core principles in emerging market investing is diversification. No two emerging markets move in the same direction at the same time. For example, India’s tech-led growth story differs from Brazil’s commodity-driven economy or Vietnam’s export manufacturing model.
Key Diversification Strategies:
Regional Balance: Spread exposure across Asia, Latin America, Eastern Europe, and Africa.
Economic Model Diversification: Combine consumer-driven economies (India, Indonesia) with export-driven ones (Vietnam, Mexico).
Political Diversity: Mix stable democracies with reform-driven autocracies to spread political risk.
Exchange-Traded Funds (ETFs) like iShares MSCI Emerging Markets ETF (EEM) or Vanguard FTSE Emerging Markets ETF (VWO) provide diversified exposure across multiple markets, reducing country-specific volatility.
4. Sectoral Allocation: Focus on Structural Growth Themes
Emerging markets often lead global trends in specific sectors. Identifying high-growth industries within these regions helps investors capture sustainable long-term returns.
Promising Sectors:
Technology & Digital Infrastructure: The explosion of fintech, e-commerce, and AI startups in India, Indonesia, and Latin America.
Renewable Energy: Transition toward solar, wind, and green hydrogen projects in India, Brazil, and South Africa.
Healthcare & Pharmaceuticals: Growing middle-class populations are demanding better healthcare access and quality.
Consumer Goods & Retail: Expanding domestic consumption supports strong demand for FMCG and retail companies.
Financial Services: Low financial penetration opens vast opportunities for banking, insurance, and digital finance firms.
Investors should look for sectors aligned with long-term development trends and domestic reforms rather than short-term cyclical plays.
5. Currency and Inflation Management
One of the most overlooked risks in emerging market investing is currency fluctuation. Even if local asset prices rise, depreciation in the local currency against the U.S. dollar can wipe out gains for foreign investors.
Strategies to Manage Currency Risk:
Hedged ETFs: Use instruments that neutralize foreign exchange exposure.
Dollar-Cost Averaging: Regular investments over time reduce the impact of exchange rate timing.
Local Currency Bonds: Some investors use local bonds to balance currency exposure since yields often compensate for risk.
Stable Country Selection: Prioritize countries with credible central banks and stable monetary policies (e.g., India or Chile).
Inflation, too, can erode real returns. Investing in inflation-resilient assets such as commodities, real estate, or dividend-paying equities helps offset purchasing power loss.
6. Active vs. Passive Investment Strategies
Passive Investing
Investors can use index funds or ETFs tracking emerging market indices for cost-effective diversification. These instruments provide broad exposure and reduce single-country or single-stock risk.
However, passive strategies may miss out on specific outperformers or structural changes in certain markets.
Active Investing
Active fund managers can exploit inefficiencies in emerging markets by selecting undervalued companies, timing entries, and managing risk dynamically.
Successful active investing requires local knowledge, deep research, and a long-term view.
Blended Approach
Many investors use a core-satellite strategy:
Core portfolio: Passive exposure to broad emerging markets.
Satellite portfolio: Active bets on select countries or sectors with strong upside potential.
This combination provides balance between stability and opportunity.
7. Incorporating ESG and Governance Factors
Environmental, Social, and Governance (ESG) considerations have become integral to investment decisions worldwide. In emerging markets, ESG risks—such as corruption, labor practices, or environmental degradation—can directly affect returns.
ESG Strategies:
Screening Out High-Risk Firms: Avoid companies with poor governance or environmental violations.
Engagement: Encourage companies to improve transparency and sustainability practices.
ESG-Focused Funds: Many global asset managers now offer emerging market ESG ETFs and funds.
ESG adoption is not only ethically sound but also improves long-term performance as well-governed companies often enjoy lower borrowing costs and better investor confidence.
8. Timing and Entry Strategy
Emerging markets are highly sensitive to global liquidity cycles. When interest rates in developed markets rise, capital often flows out of emerging economies, leading to currency depreciation and market corrections.
Timing Tips:
Avoid Herd Behavior: Don’t chase rallies driven by short-term sentiment.
Buy During Corrections: Use market pullbacks to accumulate high-quality stocks at attractive valuations.
Follow Global Monetary Trends: Emerging markets typically perform better when the U.S. dollar weakens and global liquidity expands.
Technical Indicators: Use support levels and moving averages to identify favorable entry points.
Investors who remain disciplined and patient tend to benefit from long-term uptrends following temporary volatility.
9. Using Local Expertise and Partnerships
Investing directly in foreign markets can be complex due to legal, taxation, and information asymmetry challenges.
Collaborating with local fund managers, research firms, or regional ETFs provides better access to data, understanding of cultural nuances, and insight into domestic market behavior.
For example:
Joint ventures with local asset managers can open doors to private equity opportunities.
Local advisory services help navigate regulations and currency repatriation rules.
10. Risk Management and Hedging Tools
Emerging market investors must prioritize capital preservation as much as growth. Key risk management measures include:
Position Sizing: Avoid concentrating too much in a single country or sector.
Stop-Loss and Rebalancing: Regularly review portfolios to lock in gains and cut losses.
Derivatives and Hedging Instruments: Use currency futures or options to mitigate exchange risk.
Fixed Income Allocation: Pair equity exposure with sovereign or corporate bonds for income stability.
Liquidity Buffer: Maintain cash reserves to take advantage of opportunities during volatility spikes.
Effective risk management separates disciplined investors from speculative traders.
11. Case Studies: India and Vietnam
India: The Digital and Consumption Story
India represents one of the strongest long-term emerging market stories, driven by digital transformation, manufacturing expansion under “Make in India,” and a rising young population.
Sectors like IT services, fintech, renewable energy, and capital goods have delivered consistent returns. The government’s focus on infrastructure and fiscal reforms adds structural strength.
Vietnam: The Manufacturing Powerhouse
Vietnam benefits from trade diversification, young labor force, and foreign investment inflows as companies relocate from China. Its export-oriented economy, stable governance, and strategic location make it a regional favorite. However, investors must watch for banking sector vulnerabilities and currency management challenges.
These examples highlight the importance of aligning investment strategy with each country’s unique growth narrative.
12. Long-Term Vision: Compounding in High-Growth Economies
Emerging markets reward investors who think in decades, not quarters. Compounding works best when capital remains invested during both upcycles and corrections. Reinvesting dividends, staying informed on macroeconomic trends, and maintaining a disciplined approach can create exponential growth over time.
Global investors like BlackRock, Fidelity, and Franklin Templeton have consistently emphasized that emerging markets are no longer speculative bets — they are essential components of global portfolios.
Conclusion: Balancing Risk and Reward in the New Global Order
The next wave of global economic growth will likely come from emerging markets. With technological innovation, demographic dividends, and economic reforms, these nations are shaping the new world order.
However, investing in them requires a careful balance between optimism and prudence.
Successful investors in emerging markets:
Diversify broadly.
Focus on long-term structural growth themes.
Actively manage currency and political risks.
Blend passive exposure with active conviction plays.
Stay disciplined during volatility.
Emerging markets are not for the faint-hearted, but for those with patience, research, and strategy — they offer some of the most rewarding opportunities in global investing today.
The way Rate Cuts & Other Events Price InContents
In this idea we will get in to a small deep dive on how rate cuts and most of the other events price in, how you can position your self accordingly, and more. Lets get in to it!
🔹 Important Question
If we were expecting a rate cut and it happens why does price dip in the short term? Lets do a case study.
🔹 Case Study
September 17th, 25bps cuts everybody was hyped. Retail was excited, so why did it go wrong? Look into screen shot 1, we highlighted when the FOMC meeting took place. Price pumped before the FOMC meeting. This is because Interest Rates price in before it happens.
That is how most events play out, 1-2 weeks prior price prices in and according to the event it plays out.
🔹 Different Outcomes
If you were to look at poly market during the last FOMC meeting and the previous ones you could see like 98% people betting its going to be 25bps. That is one indication of what might happen, another on is projections. Many projections were suggesting 25bps as well, so it aligned price priced in before.
Lets say instead of 25bps, 50bps happened or even 75bps. Price would pump up reason being, price priced in based on another expectation. The following would have been the outcome:
No change: Dump 🔴 (Probably hard dump)
25bps: Dump 🔴 (Because priced in before hand)
50bps: Pump 🟢 (Nobody except for insiders were expecting it)
In other words, if a event which is going to be bullish is going to happen price prices in before and based on the event outcome finalization the output plays out.
🔹 Different Type of Events
Lets say something instant just happened, type of events price in at that time. So expected events and unexpected events are completely different. They price in/react different ways.
🔹 How to position
Well as an example if you know Rate Cuts are going to happen on xyz date, prepare for it 2 weeks before position take positions according to forecasts and high bets like poly market (What people bet on the most happens most of the time).
Once the event happens if its a not expected event like instead of 25bps cuts, 50bps happens then keep your position. If its the expected event, then close position. If its like in our rate cut example instead of 25bps its no change then maybe even reverse your position instantly.
⚠️ Disclaimer: Not financial advice.
Thank you
If you have any questions/comments or ideas comment below!
Thank you for reading.

A better alternative to Fibonacci grid🙏🏻 Fibonacci based grid is a great inspiration from the Universe, but imo ain’t the final product, and here it is:
For traders
Use these values above and put em into grid tool here, and you’ll end up with uniform distribution based grid:
1.6134612334371357
1.0196152422706632
0.7886751345948129
0.5
0.21132486540518708
-0.019615242270663247
-0.6134612334371357
Then about how to apply it, you can divide trading activity by analytical units, these are in turn are based on:
^^ by price
^^ by time
^^ by signed volume waves/volume delta
Explanation
If you’ve followed my latest work you know I’ve identified a way to combine higher order moments to construct natural data driven estimates of data’s extremums and “ever possible” values (I still got no idea how no1 Ever posted it anywhere over the last centuries).
Now imagine you got only 2 input values: actual max and min (just like in Fibo grid, it ain’t knows nothing else). Given only these 2 values we can model stuff with uniform distribution that has precisely known values of standardized moments, so we end up with (and remember that uniform distro is symmetric around its mid, so all odd moments are zero):
dev = 1 / math.sqrt(12) //standard deviation
kurt = 1.8 //kurtosis (not excess ofc, the raw one)
hkurt = 27 / 7 //hyperkurtosis, 6th moment, raw af as well
0.5 + dev * hkurt
0.5 + dev * kurt
0.5 + dev
0.5
0.5 - dev
0.5 - dev * kurt
0.5 - dev * hkurt
And the resulting output of it u seen at the beginning of the post, notice how the edges *almost* match your lovely golden ratio.
For wanderers:
Now for the wanderers, creators etc etc etc
We might have a new math constant in our hands.
This can’t be a coincidence that limit levels (the ones at the edges) almost match the golden ratio . What if we find some kind of ‘almost’ uniform distro, where the limit levels would ‘exactly’ match the golden ratio? No problem - Beta distribution with parameters alpha = beta = (smth just a bit greater than 1).
I solved it numerically in python with mpmath library (necessary for high precision stuff, default packages are gonna truncate too much and we work with gamma functions there, high powers, huge numbers).
The following constant used as both parameters for Beta distribution provides us an almost uniform beautiful distro, with a minimal necessary deviation from uniform distro if u pls, just with a lil bit gently smoothed corners, and all connected to fibonacci sequence and golden ratio:
1.013156499304251804283836146883597463164059088989506487984660881392552993230097518061037104047261922219476043198153474114525730243848097530913517155085537693517359999905511951459927003624291626547046737804828112785002512650…
… and it goes on and on. I called it Sagitta constant, because visually it creates that beautiful almost flat shape, the minimal natural curvature. And now if we put this as c in Beta(c, c) following the same levels construction method from before we get these levels:
std = 0.28741741
K = 1.80628205
Hk = 3.88993123
0.5 + std * hk = 1.61803398
0.5 + std * k = 1.01915692
0.5 + std = 0.78741741
0.5 = 0.5
0.5 - std = 0.21258258
0.5 - std * k = -0.01915692
0.5 - std * hk = -0.61803398
Visuals, plots, graphics
^^ here you can see how our resulting distro & derivatives look like, kinda cute aye?
Beta(c, c), where c is our constant Sagitta, actually might be a natural prior for Bayesian stuff, almost a boxcar windowing function for DSP so u gonna tame that famous spectral leakage, or a kernel for KDE, like u name it, every case when u need a uniform shape yet with slightly relaxed endpoints, you can use it in design and architecture.
Go for it bros, test it in your R&D. Maybe some1 gonna use it to prove Riemann assumption conjecture , if u get dat milli send me 25% ima find a good use for it.
∞
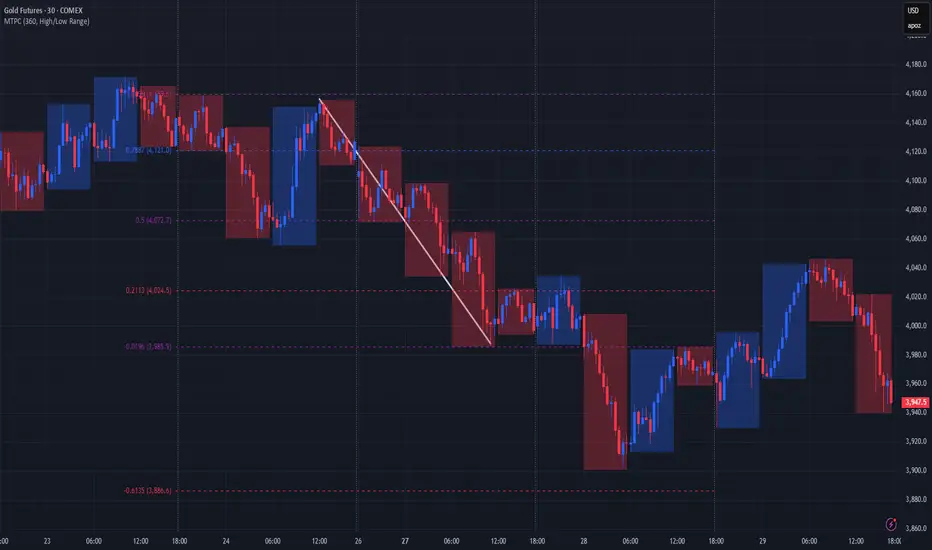
Trust and Release – 4 Times to LET Your Trade GoEvery trader knows the feeling.
You’ve done all the homework, lined up every signal, and double-checked your risk. It’s like preparing to jump out of a plane with your parachute strapped on – exhilarating, but just a little nerve-wracking.
When you’ve put in the work, planned the trade, and set it in motion, there’s only one thing left to do:
Let it go.
Trust the process and release the trade.
Here are four clear-cut signs it’s time to step back and trust your strategy.
SIGN #1: The System Lined Up Perfectly
You’ve got a strategy for a reason.
You trust it, you’ve backtested it, and it’s made it through countless simulations and reviews.
Whether you’re trading Forex, JSE Top 40 or even the Dow Jones Index.
When all the indicators in your system align, it’s time to act, not hesitate.
Remember, the market rewards action, not perfection.
If your system says “go,” then go. No second-guessing.
J.T.T.T – Just Take The Trade
SIGN #2: Your Entry Orders Are All in Place
You’ve placed your entry orders and planned each move with the same precision as a grandmaster in chess.
So why keep checking every tick?
If you’ve calculated your entry points and set them with intention, then you’ve done your job.
This is your chance to let the market do the rest.
Obsessing over every micro-move will only drag you into a rabbit hole of doubt.
Set it and step away.
SIGN #3: It Matches Your Risk & Reward Criteria
Your trade has a purpose, and you’ve defined it by setting your risk and reward limits.
When your setup meets these criteria, there’s no reason to stick around second-guessing the play.
You know your max loss, and you know your target profit. You’ve thought it through rationally, and now it’s time to trust that process.
You’re here to be a professional, not a perfectionist.
SIGN #4: You’ve Nailed Down Your Trade Size
Position sizing is a science in itself, and you’ve already done the math.
You’re not risking more than you’re willing to lose, and you’re confident in the upside.
If you’ve set your trade size according to your plan, you’ve already protected your capital.
The last thing you need is to add or subtract impulsively. Let the size stay as it is and let the market move.
Conclusion: Trust and Release
Trading is as much about discipline as it is about analysis.
If you’ve done the work, checked off every box, and know your limits, the best thing you can do is walk away and let your trade breathe.
Micromanaging won’t make you money; it’ll just wear you out.
The market is like a river – you can’t force it to flow your way. You can only guide your boat down the path you’ve chosen and let the current do its thing.
When you’ve planned the trade, trust yourself enough to leave it alone.
So let’s sum up the FOUR signs to let your trade go.
SIGN #1: The System Lined Up Perfectly
SIGN #2: Your Entry Orders Are All in Place
SIGN #3: It Matches Your Risk & Reward Criteria
SIGN #4: You’ve Nailed Down Your Trade Size

Daily Recap – The Patience Play (QQQ ORB Setup)Fellow traders,
Today was one of those sessions that remind us: sometimes the best trade is no trade at all.
The morning ORB (9:30 – 9:45 NY) gave us a wide initial range with very little conviction in either direction. We saw price flirt with both edges, but no candle could close decisively outside the box. Each push quickly reversed, leaving nothing but wicks and false momentum.
Volume stayed neutral and the EMAs never truly separated — a classic sign of indecision. Even the higher-timeframe (30-min) trend stayed flat, confirming there was no clean alignment to give us the confidence we needed.
Mid-session, price finally poked above the ORB high — but it immediately failed and rolled right back into the range. Later in the day, the real move came to the downside… well past the optimal ORB window. By then, discipline meant staying out.
👉 No setup, no entry — and that’s perfectly fine.
The goal isn’t to trade every day; it’s to trade only when probability lines up.
Tomorrow, we reset with the same rules:
Wait for a clean break and retest outside the ORB.
Confirm volume and trend.
Let the market come to us.
Stay patient, stay disciplined, and remember — consistency is built on the days you don’t force it.
— Trades with B
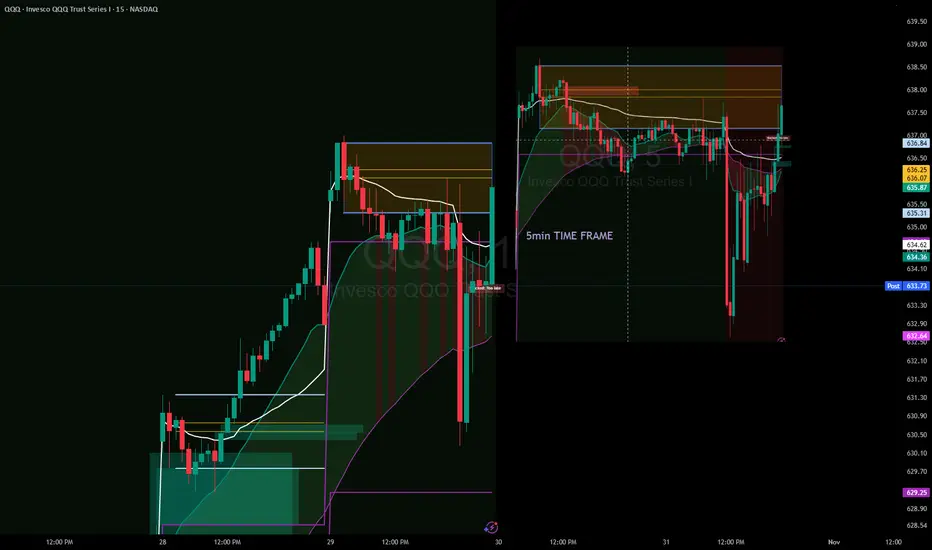
A few important steps for creating robust and winning StrategiesAs the title says, I want to share knowledge & important insights into the best practices for creating robust, trustworthy and profitable trading Strategies here on TradingView.
These bits of information that my team I have gathered throughout the years and have managed to learn through mostly trial and error. Costly errors too .
Many of these points more professional traders know, however, there are some that are quite innovative for all levels of experience in my opinion. Please, feel free to correct me or add more in the comments.
There are a few strategic and tactical changes to our process that made a noticeable difference in the quality of Strategies and Indicators immediately.
Firstly and most importantly, we have all heard about it, but it is having the most data available. A good algorithm, when being built NEEDS to have as many market situations in its training data as possible. Choppy markets, uptrends, downtrends, fakeouts, manipulations - all of these are necessary for the strategy to learn the possible market conditions as much as possible and be prepared for trading on unknown data.
Many may have heard the phrase "History doesn't repeat itself but rhymes well" - you need to have the whole dictionary of price movements to be able to spot when it rhymes and act accordingly.
The TradingView Ultimate plan offers the most data in terms of historical candles and is best suited for creating robust strategies.
___
Secondly, of course, robustness tests. Your algorithm can perform amazingly on training data, but start losing immediately in real time, even if you have trained it on decades of data.
These include Monte-carlo simulations to see best and worst scenarios during the training period. Tests also include the fundamentally important out-of-sample checks . For those who aren’t familiar - this means that you should separate data into training sets and testing sets. You should train your algorithm on some data, then perform a test on unknown to the optimization process data. It's common practice to separate data as 20% training / 20% unknown / 20% training etc. to build a data set that will show how your algorithm performs on unknown to it market movements. Out of sample tests are crucial and you can never trust a strategy that has not been through them.
Walk-forward simulations are similar - you train your algorithm on X amount of data and simulate real-time price feeds and monitor how it performs. You can use the Replay function of TradingView to do walk-forward tests!
When you are doing robustness tests, we have found that a stable strategy performs around 90% similarly in terms of win rate and Sortino ratio compared to training data. The higher the correlation between training performance and out of sample performance, the more risk you can allocate to this algorithm.
___
Now lets move onto some more niche details. Markets don’t behave the same when they are trending downward and when they are trending upwards. We have found that separating parameters for optimization into two - for long and for short - independent of each other, has greatly improved performance and also stability.
Logically it is obvious when you look at market movements. In our case, with cryptocurrencies, there is a clear difference between the duration and intensity of “dumps” and “pumps”. This is normal, since the psychology of traders is different during bearish and bullish periods. Yes, introducing double the amount of parameters into an algorithm, once for long, once for short, can carry the risk of overfitting since the better the optimizer (manual or not), the better the values will be adjusted to fit training data. But if you apply the robustness tests mentioned above, you will find that performance is greatly increased by simply splitting trade logic between long and short. Same goes for indicators.
Some indicators are great for uptrends but not for downtrends. Why have conditions for short positions that include indicators that are great for longs but suck at shorting, when you can use ones that perform better in the given context?
___
Moving on - while overfitting is the main worry when making an algorithm, underoptimization as a result of fear of overfitting is a big threat too . You need to find the right balance by using robustness tests. In the beginning, we had limited access to software to test our strategies out of sample and we found out that we were underoptimizing because we were scared of overfitting, while in reality we were just holding back the performance out of fear. Whats worse is we attributed the losses in live trading to what we thought was overfitting, while in reality we were handicapping the algorithm out of fear.
___
Finally, and this relates to trading in general too, we put in place very strict rules and guidelines on what indicators to use in combination with others and what their parameter range is. We went right to theory and capped the values for each indicator to be within the predefined limits.
A simple example is MACD . Your optimizer might make a condition that includes MACD with a fast length of 200, slow length of 160 and signal length of 100. This may look amazing on backtesting and may work for a bit on live testing, but these values are FUNDAMENTALLY wrong (Investopedia, MACD). You must know what each indicator does and how it calculates its values. Having a fast length bigger than the slow one is completely backwards, but the results may show otherwise.
When you optimize any strategy, manually or with the help of a software, be mindful of the theory. Mathematical formulas don’t care about the indicator’s logic, only about the best combination of numbers to reach the goal you are optimizing for - be it % Return, Profit Factor or other.
Parabolic SAR is another one - you can optimize values like 0.267; 0.001; 0.7899 or the sort and have great performance on backtesting. This, however, is completely wrong when you look into the indicator and it’s default values (Investopedia, Parabolic SAR).
To prevent overfitting and ensure a stable profitability over time, make sure that all parameters are within their theoretical limits and constraints, ideally very close to their default values.
Thank you for reading this long essay and I hope that at least some of our experience will help you in the future. We have suffered greatly due to things like not following trading theory and leaving it all up to pure mathematical optimization, which is ignorant of the principles of the indicators. The separation between Long / Short logic was also an amazing instant improvement.
View the linked idea where we explain the psychology of risk management and suggest a few great ways to calculate and manage your risk when trading - just as important as the strategy itself!
What do you think? Do you use any of these methods; Or better ones?
Let us know in the comments.
Best Harmonic Patterns For Beginners in Forex Gold Trading
In the today's article, I will share with you 4 best harmonic patterns for beginners. We will discuss the structure of each pattern and the rules.
Harmonic ABCD Pattern
That pattern is based on 3 legs of a price movement:
AB leg - impulse leg,
BC leg - retracement with the range of XA leg,
CD leg - impulse leg that has the same direction, the same time horizon and the same length as the XA leg
AB and BC legs should be equal or almost equal, that makes the pattern harmonic.
The completion point of the pattern - D point can be applied for predicting a pullback.
ABCD pattern can be bullish and bearish.
In a bullish ABCD pattern, AB leg is bearish.
D point of the pattern will be a safe point to buy from.
In a bearish ABCD pattern, AB leg is bullish.
D point will be a safe place to sell from.
The next 3 patterns will be based on 4 legs of a move:
XA, AB, BC, CD and will have XABCD structure with the initial point of the pattern being X point.
D point will be a completion point of the pattern from where a pullback will be anticipated.
The type of the harmonic pattern will be identified with Fibonacci numbers. The exact placement of each point of the pattern will define the name of the pattern.
Harmonic Gartley Pattern
In Harmonic Gartley,
B point of the pattern should strictly be between 618 and 786 retracement of the XA leg.
C point should lie between 618 and 786 retracement of AB leg.
D point will be 1.272 extension of AB leg.
Bullish Gartley Pattern will be based on a bullish XA leg.
Bearish Gartley will be based on a bearish XA leg.
Harmonic Bat Pattern
In Harmonic Bat,
B point of the pattern should strictly be between 50 and 618 retracement of the XA leg.
C point should lie between 618 and 1 retracement of AB leg.
D point will be 886 retracement of XA leg.
Bullish Bat Pattern will be based on a bullish XA leg.
Bearish Bat will be based on a bearish XA leg.
Harmonic Cypher Pattern
In Harmonic Cypher,
B point of the pattern should strictly be between 382 and 618 retracement of the XA leg.
C point should lie between 1.272 and 1.414 extension of XA leg.
D point will be 786 retracement of XC leg.
Bullish Cypher will be based on a bullish XA leg.
Bearish Cypher will be based on a bearish XA leg.
These patterns are phenomenally accurate and they are very simple to recognize.
❤️Please, support my work with like, thank you!❤️
I am part of Trade Nation's Influencer program and receive a monthly fee for using their TradingView charts in my analysis.